- Demand for critical minerals is expected to surge on a path to net zero. It is still early days, but global supply and demand imbalances are already emerging, masked only temporarily by the global economic slowdown.
- Long leads for critical mineral supply—for extraction and processing—mean that recent steps undertaken around the world will take time to materialize (and come with substantial policy and implementation risk). And plans do not yet meet net zero ambitions.
- Geo-political risk is taking on a new sheen as China has largely cornered the market for essential inputs to the green transition. Transparency and trade openness are likely mispriced, along with more traditional governance metrics, on this path.
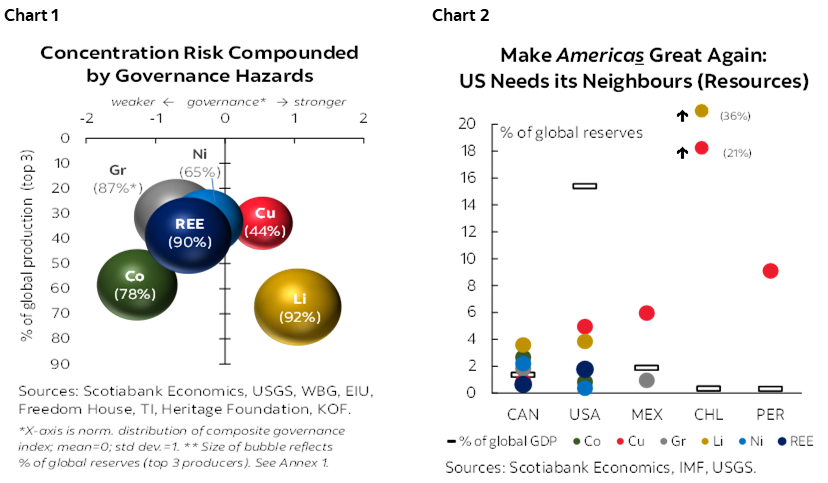
- Extreme concentration in critical mineral capacity is set to leave the rest of the world—and the 1.5° C target—beholden to only a handful of weakly-governed countries (chart 1).
- Increasingly fragmented mineral markets could also drive further price volatility precisely when a stable and predictable landscape is needed to secure much-needed private investment in a capital-intensive sector with long lead-times. This suggests a potentially disruptive path ahead.
- First-best textbook responses call for multilateral solutions that minimise distortions and level the playing field. This is a lofty, but likely naïve goal today.
- Nearshoring has become the runner-up. Rethinking value chains is opening up new opportunities, but this is likely not enough to rival China’s stronghold or get to net zero. There is still too much fragmentation among ‘friends’, even as other trading blocs are bolstering their alliances.
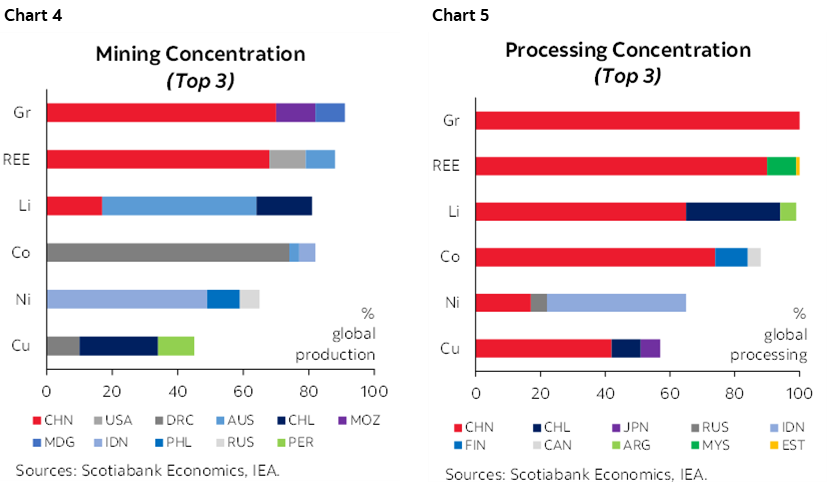
- Canada should be well-positioned to champion a continental corridor for critical minerals. It boasts critical mineral reserves that punch above its global weight along with well-governed institutions, and ambitions to accelerate an orderly transition. The US has the markets, but not the minerals en masse (chart 2). Mexico brings even more resources (and potential) to the mix.
- There are more than enough reserves in the ground to ensure North America (and the southern Pacific Alliance countries) can capitalize on the enormous economic potential on the path to net zero, but deep cooperation will be required to get them out of the ground quickly, cleanly, and responsibly.
HIGH DEMAND, SHORT SUPPLY
Demand for critical minerals will surge on a path to net zero. A rapid roll-out of clean energy technologies—notably, electric vehicles (EVs), battery storage, and low-emission power generation and grids—is necessary to decarbonise the planet. This would place extraordinary pressure on key inputs including copper (Cu), lithium (Li), nickel (Ni), cobalt (Co), graphite (Gr), and rare earth elements (REE). Demand for critical minerals would nearly quadruple—albeit with variations across minerals—by the end of this decade on a net zero path according to the IEA (chart 3). For illustrative purposes only, this report highlights these six prioritized in Canada’s Critical Mineral Strategy.

The uptick is already well underway. The market for key transition minerals has doubled in the last five years, including a near 20% increase in 2022 alone (to USD320 bn) according to the IEA. Capital and exploration spending on critical minerals grew by 30% and 20%, respectively, in 2022 against heightened demand and elevated prices.
Demand is already bumping up against supply. Lithium demand, for example, exceeded supply in 2021 and 2022 despite a 65% increase in output over that period as global EV markets took off (60% of lithium demand stems from EV batteries). Cobalt and nickel were similarly tight in spite of relatively lower EV-related demand (30% and 10%, respectively). Announced plans easily double demand for critical minerals by 2030, even if these extraordinary increases are still insufficient to meet net zero ambitions, according to the IEA.
Mismatches are manifesting in broad-based price swings with exceptional peaks. Lithium carbonate prices crested six times higher than pre-pandemic levels in early 2023; nickel twice as high. Prices have since reversed on the back of an interest rate-induced global economic slowdown, amplified by a sharper economic contraction in Chinese markets, coupled with its rollback of EV subsidies in early 2023. These are mostly cyclical factors. While there is enormous uncertainty around demand (especially given plans and ambitions do not yet line up), it is mostly a debate about the tilt of that upward slope.
More attention to potentially destabilizing bumps along the path is likely warranted.
THE COMMODITY CONUNDRUM
Critical minerals are a highly heterogeneous class of commodities. Obviously, there are dozens of distinct minerals deemed critical to the transition even if the oft-cited list is short. Within the value chain of a given mineral, there are also distinct features. Extraction (or mining) is largely fixed geographically to natural endowments of geological deposits and tends to have project lead times spanning longer than a decade. Refining, in contrast, is intrinsically less-geographically constrained, but relies on a high degree of sophistication and specialisation (in technology and labour) that has driven de facto concentration. Project lead times can be faster but are still mostly multi-year. Both are capital intensive.
Mining and refining are extraordinarily concentrated. The three biggest suppliers of minerals account for 70% of global mined production, on average, according to the IMF (chart 4). More than two-thirds of global output of mined cobalt, graphite, and REE come from a single country. The concentration within refining is even more stark: almost all refined lithium, graphite and REE is sourced from just three processors, and the concentration within other minerals is not much better (chart 5).
Importers are consequently beholden to a small subset of raw resource providers. Given extreme concentration of supply, critical minerals are heavily traded with about 45% of mineral output traded (versus about 30% for energy or agriculture). Roughly half of all importers rely on only three suppliers for key critical minerals (and a quarter on only one), according to IMF analysis. For perspective, only about 10% of crude oil importers rely on three or less suppliers.
GLOBAL G-FORCE
China is the centre of gravity for critical minerals. While its natural endowment is mostly meagre, it has secured a strong foothold in processing almost all critical minerals essential to the green transition. It refines essentially all of the world’s graphite, 90% of rare earths, three-quarters of cobalt, and almost two-thirds of lithium according to the IEA. It has largely cornered the clean-tech market as well. For example, China boasts about 75% of global battery manufacturing capacity; for solar panels, that share is over 80%.
China’s domination in refining hinges on just a handful of suppliers. Almost all of its cobalt comes from the Democratic Republic of the Congo, while the Philippines and Myanmar provide 75–85% of the country’s unrefined nickel and tin ore supplies.
Beijing is aggressively protecting its position. The country has been determinedly diversifying its supply chains by actively investing in mining activities across Africa and Latin America (and trying, at least, in Canada). China has also clearly demonstrated its readiness to throw wrenches into the ramp-up of others’ green transition plans, for example, recently introducing export restrictions on graphite products where it controls over 90% of global output. This landed on the heels of export curbs imposed on lesser-discussed minerals, gallium and germanium earlier in the year.
PLAYING BY A DIFFERENT SET OF RULES
Retrenchment is rising rapidly around the world—not just in China. The OECD has flagged a five-fold increase in export restrictions on critical raw materials since 2009 (chart 6). Over half of current raw material export restrictions are imposed by just five countries (China, India, Russia, Argentina, and DRC). The IEA critical mineral policy tracker documents about 200 policy interventions around the world—half introduced in recent years—with clear implications for trade and investment. For example, India, Zimbabwe and Namibia now ban the export of unprocessed mineral ore. The agency has cautioned that the adequacy of future supply is far from secure given the growing concentration of supply in just a few countries.

Concentration risk is compounded by governance risk. Simply put, the bulk of raw mineral resources sit in just a handful of mostly weakly-governed countries, while they are processed for the most part in an opaque authoritarian one. The resource curse is a well-studied phenomenon in economics, linking natural endowment to weaker governance and conflict. Transparency and trade peril is also understood, but not fully internalised if the last few years have demonstrated anything. Scotiabank Economics cautioned last year that concentration in weakly-governed oil and gas markets would threaten an orderly transition (chart 7). That continues to bear out and the cartel is set to get bigger with Brazil set to join the ranks.

The picture is even starker for critical minerals. We adapt our earlier-developed composite governance indicator to incorporate additional metrics of trade openness in addition to transparency, corruption, rule of law, and democracy (see Annex 1 for details). With few exceptions, there is a very high degree of raw mineral extraction and reserve potential sitting in countries where governance standards fall well-below the rest of the world—often a full-standard deviation or more below (see chart 8 for graphite, others annexed). The scale of concentration is also an order of magnitude higher than within cartel-captured oil markets.

Canada is among the few exceptions. It is still mostly a bit player across raw mineral extraction (think, low- to no-single digits as a share of global output), but Canada has reserves that mostly exceed its global weight (chart 2, again). Furthermore, it is a well-established hub for global mining in equity and debt capital markets with a footprint beyond its own boundaries. Meanwhile, its governance clearly stands above its resource-rich peers by over two standard deviations in many cases. To be fair, Canada is still grappling with its own domestic governance issues around natural resources, but the relative contrast is sharp.
Canada’s resource endowments also run much deeper than its reserves. Reserves are an economic concept that fluctuate with market conditions, whereas resources reflect physical deposits. While reliable data on resources are scant, it is reasonable to assume that economically viable reserves are often just the tip of the iceberg when it comes to adjacent physical deposits. Reserves tend to be relatively stable over time even as minerals are extracted from the ground over time.
PERILS OF PERNICIOUS POLARIZATION
Policymakers should be (more) worried about an increasingly polarized world with fragmented critical mineral markets that could undermine net zero ambitions. The IMF has attempted to put numbers to this threat by dividing the world into geo-political trading blocs along the most recent UNSC vote. While its analysis shows a modest impact on aggregate global output, it points to clear winners and losers across and within blocs, warning of persistent and potentially destabilising price volatility. In its baseline, the IMF projects world prices for key minerals would surge—by 90% on average by 2030—providing a strong price signal for much-needed investment. But in scenarios of high fragmentation, ensuing price volatility would substantially undermine global clean energy investment (in the order of 30% by 2030). Not only do price ebbs and uncertainty undermine upstream investment, exceptional peaks create headwinds for downstream production. Trend declines in clean technologies costs stalled in recent years against elevated input prices (chart 9).

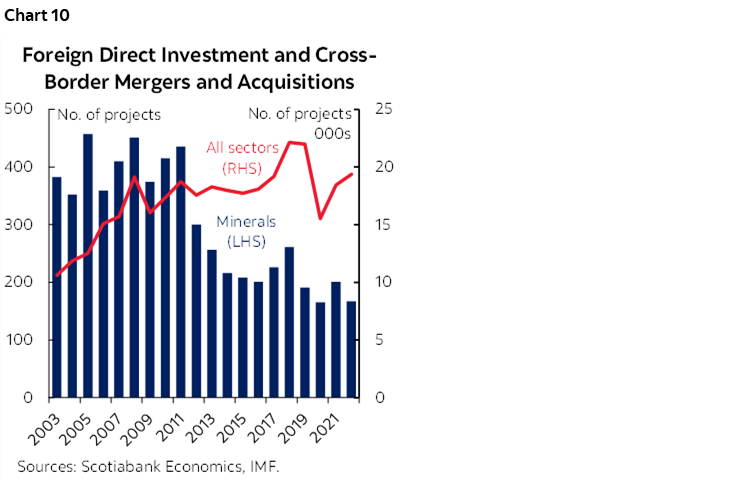
Such precision should be taken with a grain of salt. (Not the least because economists have a poor track-record and training in predicting non-linear disruptions from geo-political risk.) But it is reasonable to assume further price volatility ahead, or worse, price distortions, precisely when strong and stable price signals are needed to secure substantially greater capital investment in the transition. The IEA estimates that annual investments in clean electrification need to ramp up 2.5 times by 2030 (to USD3.4 tn) to be consistent with net zero—including an additional USD1.2 tn in cumulative capex investment in clean energy supply chains. Yet, in highly-traded critical mineral markets where local capital markets are often shallow, foreign direct investment has been anemic over the last decade (chart 10).
Actions to hedge against these risks aren’t adding up. Long leads for supply—mining especially, but also refining—mean that recent steps undertaken in other parts of the world will take time to narrow imbalances (and come with substantial policy and implementation risk). These plans also tend to be disjointed, introducing new twists: planned new battery facilities are largely consistent with net zero while solar PV plans exceed it, for example, but mineral supply does not keep pace.
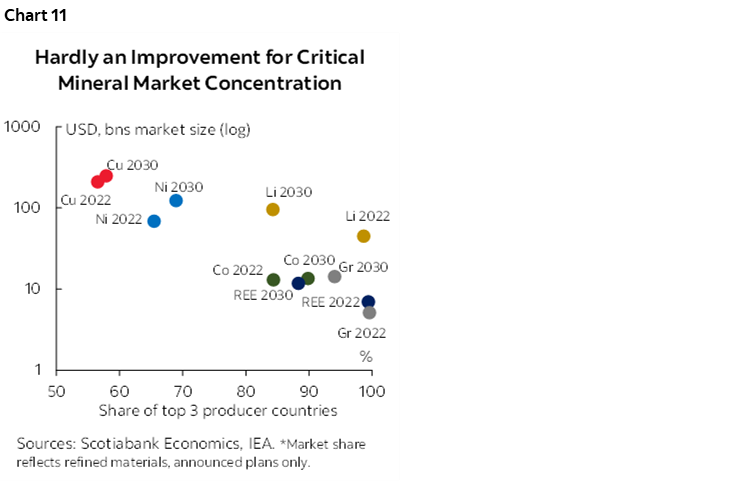
The bottom line is that the needle on diversification barely moves by 2030. The IEA projects only modest improvements for refined lithium, graphite, cobalt and REE based on announced plans, with concentration still sitting in the 85-95% corridor by 2030. They project modest deterioration meanwhile for copper and nickel refining concentration capacity. Half of planned lithium chemical facilities are in China and 90% of planned nickel refining facilities are in Indonesia, according to the IEA (chart 11).
FROM PRINCIPLES TO PRAGMATISM
First-best textbook responses call for multilateral solutions that minimise distortions and level the playing field. The likes of the IMF, World Bank, WTO, IEA and UN bodies have dedicated volumes in various flagship reports making a strong case for international cooperation. (The IMF points out that more than half of global emissions come from the most recent UN voting bloc of China-Russia+.) Some multilaterals lay out compelling pathways to get to net zero or, at least, suggest guardrails to prevent spiraling retrenchment. This is a necessary ambition, but likely a naïve one in today’s context (even before contemplating another potential Trump term ahead).
Nearshoring is a runner-up. Successive (natural and man-made) supply shocks have led global firms to fundamentally reassess their supply chains. An evolving policy landscape is also changing their economics. Largely interchangeable, nearshoring and friendshoring have come to mean bolstering the resilience of value chains as a means to maximising risk-adjusted returns over the long run in a changed geo-political world. There are already signs of tremendous economic opportunities emerging from nearshoring for the region (see Box 1, back for comprehensive coverage by Scotiabank’s Equity Research on critical minerals in the region). But this may not be enough.
There is still likely too much fragmentation among ‘friends’ to rival China’s stronghold on critical mineral supply, and, importantly, to secure a more orderly path to net zero. In a classic case of policy coordination failure, each country is largely developing its own critical mineral strategy to secure its own self-interests (including Canada, US, EU, and Australia). While the US Inflation Reduction Act has provided a much-needed boost to green goals (even if secondary to self-interest), it is shaping up to be a race-to-the-bottom among those that should otherwise be collaborating. Principle-based initiatives like the G7 Mineral Security Partnership look rather hallow when signatories count 30 (13 countries plus the EU) including India.
Any reasonable chance of rivaling China’s stronghold within the next decade requires much deeper engagement. The IMF has called for a ‘green corridor’ among willing partners, but stops shy of details. A joined-up approach would need to go beyond traditional trade and tariff agreements to something akin to a joint industrial strategy or common market concept with an overarching aim of creating a stable and predictable market landscape to attract greater private sector investment, deepen capital market engagement, and seamlessly integrate blended finance solutions in markets that merit it.
FROM CUTTING TIES TO FORGING THEM
Canada should be well-positioned to champion a continental corridor for critical minerals. It boasts critical mineral reserves that mostly punch above its global weight along with well-governed institutions, and ambitions to accelerate an orderly transition. America has the scale for demand and deep capital markets including well-endowed private ones, but not the minerals en masse. Mexico brings its share of resources—natural and human capital—to the table, along with tremendous untapped potential over the medium term. Mexico is also the gateway to the Pacific Alliance partnership (PAC)—that folds in Chile, Colombia and Peru—another trading bloc that punches above its weight in critical mineral endowments.
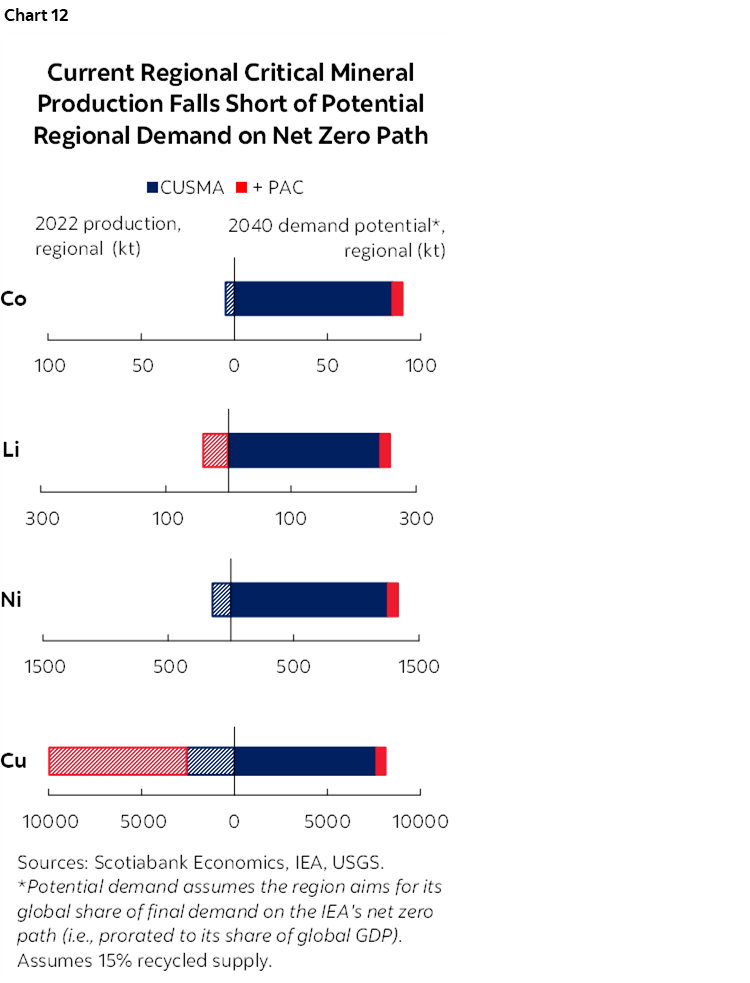
A simple balance sheet exercise demonstrates the potential benefits—and imperative—of stronger integration. Assuming the region vies for its fair share of value-added downstream production along the path to net zero (numbers mostly driven by the US market size), current regional raw material extraction across some key inputs falls well-short of potential demand by 2040 (chart 12). Folding in PAC partners (notably, Chile and Peru) would narrow gaps for some critical minerals such as copper and lithium. Of course, it is not realistic, nor efficient, to aim for regional self-sufficiency, but the exercise highlights the enormity of the potential shortfalls.
The flipside speaks to the enormity of the economic opportunity on a shared pathway to net zero. We calculate that closing potential supply-demand gaps in the region by 2040 could easily imply double-digit growth in output annually over this period for cobalt, nickel, and lithium. Aiming to meet incremental global demand on a path consistent with 1.5° C could push these growth rates even higher across the board. And there are enough reserves within continental boundaries to cover this potential demand. (Note, Mexico also holds promise in graphite, but data limitations preclude inclusion in our analysis.) For countries like Chile and Peru where the mining sector makes an outsized contribution to GDP (14% and 10%, respectively), the opportunities could be transformative.
To be clear, these are not forecasts. Rather these simple sketches should illustrate that the collective prize of getting the regional investment landscape right could be enormous.
THE BOTTOM LINE
The math behind critical mineral demand on a net zero path is enormously ambitious in a perfect world. In an increasingly fragmented one, it is likely impossible. The world is currently failing on the IEA’s essential critical mineral trinity: future supply is not keeping pace with climate-driven scenarios; there has been no progress on diversification of that supply; and consequently, there is little confidence that this supply will be clean, responsible, or secure. Getting there is not entirely impossible, but would require an unprecedented level of cooperation, policy harmonization, and freer flow of capital across borders.
Canada should find the policy and political levers to change that math. Sovereign strategies that secure self-interests first and foremost are likely short-sighted and may leave the region collectively and individually worse off over the medium term. Getting there, practically, likely means starting with fewer, highly-vested partners with a governance bar set high.
BOX 1: SCOTIABANK’S EQUITY RESEARCH ON CRITICAL MINERALS
ESG investment research related to critical minerals. Scotiabank GBM Equity Research’s annual ESG investment research report features the “Scotiabank GBM ESG Analytical Framework,” which evaluates sustainability, societal, and stewardship data for more than 1,000 companies in Scotiabank’s Americas footprint. Critical-minerals mining and processing companies in the S&P/TSX Composite Index, the S&P 500, and the LatAm 100 are competitively ranked and scored based on material ESG factors and risks. Scotiabank’s “ESG Tearsheets” leverage the Scotiabank GBM ESG Analytical Framework and are integrated with Scotiabank GBM company-specific research coverage. Scotiabank GBM also hosts an Annual ESG Conference and Sustainability Summit, which includes expert commentary relevant to energy transition, net zero, and enabling materials and strategies, with key insights and takeaways subsequently detailed in the annual An Attendee’s Notebook publication. Furthermore, the 30 Thoughts report is published monthly, providing the latest insights into the numbers and narrative of ESG; it also includes detailed tracking of energy transition trends and critical minerals–related data.
– Patrick Bryden | Analyst
Base metals and uranium. We reviewed the supply-demand outlook in depth for copper, nickel, zinc, and uranium in our note entitled “Copper and Uranium Fundamentals Shine Despite Uncertainty” published on June 28, 2023. Among the base metals, we continue to prefer copper exposure given very low inventories and our forecast of a balanced near-term market, before transitioning to a large medium-term structural deficit due to supply erosion. We also anticipate copper to be among the biggest beneficiaries of global decarbonization efforts. We remain concerned with near-term oversupply risks in zinc and nickel. With a forecast deficit market, uranium fundamentals continue to improve based on the dual Western World agendas of decarbonization and energy independence. We have also recently reviewed the risk-reward outlook for the copper miners in our note entitled “Revisiting the Risk-Reward Outlook for the Copper Miners” published on November 20, 2023.
– Orest Wowkodaw | Analyst
Resource protectionism (with respect to lithium especially) has been on the rise, largely as governments in resource-rich economies have increasingly looked to participate more actively in the mining/extraction of lithium. While this may come from a desire to retain some form of control over the ownership, exploration, and exploitation of their natural resources, we must consider the economic opportunity that lithium presents. The lithium price rally seen throughout 2022 highlighted exactly how valuable lithium supply could be, and while pricing and sentiment has been weak on the downside, the opportunity remains. Global lithium supply has materialized in a series of distinct waves (Lithium Triangle → Australia → China → Canada/USA/Africa), which highlight the importance of participation and resource/supply chain development. We’ve previously noted (in our “Lithium Playbook” and “Focus On Nearshoring” reports) that foreign direct investment has been welcome, providing much-needed capital required to develop operations—and, amid geopolitical tensions, economic participation in the development of global-scale lithium projects should be key. This is especially true as we’ve seen Chinese players investing directly into several exploration-stage projects across South America and Africa. Given still-evolving critical minerals requirements/mandates (including the U.S. Department of Energy’s recent guidance on “foreign entities of concern”), “friendly” lithium could very quickly be in short supply.
– Ben Isaacson | Analyst
Molybdenum market outlook. In our comment “A Review of the Molybdenum Market; Is the Price Rally Supported by Fundamentals?” we argue that market fundamentals for molybdenum—an essential metal for the ongoing transition to a low-carbon world—have improved, as the global market transitioned from massive oversupply in 2020 to meaningful deficits in 2021 and 2022. We also noted that even if molybdenum production growth may outpace demand in the near term, it remains unclear if returning to a relatively balanced market will be possible. Moreover, our scenario analysis suggested that the risk of a structural molybdenum deficit should increase over time due to accelerating demand and a lack of new copper-molybdenum projects being developed.
– Alfonso Salazar | Analyst
ANNEX: METHODOLOGICAL NOTES
Methodology for comparing governance and trade openness across key critical mineral producing countries.
The six minerals selected for analysis were based on Canada’s Critical Minerals Strategy. Information from the United States Geological Survey’s Commodity Statistics and Information was used to determine the countries of significance for each of the six minerals. (Note: The USGS did not have data on graphite reserves in Canada, and so, information from Natural Resource Canada was used.)
A composite governance indicator was created using six leading, third-party, publicly available indices:
- The World Bank’s World Governance Indicators provides information for over 200 countries along six dimensions of governance: voice and accountability, political stability and absence of violence/terrorism, government effectiveness, regulatory quality, rule of law, and control of corruption. These were averaged to obtain a WGI Composite Indicator.
- The Economist Intelligence Unit’s Democracy Index provides a snapshot of the state of world democracy for 165 independent states and two territories based on five categories: electoral process and pluralism, civil liberties, the functioning of government, political participation, and political culture.
- Transparency International’s Corruption Perceptions Index ranks 180 countries and territories around the world by their perceived levels of public sector corruption.
- Freedom House’s Freedom in the World is a yearly survey that measures the degree of civil liberties and political rights in 195 countries and 15 territories based on a series of 25 indicators derived from the Universal Declaration of Human Rights.
- The 2023 Index of Economic Freedom is an annual guide published by the Heritage Foundation that covers 12 types of freedom in 184 countries. Note: For the calculation of the composite, only three variables were used – trade freedom, investment freedom, and financial freedom.
- KOF Swiss Economic Institute’s Globalization Index measures the political, economic and social dimensions of globalisation for 203 regions. Note: For the calculation of the composite, only ‘Trade Globalisation, de jure’ was used as it incorporates trade regulations, taxes, tariffs, and agreements (2020 latest available data).
The score or rank for each country was normalized to have a mean of zero and a standard deviation of one. A Composite Index of Governance was created by taking the simple average of the six normalized indicators. The charts show results only for the top 3 producing countries, as well as China (if not already there) and Canada, for illustrative purposes. The summary chart (chart 1, page 1) portraying the six minerals together weights the governance score according to the reserve share of the top three producers reflected.
Methodology for estimating potential regional demand in the Americas
The International Energy Agency provides data on potential global demand for various critical minerals under different policy scenarios. Absent more granular, publicly-available data that break down demand by country or region, an assumption is made that final demand is proportionate to each country country’s share of global GDP, calculated from the International Monetary Fund. So, per country demand was estimated by multiplying the share of global GDP with the global demand for a particular mineral under the Net Zero Emissions Scenario. It was assumed 15% of potential demand would be met from recycled supply. A timeframe for analysis, i.e., 2040 was selected to reflect both peak-demand for most minerals on a path to net zero, as well as providing reasonable time-lines for ramp-up in production.


DISCLAIMER
This report has been prepared by Scotiabank Economics as a resource for the clients of Scotiabank. Opinions, estimates and projections contained herein are our own as of the date hereof and are subject to change without notice. The information and opinions contained herein have been compiled or arrived at from sources believed reliable but no representation or warranty, express or implied, is made as to their accuracy or completeness. Neither Scotiabank nor any of its officers, directors, partners, employees or affiliates accepts any liability whatsoever for any direct or consequential loss arising from any use of this report or its contents.
These reports are provided to you for informational purposes only. This report is not, and is not constructed as, an offer to sell or solicitation of any offer to buy any financial instrument, nor shall this report be construed as an opinion as to whether you should enter into any swap or trading strategy involving a swap or any other transaction. The information contained in this report is not intended to be, and does not constitute, a recommendation of a swap or trading strategy involving a swap within the meaning of U.S. Commodity Futures Trading Commission Regulation 23.434 and Appendix A thereto. This material is not intended to be individually tailored to your needs or characteristics and should not be viewed as a “call to action” or suggestion that you enter into a swap or trading strategy involving a swap or any other transaction. Scotiabank may engage in transactions in a manner inconsistent with the views discussed this report and may have positions, or be in the process of acquiring or disposing of positions, referred to in this report.
Scotiabank, its affiliates and any of their respective officers, directors and employees may from time to time take positions in currencies, act as managers, co-managers or underwriters of a public offering or act as principals or agents, deal in, own or act as market makers or advisors, brokers or commercial and/or investment bankers in relation to securities or related derivatives. As a result of these actions, Scotiabank may receive remuneration. All Scotiabank products and services are subject to the terms of applicable agreements and local regulations. Officers, directors and employees of Scotiabank and its affiliates may serve as directors of corporations.
Any securities discussed in this report may not be suitable for all investors. Scotiabank recommends that investors independently evaluate any issuer and security discussed in this report, and consult with any advisors they deem necessary prior to making any investment.
This report and all information, opinions and conclusions contained in it are protected by copyright. This information may not be reproduced without the prior express written consent of Scotiabank.
™ Trademark of The Bank of Nova Scotia. Used under license, where applicable.
Scotiabank, together with “Global Banking and Markets”, is a marketing name for the global corporate and investment banking and capital markets businesses of The Bank of Nova Scotia and certain of its affiliates in the countries where they operate, including; Scotiabank Europe plc; Scotiabank (Ireland) Designated Activity Company; Scotiabank Inverlat S.A., Institución de Banca Múltiple, Grupo Financiero Scotiabank Inverlat, Scotia Inverlat Casa de Bolsa, S.A. de C.V., Grupo Financiero Scotiabank Inverlat, Scotia Inverlat Derivados S.A. de C.V. – all members of the Scotiabank group and authorized users of the Scotiabank mark. The Bank of Nova Scotia is incorporated in Canada with limited liability and is authorised and regulated by the Office of the Superintendent of Financial Institutions Canada. The Bank of Nova Scotia is authorized by the UK Prudential Regulation Authority and is subject to regulation by the UK Financial Conduct Authority and limited regulation by the UK Prudential Regulation Authority. Details about the extent of The Bank of Nova Scotia's regulation by the UK Prudential Regulation Authority are available from us on request. Scotiabank Europe plc is authorized by the UK Prudential Regulation Authority and regulated by the UK Financial Conduct Authority and the UK Prudential Regulation Authority.
Scotiabank Inverlat, S.A., Scotia Inverlat Casa de Bolsa, S.A. de C.V, Grupo Financiero Scotiabank Inverlat, and Scotia Inverlat Derivados, S.A. de C.V., are each authorized and regulated by the Mexican financial authorities.
Not all products and services are offered in all jurisdictions. Services described are available in jurisdictions where permitted by law.