- Chile: Leap year and leading indicators guarantee a new positive surprise in February GDP
- Colombia: The unemployment rate has deteriorated for the first time in three years
- Mexico: Government increases 2024 deficit estimate despite a more optimistic macro outlook; Trade deficit fell in February amid annual increases in both exports and imports
CHILE: LEAP YEAR AND LEADING INDICATORS GUARANTEE A NEW POSITIVE SURPRISE IN FEBRUARY GDP
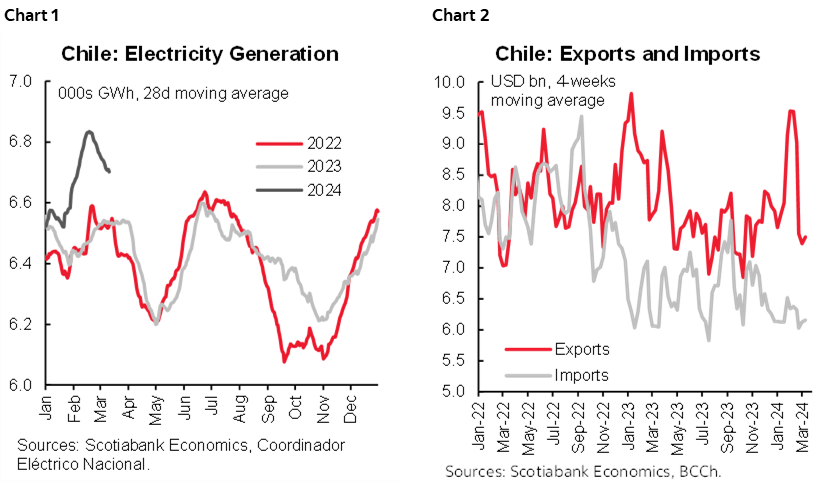
We expect February GDP to grow around 4% y/y, well above the median of the Economist Survey (1.5%) and even above decile nine of the same survey (2.8%). The conjunctural figures show that the momentum of economic activity remained particularly robust in February, both the surprising growth of electricity generation (chart 1) and the resilience of exports (chart 2), plus the additional working day due to the leap year. This would more than offset the stability we estimate for commerce and services. The February GDP will be released on Monday, April 1st, the eve of the Monetary Policy Meeting (April 2nd) and two days before the IPoM (April 3rd).
A (new) major surprise in economic activity at the beginning of the year seems highly probable, which will lead to upward revisions in GDP growth projections for 2024. Recall that the Central Bank (BCCh) projected a range between 1.25 and 2.25% for GDP growth this year, which after January and February’s GDP will most likely be revised significantly upwards.
We revise upward our GDP growth projection for 2024 to 3%. Even in a scenario of stagnant economic activity from February to December, GDP would grow by around 2% in 2024 (carry-over effect), which we see as a growth floor for this year. Indeed, the January impulse that led to recover the level of non-mining activity observed at the end of 2021 is materially relevant for the year’s growth projection.
As for the Monetary Policy Rate, we anticipate a 75bps cut at the next meeting, which would bring the reference rate to 6.5%. This does not leave the door closed to further cuts in the following meetings or to the convergence of the rate to its neutral level by mid-year. However, we see the BCCh justifying a somewhat smaller withdrawal of near-term monetary tightening in light of the positive GDP growth data we anticipate for February, which will lead to an upward adjustment of the GDP growth projection for 2024 in the next IPoM, along with two consecutive upside surprises in inflation.
—Aníbal Alarcón
COLOMBIA: UNEMPLOYMENT RATE RISES IN YEAR-AGO TERMS FOR THE FIRST TIME IN THREE YEARS
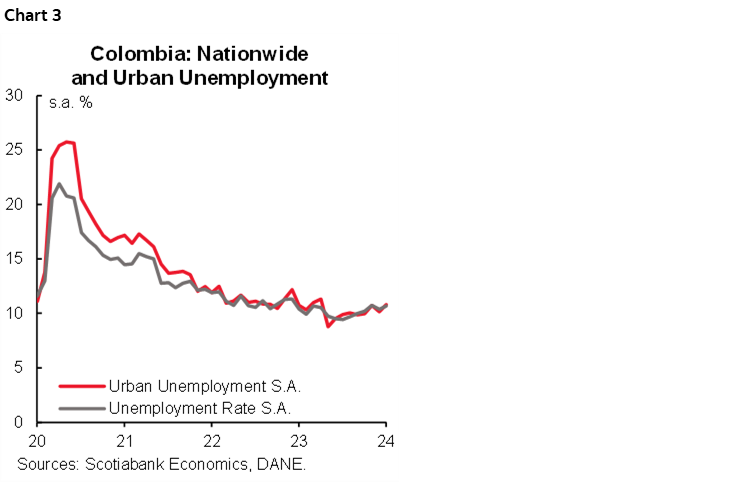
Employment data released on March 27th showed that the nationwide unemployment rate in February 2024 stood at 11.7%, up by 0.3ppts. versus the February 2023 unemployment rate, the first year-on-year increase since March 2021. The urban unemployment rate increased slightly to 11.6% from 11.5% a year ago. On a seasonally adjusted (SA) basis, the unemployment rate for the national total deteriorated from 10.4% in January to 10.7% in February. Similarly, the seasonally adjusted rate for urban areas increased by 0.6 p.p. from the previous month to 10.8% (chart 3).
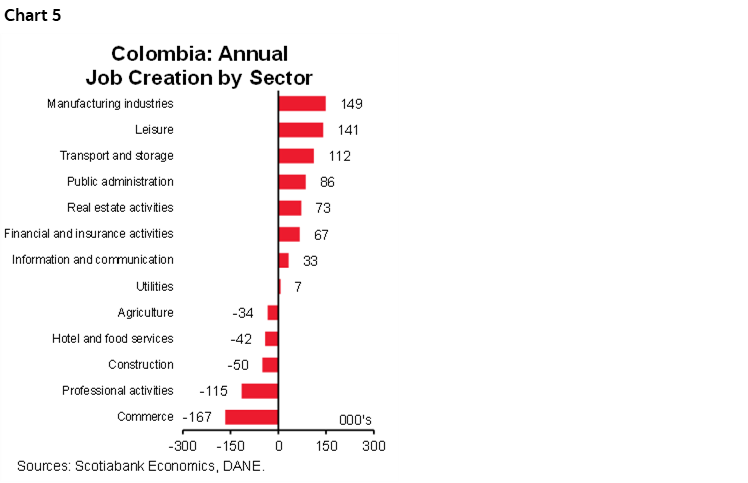
On an annual basis, +260 thousand jobs were created in Colombia, the weakest employment creation in the post-pandemic period but closer to pre-pandemic standards. The average job creation in 2018 was around 144k jobs. Employment creation is slowing down; in 2022, around 1.6 million new jobs were created, and during 2023, the figure has been moderating; in February 2023, job creation was +552 thousand jobs, a little more than double that was recorded in February of this year. The previous dynamic demonstrates that employment is beginning to reflect the slowdown in economic activity. The worst performing sectors in economic activity are now showing employment contraction: commerce posted 167 thousand jobs contracting, which is compatible with the fact that the activity has been in contractionary territory for eleven months as a result of lower household demand, especially for durable and semi-durable goods. On the other side, the manufacturing sector shows a recovery of the labour force since, in the last 2 months, it has positioned itself among the activities with the highest job creation despite maintaining a negative balance in terms of economic activity.
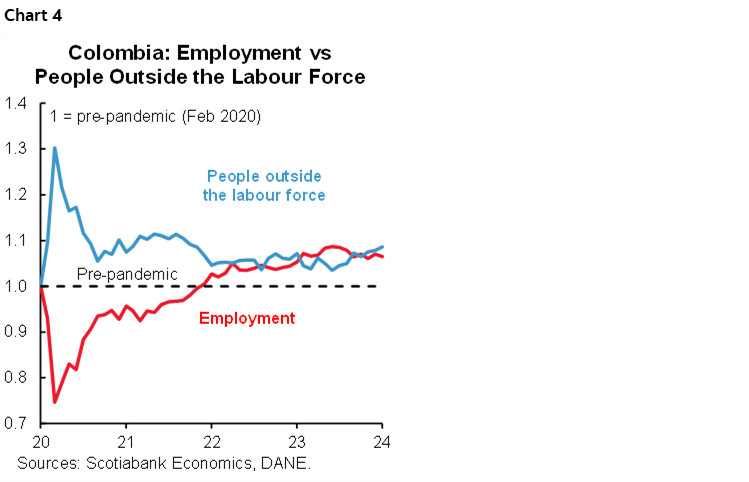
The increase in the population outside the labour force could contribute to the unemployment rate not showing a more significant deterioration. In the original series, the population outside the labour force has shown annual increases in the last six months, with an interruption in November associated with the holiday season. The same occurs when looking at the seasonally adjusted series, which shows a monthly increase for seven months, moving away from the pre-pandemic level (chart 4). The inflow of remittances could be influencing this behaviour; in February, the inflow of remittances increased by 9.76%, reaching USD 913.9 million.
The labour market has begun to reflect the economic slowdown, which could influence the pace of cuts in the Bank of the Republic’s upcoming decisions. Although some members have been more conservative and do not show concern for economic activity, recent data support the idea that sectors such as commerce, which accounts for close to 20% of the total number of employed people, may be experiencing difficulties and a greater impact of high interest rates.
Key information on employment data:
- Job creation is aligning with pre-pandemic levels. In annual terms, +260 thousand new jobs were created, concentrated in eight of the thirteen activities analyzed. The activities that generated the most jobs were: manufacturing industries (+149 thousand), entertainment activities (+141 thousand) and transportation and storage (+112 thousand). Trade and repair of vehicles counterbalanced with -167 thousand, associated to the lower dynamism of the sector, followed by professional activities, with 115 thousand jobs remaining, also in line with the recent economic activity data that showed a lower performance of this activity (chart 5).
- The male population absorbed new jobs. The male population added +136 thousand jobs, which were mainly grouped in service activities, while professional activities, construction, commerce, and agriculture together subtracted 234 thousand jobs. The female population added +124 thousand jobs, with the manufacturing industry being the largest contributor. In annual terms, the manufacturing industry added +149 thousand jobs, of which 68.4% were absorbed by the female population.
- Only five cities registered unemployment rates lower than the national unemployment rate. Medellin was the city with the lowest unemployment rate in the December–February quarter, with a rate of 9.9%, followed by Barranquilla with a rate of 10.4% and Manizales with a rate of 10.9%.
- Informality continued to fall. The informality rate for the national total was 57%, falling by 1.3 p.p. compared to the same month of the previous year. In urban areas, the informality rate was 42.1%, dropping -0.9 p.p. The formal sector added +408 thousand jobs, while informal employment accounted for the remaining 148 thousand jobs.
—Jackeline Piraján & Daniela Silva
MEXICO: GOVERNMENT INCREASES 2024 DEFICIT ESTIMATE DESPITE A MORE OPTIMISTIC MACRO OUTLOOK
The Finance Secretary (SHCP) updated its economic forecasts for 2024 and 2025 in the Preliminary General Economic Policy Guidelines, an annual key document for public policy, with important changes in public finance variables. Although for this year SHCP kept its expected growth range unchanged at 2.5%–3.5%, it did modify the following year’s growth to 2.0%–3.0% from 2.5%–3.5%, both above analysts’ expectations of 2.4% and 1.9%, respectively. As for inflation, the outlook of 3.8% at the end of the year is also more optimistic than the analysts’ forecast of 4.15%. The exchange rate is also lower than the analysts’ estimate of 17.8 USDMXN year-end, 20 cents below the estimate in the 2024 Economic Package (released last September). The expected rate for the end of the year is the only variable in line with analysts for now, at 9.5% for the end of this year, and at 7.0% for 2025 versus 7.5% consensus of private sector.
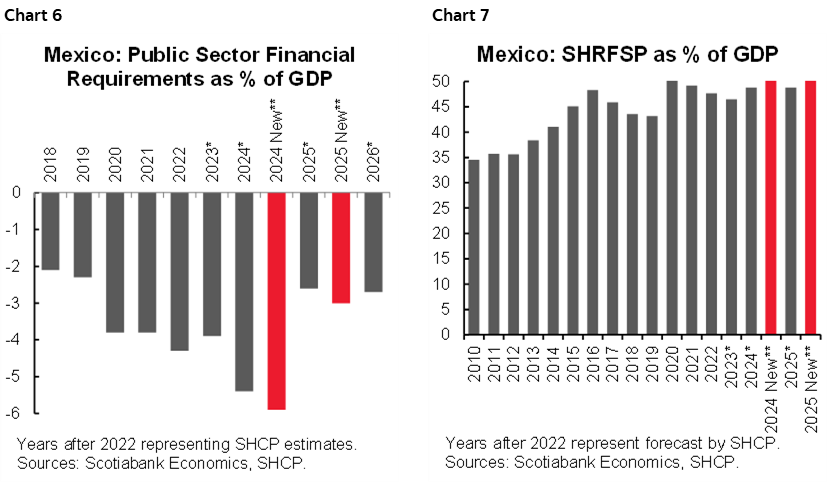
Despite these more optimistic revisions, especially in inflation and the exchange rate with respect to the Economic Package and private analysts’ estimates, the biggest changes took place in the public finance estimates. In particular, a larger deficit in the Public Sector Borrowing Requirements (RFSP in Spanish), from 5.4% initially estimated in the Economic Package to 5.9% now stands out. Since the first estimate, the RFSP for 2024 represented the largest estimated deficit since at least 1988, so with this change, the concern for a larger deficit will be greater by increasing by half a point of GDP, rising from -4.3% in 2023. For the following year, the RFSP estimate stood at 3.0% of GDP, which would imply an adjustment of almost 3.0% in the first year of the next administration, narrowing the margin of maneuver at the beginning of the next six-year term amid pressures in growing expenditures such as pensions. Thus, the broadest measure of debt, the Historical Balance of Public Sector Borrowing Requirements (SHRFSP in Spanish) rose to 50.2% from the 48.8% approved in the Economic Package and 46.8% in 2023, although Hacienda estimates that it will remain unchanged in 2025, at 50.2%, which is also its highest level on record.
In summary, the updated public finance estimates suggest the next administration will encounter a difficult outlook in fiscal balance and debt. With debt as a percentage of GDP, the fiscal space for the next fiscal will be reduced, and at the same time it will be a major challenge to get whatever new policies and programs of the new administration off the ground amidst the effort to keep public finances at a sustainable level. Moreover, the macro framework continues to look more optimistic than what private sector analysts estimate, so it seems likely that we hope will see adjustments in macroeconomic estimates when the negotiations for the economic package take place, towards the second half of the year.
—Miguel Saldaña
TRADE DEFICIT FELL IN FEBRUARY AMID ANNUAL INCREASES IN BOTH EXPORTS AND IMPORTS
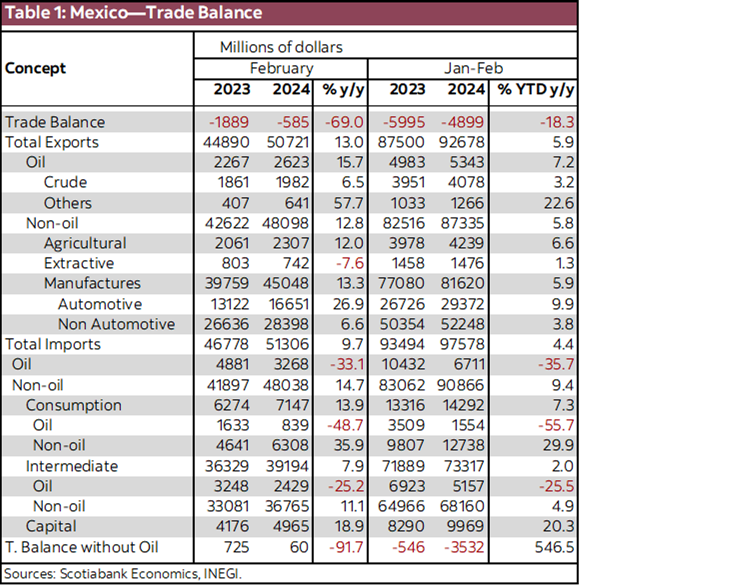
In February, the trade balance reported a deficit of -$584.73 million dollars (md), from -$4.314 billion USD previously. Imports grew 9.7% y/y (-1.0% previously), highlighting capital imports that decelerated to 18.9% (21.9% previously), consumer imports 13.9% (1.5% previously), and intermediate goods 7.9% (-4.0%). On the other hand, exports rose 13.0% (-1.5% previously). Manufacturing exports showed a significant increase of 13.3% (-2.0% previously) derived from a strong rebound in automotive exports to 26.9% (-6.5% previously). In the cumulative January–February, a deficit of -$4.899 billion dollars.
Exports averaged an income of $49.468 billion in the last twelve months, with manufacturing being its most important component with $45.048 billion in February. Within exports, agricultural exports increased +12.0%, while extractive exports maintain their quite irregular behaviour, this time falling -7.6%. On the other hand, oil exports increased +15.7% y/y.
Imports averaged an income of $49.949 billion in the last twelve months, with those of intermediate goods being the largest component with $39.194 billion in February. Within imports, the greatest increase has come from capital goods, which have increased by double digits these first two months of the year. Oil imports recorded their 12th annual drop, this time -33.1%.
Analysts expect a trade deficit at the end of 2024 of -$17.8 billion, according to the responses from the Banxico survey in February, far from the deficit in 2023 of -$5.463 billion, with one of the main reasons being a stronger pace in imports owing to a strong exchange rate, since the peso is currently at its lowest levels since 2015, in addition to the progress of the Mexican economy, pending consumption maintaining an accelerated pace in imported goods, and investments also demanding imported inputs.

—Brian Pérez
DISCLAIMER
This report has been prepared by Scotiabank Economics as a resource for the clients of Scotiabank. Opinions, estimates and projections contained herein are our own as of the date hereof and are subject to change without notice. The information and opinions contained herein have been compiled or arrived at from sources believed reliable but no representation or warranty, express or implied, is made as to their accuracy or completeness. Neither Scotiabank nor any of its officers, directors, partners, employees or affiliates accepts any liability whatsoever for any direct or consequential loss arising from any use of this report or its contents.
These reports are provided to you for informational purposes only. This report is not, and is not constructed as, an offer to sell or solicitation of any offer to buy any financial instrument, nor shall this report be construed as an opinion as to whether you should enter into any swap or trading strategy involving a swap or any other transaction. The information contained in this report is not intended to be, and does not constitute, a recommendation of a swap or trading strategy involving a swap within the meaning of U.S. Commodity Futures Trading Commission Regulation 23.434 and Appendix A thereto. This material is not intended to be individually tailored to your needs or characteristics and should not be viewed as a “call to action” or suggestion that you enter into a swap or trading strategy involving a swap or any other transaction. Scotiabank may engage in transactions in a manner inconsistent with the views discussed this report and may have positions, or be in the process of acquiring or disposing of positions, referred to in this report.
Scotiabank, its affiliates and any of their respective officers, directors and employees may from time to time take positions in currencies, act as managers, co-managers or underwriters of a public offering or act as principals or agents, deal in, own or act as market makers or advisors, brokers or commercial and/or investment bankers in relation to securities or related derivatives. As a result of these actions, Scotiabank may receive remuneration. All Scotiabank products and services are subject to the terms of applicable agreements and local regulations. Officers, directors and employees of Scotiabank and its affiliates may serve as directors of corporations.
Any securities discussed in this report may not be suitable for all investors. Scotiabank recommends that investors independently evaluate any issuer and security discussed in this report, and consult with any advisors they deem necessary prior to making any investment.
This report and all information, opinions and conclusions contained in it are protected by copyright. This information may not be reproduced without the prior express written consent of Scotiabank.
™ Trademark of The Bank of Nova Scotia. Used under license, where applicable.
Scotiabank, together with “Global Banking and Markets”, is a marketing name for the global corporate and investment banking and capital markets businesses of The Bank of Nova Scotia and certain of its affiliates in the countries where they operate, including; Scotiabank Europe plc; Scotiabank (Ireland) Designated Activity Company; Scotiabank Inverlat S.A., Institución de Banca Múltiple, Grupo Financiero Scotiabank Inverlat, Scotia Inverlat Casa de Bolsa, S.A. de C.V., Grupo Financiero Scotiabank Inverlat, Scotia Inverlat Derivados S.A. de C.V. – all members of the Scotiabank group and authorized users of the Scotiabank mark. The Bank of Nova Scotia is incorporated in Canada with limited liability and is authorised and regulated by the Office of the Superintendent of Financial Institutions Canada. The Bank of Nova Scotia is authorized by the UK Prudential Regulation Authority and is subject to regulation by the UK Financial Conduct Authority and limited regulation by the UK Prudential Regulation Authority. Details about the extent of The Bank of Nova Scotia's regulation by the UK Prudential Regulation Authority are available from us on request. Scotiabank Europe plc is authorized by the UK Prudential Regulation Authority and regulated by the UK Financial Conduct Authority and the UK Prudential Regulation Authority.
Scotiabank Inverlat, S.A., Scotia Inverlat Casa de Bolsa, S.A. de C.V, Grupo Financiero Scotiabank Inverlat, and Scotia Inverlat Derivados, S.A. de C.V., are each authorized and regulated by the Mexican financial authorities.
Not all products and services are offered in all jurisdictions. Services described are available in jurisdictions where permitted by law.