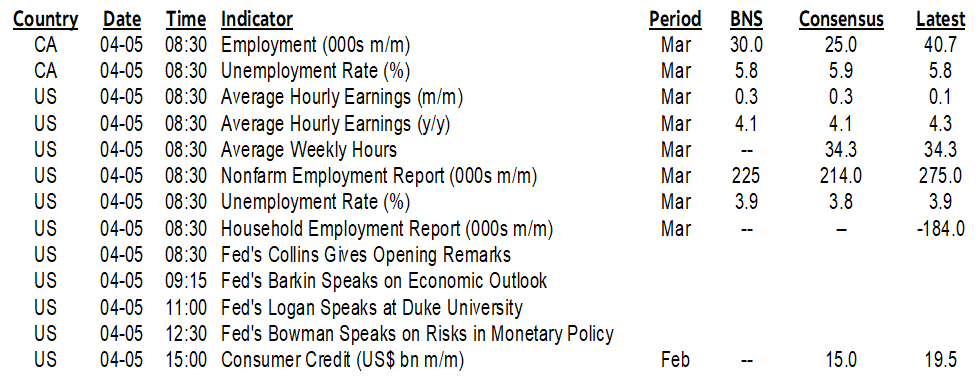
| ON DECK FOR FRIDAY, APRIL 5 |
KEY POINTS:
- Markets brace for N.A. jobs reports
- Nonfarm payrolls preview: it’s not just about payrolls
- Chair Powell sounds far too optimistic on population growth
- Fed officials to weigh in post-payrolls
- Canadian jobs preview: the last pre-BoC reading
- RBI hawkishly held, German factory orders disappointed
There was very little by way of notable macro developments overnight and the focus is squarely upon US and Canadian jobs this morning. The RBI held as expected and with a hawkish tone. German factory orders disappointed (+0.2% m/m, 0.7% consensus, -11.4% prior). We'll also get some post-nonfarm Fed-speak with Barkin, Logan and Bowman on tap.
CANADIAN JOBS PREVIEW
The March Labour Force Survey arrives this morning (8:30amET). It’s the last notable domestic data before the BoC next week. Whatever happens is unlikely to materially affect the BoC outcome as they look for trends, but of course it could impact markets whatever the spin of the wheel reveals. The noise factor on this modest sample household survey is very large and all estimates fall comfortably within it. Most of the work for markets and economists around this report involves the clean-up and implications.
Here are the expectations for the change in total employment and other details:
Scotia: +30k
Consensus median: 25k
Consensus average: 30k skewed by one outlier shop
Range: 10–63k (most within 10–40k)
Std dev: 13.9k
95% confidence interval: +/-57k
Whisper number: n/a
UR: 5.8–5.9 (Scotia 5.8)
Drivers:
- Job openings have come down but are still high enough alongside immigration to result in a solid gain in filled positions.
- GDP is strongly on the mend in Q1 with tracking around 3½% q/q SAAR. GDP and significantly employment growth are correlated over time. Strong growth, strong jobs.
- The survey covers the reference week of March 10th – 16th and therefore should not be affected by the earlier than normal Good Friday.
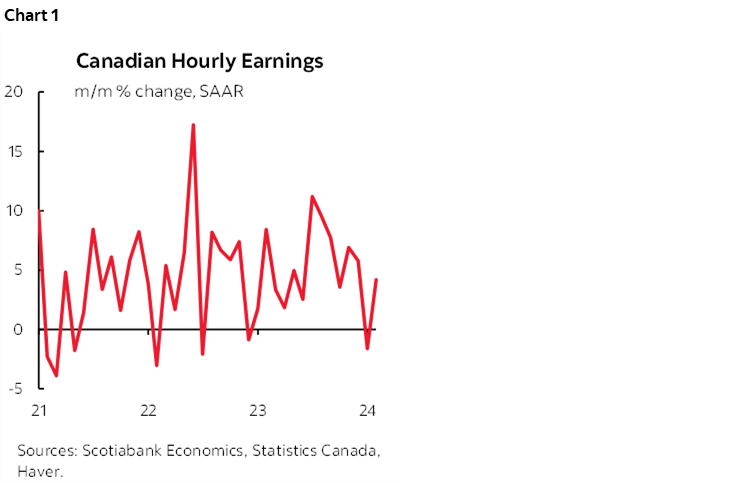
- Watch wages in terms of the m/m SAAR % change in average hourly earnings of permanent employees. It’s one of the four main metrics watched by the BoC for backward looking readings and by far the most timely. The pace picked up somewhat to 4.2% in February after a soft patch in January (chart 1). The year-over-year rate gets quoted more often by the BoC and it is running at about 5% while trend productivity is tumbling.
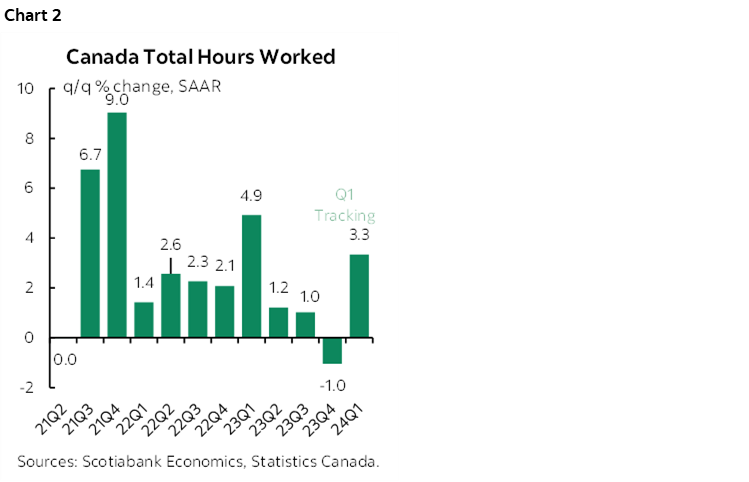
- Also watch hours worked. They are growing at an explosive rate in Q1 (chart 2). Since GDP is hours times labour productivity, the gain in hours is among the supports to our tracking for much stronger Q1 GDP growth than the BoC anticipated.
So what’s the trend? Kaboom, in a word. Canada has created 521k jobs since the end of 2022. 77k in just the first two months of the year. 184k in the past six months. Productivity? Well that’s not so good. Canada, it seems, has opted for a model employed by some emerging markets whereby average worker productivity blows but this is papered over by having large numbers of workers.
US NONFARM PAYROLLS PREVIEW
Nonfarm payrolls and other labour metrics from the CPS and CES surveys get updated at 8:30amET. Here too it’s the last jobs report before the Fed’s next May 1st meeting, though it’s clear they will stay on hold.
Here are expectations for the change in nonfarm payrolls and other details:
Scotia: 225k
Consensus median: 214k
Consensus average: 210k (no material skewness)
Range: 145k – 290k (most within 170k–240k)
Whisper number: 232
Std dev: 25.4k
90% confidence interval: +/- 130k
UR: 3.8% / Scotia 3.9 from 3.9 prior
Drivers:
- NFIB small business hiring plans slipped a touch. Hard to fill positions held steady
- Consumer confidence jobs plentiful edged a little higher
- JOLTS job openings held firm m/m and while they’ve come down, they’re still relatively elevated.
- Job cuts were only slightly higher but not in a way that would materially affect payrolls this morning. Government cuts through the army and veterans agency picked up into the nonfarm reference period, but private job cuts fell.
- ISM-services employment edged a little higher. So did manufacturing.
- initial jobless claims were little changed between reference periods
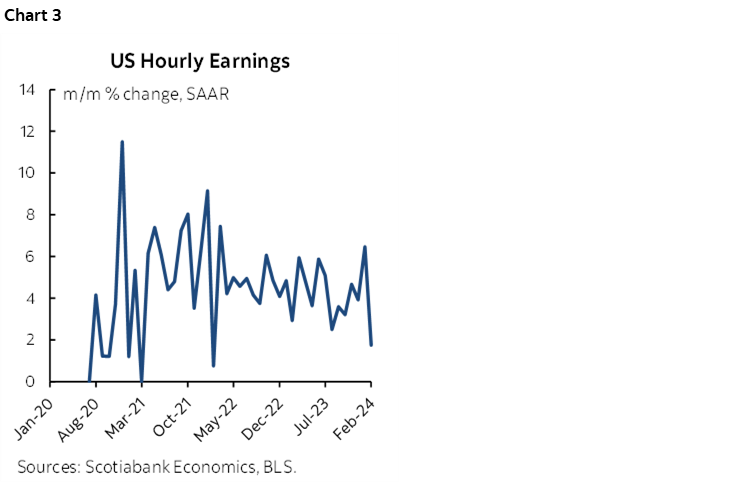
- Key is whether wages rebound. Recall that the prior month saw wages m/m SAAR fell back to closer to 2% which broke the accelerating trend over about the prior six months (chart 3).
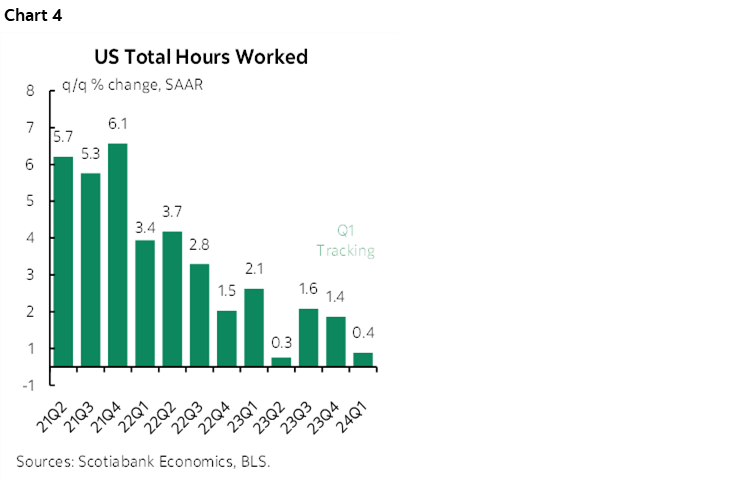
- Also watch hours worked. They have been tracking at only 0.4% q/q SAAR which means to get around 2-ish nowcast tracking for Q1 GDP growth pretty much relies upon productivity (chart 4).
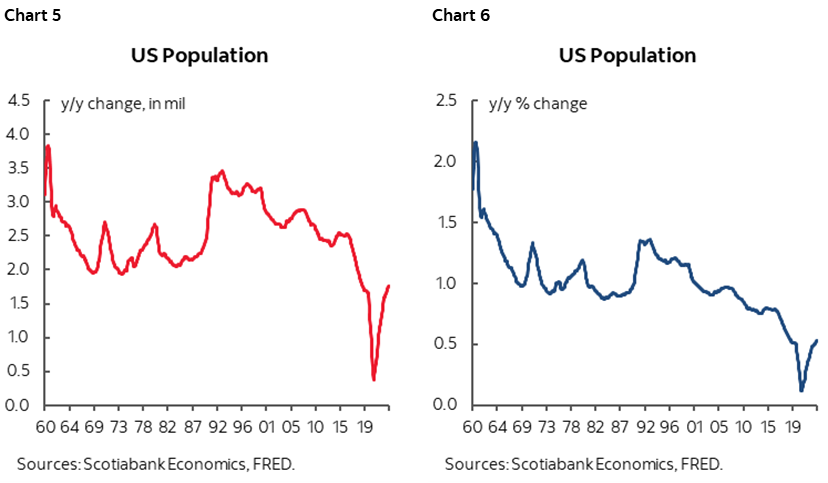
This last point is where I disagreed with Chair Powell’s overly enthusiastic cheerleading of US population growth and how it is expanding the labour force and driving growth while helping to fight inflation. The trend in aggregate hours worked has been weakening for quite a while and is very weak now. The biggest developments in the US labour force over the past year was a pick-up in worker productivity and there is healthy debate over whether than can continue. As for population growth, settle down folks. The wiggles on charts 5 and 6 still portray the US as having very low population growth whether in millions or percentages. Further, the composition of the slight pick-up matters; the Census Bureau flagged both migration and fewer deaths post-pandemic plus lower births (here) while there is a very fair debate about the quality of immigration to the US and hence its role as a disinflationary supply-side driver. If Trump gets elected, then the Fed should be presently mindful toward the likelihood that US population growth will crash again on mass deportations and frozen immigration.
DISCLAIMER
This report has been prepared by Scotiabank Economics as a resource for the clients of Scotiabank. Opinions, estimates and projections contained herein are our own as of the date hereof and are subject to change without notice. The information and opinions contained herein have been compiled or arrived at from sources believed reliable but no representation or warranty, express or implied, is made as to their accuracy or completeness. Neither Scotiabank nor any of its officers, directors, partners, employees or affiliates accepts any liability whatsoever for any direct or consequential loss arising from any use of this report or its contents.
These reports are provided to you for informational purposes only. This report is not, and is not constructed as, an offer to sell or solicitation of any offer to buy any financial instrument, nor shall this report be construed as an opinion as to whether you should enter into any swap or trading strategy involving a swap or any other transaction. The information contained in this report is not intended to be, and does not constitute, a recommendation of a swap or trading strategy involving a swap within the meaning of U.S. Commodity Futures Trading Commission Regulation 23.434 and Appendix A thereto. This material is not intended to be individually tailored to your needs or characteristics and should not be viewed as a “call to action” or suggestion that you enter into a swap or trading strategy involving a swap or any other transaction. Scotiabank may engage in transactions in a manner inconsistent with the views discussed this report and may have positions, or be in the process of acquiring or disposing of positions, referred to in this report.
Scotiabank, its affiliates and any of their respective officers, directors and employees may from time to time take positions in currencies, act as managers, co-managers or underwriters of a public offering or act as principals or agents, deal in, own or act as market makers or advisors, brokers or commercial and/or investment bankers in relation to securities or related derivatives. As a result of these actions, Scotiabank may receive remuneration. All Scotiabank products and services are subject to the terms of applicable agreements and local regulations. Officers, directors and employees of Scotiabank and its affiliates may serve as directors of corporations.
Any securities discussed in this report may not be suitable for all investors. Scotiabank recommends that investors independently evaluate any issuer and security discussed in this report, and consult with any advisors they deem necessary prior to making any investment.
This report and all information, opinions and conclusions contained in it are protected by copyright. This information may not be reproduced without the prior express written consent of Scotiabank.
™ Trademark of The Bank of Nova Scotia. Used under license, where applicable.
Scotiabank, together with “Global Banking and Markets”, is a marketing name for the global corporate and investment banking and capital markets businesses of The Bank of Nova Scotia and certain of its affiliates in the countries where they operate, including; Scotiabank Europe plc; Scotiabank (Ireland) Designated Activity Company; Scotiabank Inverlat S.A., Institución de Banca Múltiple, Grupo Financiero Scotiabank Inverlat, Scotia Inverlat Casa de Bolsa, S.A. de C.V., Grupo Financiero Scotiabank Inverlat, Scotia Inverlat Derivados S.A. de C.V. – all members of the Scotiabank group and authorized users of the Scotiabank mark. The Bank of Nova Scotia is incorporated in Canada with limited liability and is authorised and regulated by the Office of the Superintendent of Financial Institutions Canada. The Bank of Nova Scotia is authorized by the UK Prudential Regulation Authority and is subject to regulation by the UK Financial Conduct Authority and limited regulation by the UK Prudential Regulation Authority. Details about the extent of The Bank of Nova Scotia's regulation by the UK Prudential Regulation Authority are available from us on request. Scotiabank Europe plc is authorized by the UK Prudential Regulation Authority and regulated by the UK Financial Conduct Authority and the UK Prudential Regulation Authority.
Scotiabank Inverlat, S.A., Scotia Inverlat Casa de Bolsa, S.A. de C.V, Grupo Financiero Scotiabank Inverlat, and Scotia Inverlat Derivados, S.A. de C.V., are each authorized and regulated by the Mexican financial authorities.
Not all products and services are offered in all jurisdictions. Services described are available in jurisdictions where permitted by law.