ON DECK FOR TUESDAY, JUNE 11

KEY POINTS:
- Havens in demand as politics rattles risk appetite
- BoE August pricing boosted by UK job market readings
- French spreads widen over bunds on political risk
- MXN drops as Sheinbaum moves quickly on judicial reform
- US to auction 10s after yesterday’s soft 3s outcome
- Canada’s alternative to raising taxes: try saying ‘no’
Risk-off sentiment is putting downward pressure on global equities, a slightly firmer USD, and rallies in havens like US Ts and bunds. European and Mexican politics plus UK data are the main drivers of regional divergences ahead of more US debt sales.
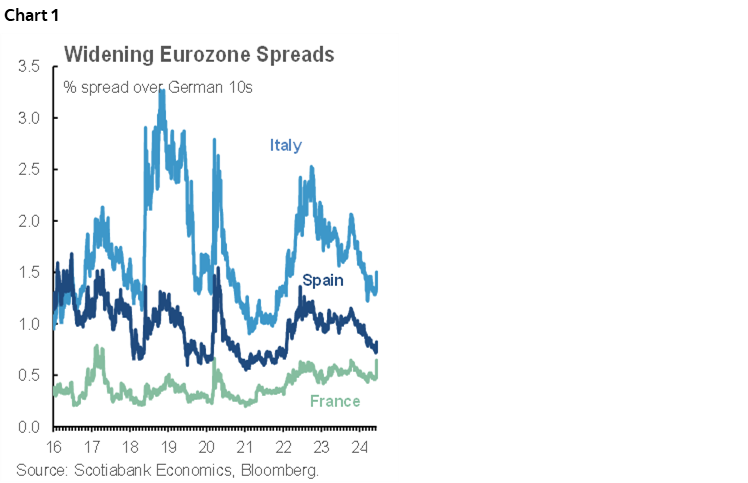
UK job market readings drove slightly stronger pricing for BoE pricing. MXN is depreciating after President-elect Sheinbaum signaled that her strong electoral outcome will first be put to work in addressing judicial reform. French bond spreads are about 9bps wider in 10s over bunds and 7bps in 2s as the aftermath of Macron’s election call and the rumour mill on his (denied) resignation risk should his party lose the snap election work through markets. French spreads are relatively wide compared to history and by contrast to Italian and Spanish spreads (chart 1).
There is also a US$39 billion 10s reopening today (1pmET) that may test Treasury appetite in light of payrolls and yesterday’s soft 3s auction that yielded the lowest 3s bid-to-cover ratio since December. This morning’s rally may help.
UK Job Market is Slowly Rebalancing
UK jobs and wages matter, but CPI the day before the BoE’s decision on June 20th may matter more to determining market pricing for no action then, and little action that is priced for the August meeting. The slightly softer than expected tone to the labour market readings added a few basis points to August BoE pricing which now sits at about 11bps of a cut priced. Gilts are somewhat dearer, but sterling has shaken off the figures following the initial reaction.
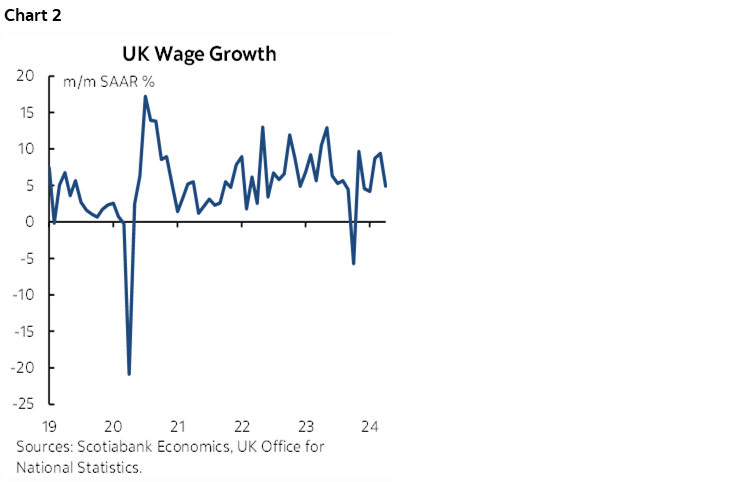
- UK wage growth ebbed but remains too hot (chart 2). Wages were up by 4.9% m/m SAAR in April which is the softest since January, while the 3mo MA sits at 7.7% m/m SAAR. In year over year terms, wages were up by 5.8%, or 6% on a 3mo MA basis.
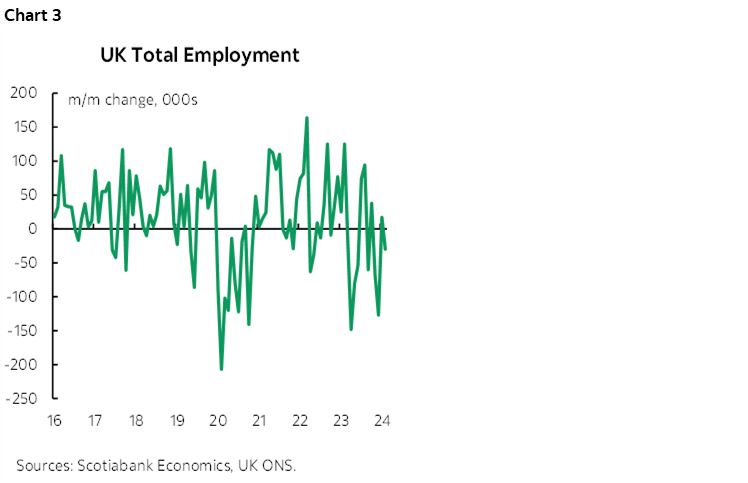
- Total employment lags to April and fell by 30k for the third decline in the first four months of 2024. 207k jobs have been lost so far this year. Chart 3.
- payroll employment fell by a modest 3k in May and is now down by about 14k ytd. Chart 4.
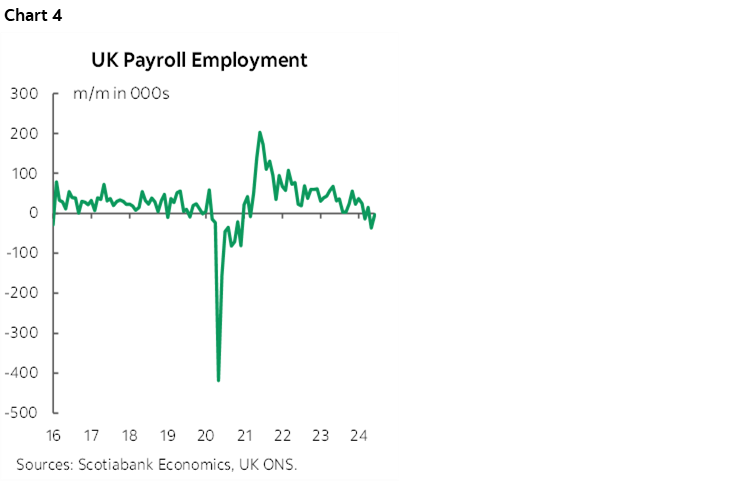
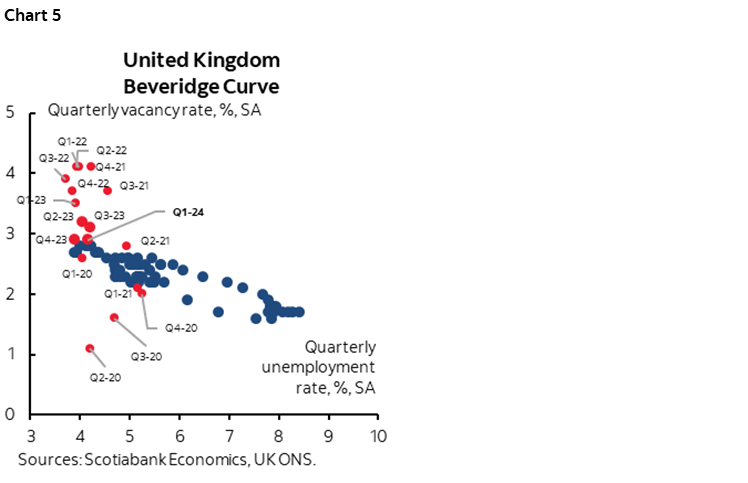
Chart 5 shows the ongoing mild rebalancing of the UK job market that has seen a gradual decline in the job vacancy rate but a fairly sticky unemployment rate that still portrays the job market as on the tighter side of history. There is no question that total employment and payroll employment are on slowing trends. Key is whether lagging wages are next or will prove sticky for much longer.
Other than the US reopening there is nothing material on tap into the N.A. session.
Canada’s Alternative to Tax Hikes — Try Saying ‘No’
Canadian finance minister Freeland said during yesterday’s defence of the capital gains tax grab that rejected all legitimate concerns expressed by many opponents that she could fund her government’s expansionist programs with more debt, but that this would be irresponsible and hence why they chose higher taxes. That’s rich. Really rich. But I’ve got an alternative responsible solution.
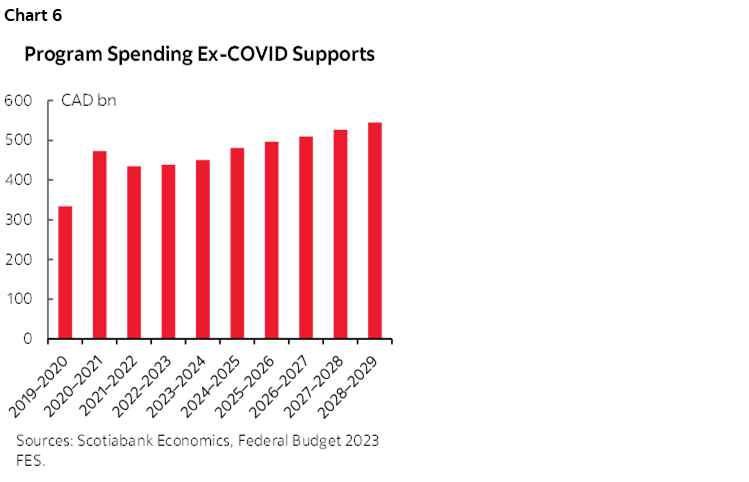
They could reduce spending, immigration and the size of the civil service as all three have added significant pressure on the economy, inflation and rates while sowing future risks. Of course, fiscal expansionists will say that now is not a good time to reduce spending, but there is never a good time to them and that’s how you wind up along the path of serial increases in debt and debt servicing — until the music stops. Program spending ex- the temporary covid supports has risen by about 35% now compared to the fiscal year just before the pandemic struck and the Budget shows it would rise another nearly 30 points to a 63% cumulative rise by FY28–29 compared to FY19–20 (chart 6). The two-thirds expansion of government in under a decade grossly outpaces the cumulative population rise of 8% over the period since the pandemic. If not for excessive program spending the BoC probably wouldn’t have had to hike as much and might have been able to ease more by now.
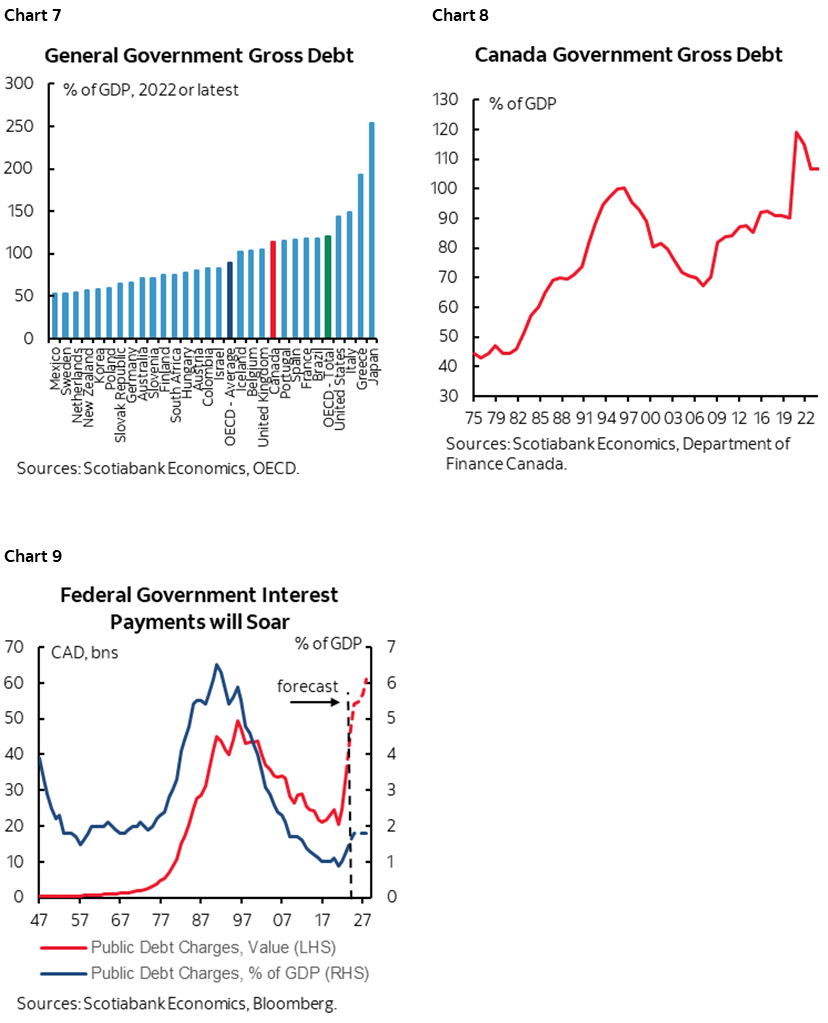
The issue is not that deficit-to-gdp ratios are out of whack. The issue is the serial pattern and Canada never adjusted to the post-pandemic world by repairing finances. Cumulative debt-to-GDP in Canada sits at 113% using full year 2022 figures for all governments in Canada combined and that’s above the OECD average (chart 7) and toward historic highs (chart 8). Some of the countries against which Canada is a little lighter—like the US—have other advantages that a modestly sized market like Canada does not, like reserve currency status (US) or a relatively more closed bond market (Japan). It’s also higher now and will move higher yet. One cost to this is less budget flexibility in future as interest expense soars to the tens of billions of dollars per year just at the Federal level (chart 9), crowding out room for future initiatives and adding to structural deficits. Toss in an unexpected shock and Canada’s not sitting so pretty. What if, say, the US fiscal position really blows out if a free wheeling and heavy spending administration takes power in November and then takes the global bond market with it, thereby raising the cost of debt servicing even more?
As for immigration, since demand from immigration comes first as supply catches up later, Canada has had shelter cost inflation to beat the band, thereby also limiting the BoC’s flexibility. BoC Governor Macklem is too charitable to the government when describing immigration’s effects on demand and supply as coincident to one another.
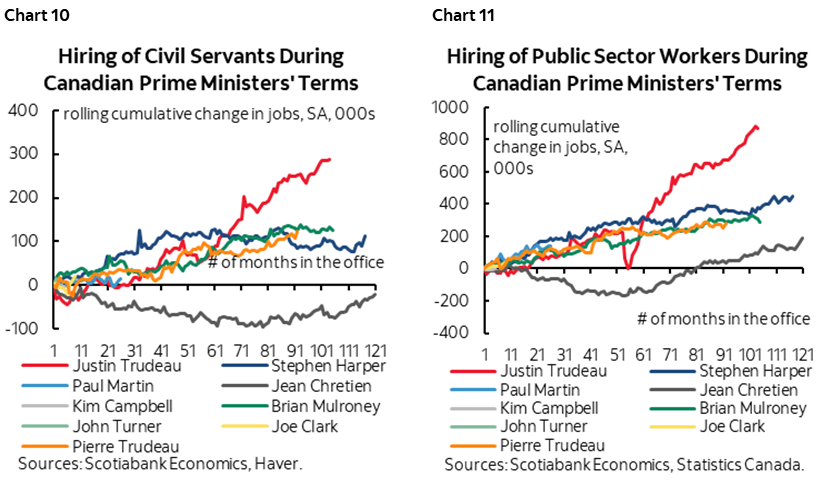
And the size of the total Canadian public sector workforce in Canada has been exploding over many years (charts 10, 11) while driving private sector worker shortages.
Simply put, there is more public policy choice in Canada to raising ill-advised taxes with fallacious logic and issuing more debt. That choice requires knowing when to say no which appears to be an underutilized word in Ottawa these days. Got a cause? We’ve got a cheque. Bigger government solves everything. That’s the mantra, and there’s never a spending proposal that doesn’t sound appealing as government bullies its way further and further into private markets. Get used to more of this into an election year.
DISCLAIMER
This report has been prepared by Scotiabank Economics as a resource for the clients of Scotiabank. Opinions, estimates and projections contained herein are our own as of the date hereof and are subject to change without notice. The information and opinions contained herein have been compiled or arrived at from sources believed reliable but no representation or warranty, express or implied, is made as to their accuracy or completeness. Neither Scotiabank nor any of its officers, directors, partners, employees or affiliates accepts any liability whatsoever for any direct or consequential loss arising from any use of this report or its contents.
These reports are provided to you for informational purposes only. This report is not, and is not constructed as, an offer to sell or solicitation of any offer to buy any financial instrument, nor shall this report be construed as an opinion as to whether you should enter into any swap or trading strategy involving a swap or any other transaction. The information contained in this report is not intended to be, and does not constitute, a recommendation of a swap or trading strategy involving a swap within the meaning of U.S. Commodity Futures Trading Commission Regulation 23.434 and Appendix A thereto. This material is not intended to be individually tailored to your needs or characteristics and should not be viewed as a “call to action” or suggestion that you enter into a swap or trading strategy involving a swap or any other transaction. Scotiabank may engage in transactions in a manner inconsistent with the views discussed this report and may have positions, or be in the process of acquiring or disposing of positions, referred to in this report.
Scotiabank, its affiliates and any of their respective officers, directors and employees may from time to time take positions in currencies, act as managers, co-managers or underwriters of a public offering or act as principals or agents, deal in, own or act as market makers or advisors, brokers or commercial and/or investment bankers in relation to securities or related derivatives. As a result of these actions, Scotiabank may receive remuneration. All Scotiabank products and services are subject to the terms of applicable agreements and local regulations. Officers, directors and employees of Scotiabank and its affiliates may serve as directors of corporations.
Any securities discussed in this report may not be suitable for all investors. Scotiabank recommends that investors independently evaluate any issuer and security discussed in this report, and consult with any advisors they deem necessary prior to making any investment.
This report and all information, opinions and conclusions contained in it are protected by copyright. This information may not be reproduced without the prior express written consent of Scotiabank.
™ Trademark of The Bank of Nova Scotia. Used under license, where applicable.
Scotiabank, together with “Global Banking and Markets”, is a marketing name for the global corporate and investment banking and capital markets businesses of The Bank of Nova Scotia and certain of its affiliates in the countries where they operate, including; Scotiabank Europe plc; Scotiabank (Ireland) Designated Activity Company; Scotiabank Inverlat S.A., Institución de Banca Múltiple, Grupo Financiero Scotiabank Inverlat, Scotia Inverlat Casa de Bolsa, S.A. de C.V., Grupo Financiero Scotiabank Inverlat, Scotia Inverlat Derivados S.A. de C.V. – all members of the Scotiabank group and authorized users of the Scotiabank mark. The Bank of Nova Scotia is incorporated in Canada with limited liability and is authorised and regulated by the Office of the Superintendent of Financial Institutions Canada. The Bank of Nova Scotia is authorized by the UK Prudential Regulation Authority and is subject to regulation by the UK Financial Conduct Authority and limited regulation by the UK Prudential Regulation Authority. Details about the extent of The Bank of Nova Scotia's regulation by the UK Prudential Regulation Authority are available from us on request. Scotiabank Europe plc is authorized by the UK Prudential Regulation Authority and regulated by the UK Financial Conduct Authority and the UK Prudential Regulation Authority.
Scotiabank Inverlat, S.A., Scotia Inverlat Casa de Bolsa, S.A. de C.V, Grupo Financiero Scotiabank Inverlat, and Scotia Inverlat Derivados, S.A. de C.V., are each authorized and regulated by the Mexican financial authorities.
Not all products and services are offered in all jurisdictions. Services described are available in jurisdictions where permitted by law.