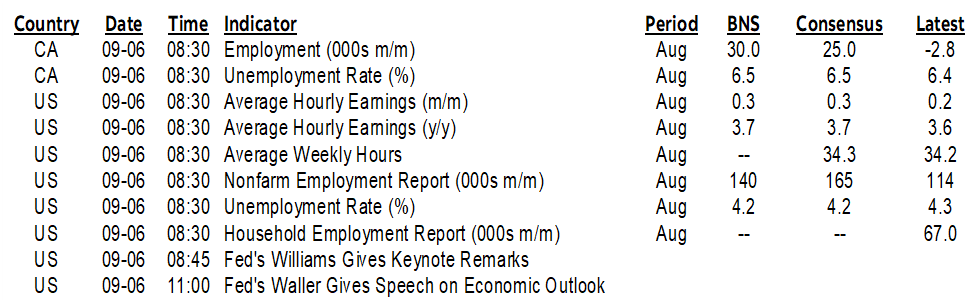
ON DECK FOR FRIDAY, SEPTEMBER 6
KEY POINTS:
- Risk-off sentiment into nonfarm payrolls
- Nonfarm payrolls preview
- A consensus reading for US payrolls would be the worst outcome for Fed pricing
- Canadian jobs preview
US payrolls will dominate global market risks to end the week and with spillover risks into other markets. Canadian jobs offer local market content. Little else is on tap. I’ll share previews of both reports and also see the Global Week Ahead for more (here). This could turn on a dime, for at present, global equities are moving gently lower as sovereign bonds richen.
What’s the worst possible scenario for US payrolls? A hum drum number around consensus that leaves markets still on the fence between -25 and -50 and waiting for next week’s CPI to maybe spark some kind of revelation. Hope for a tail outcome in either direction in order to tip the balance. A much weaker payrolls number and maybe the FOMC upsizes and spikes the dots. But if it’s a strong rebound, then -25 is the best case scenario accompanied by less aggressive dots. The companion household survey's UR may also add a twist given expectations it will dip.
So what’s expected?
NONFARM PAYROLLS PREVIEW
Here is an outline of the expectations for US job market readings that are due out at 8:30amET followed by the loose rationale for payrolls that have a high degree of statistical noise.
- Median consensus: +165k
- Average consensus: 163k (ie: no material skewness)
- Scotia: 140k
- Range: 100k to 208k (most are within about 150k–185k)
- Whisper number: 150k with 548 entries
- 90% confidence interval: +/-130k.
- Std dev: +22.6k
- Avg hourly earnings: 0.3% m/m SA, with some estimates at 0.2%
- UR: 4.2% consensus and Scotia, down from 4.3%
- Hours worked: They were soft in July. Another soft one wouldn’t be good for GDP.
Drivers:
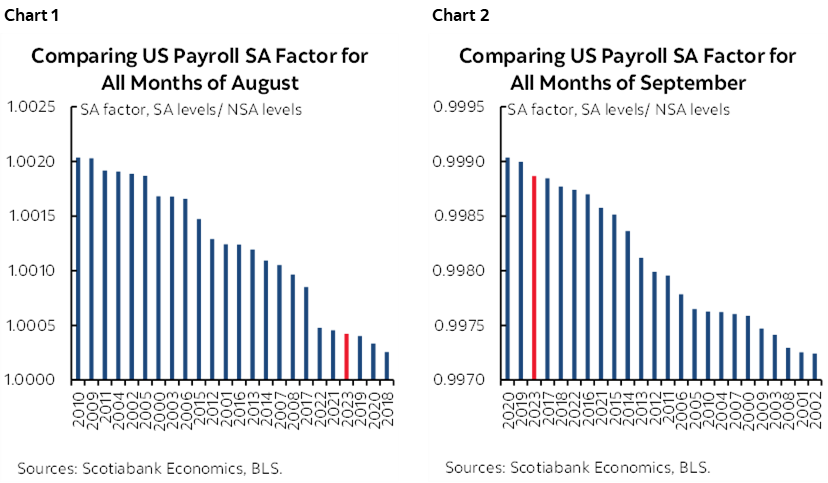
- August will probably be another distorted month for SA factors during the post-pandemic era. Recent SA factors for August have tamped down payrolls by more than like months of August in history (chart 1). That starts to turn around next month (chart 2), but for now, SA haircuts may impair the headline job gain.
- ADP landed at 99k which might suggest that the private component of nonfarm payrolls will be soft, though tracking is poor.
- Consumer confidence jobs plentiful slipped 0.6 points to 32.8 in August.
- NFIB small biz hiring plans pulled back to 13 from 15, lowest since April.
- NFIB job openings hard-to-fill increased, however, to 40 from 38 indicating less success filling jobs.
- JOLTS job openings fell in July to the lowest since January 2021 with negative revisions to June.
- Challenger mass layoffs picked up to 76k, mainly due to a rise in tech sector layoffs.
- Government hiring is unlikely to repeat after adding 60k over the prior two months.
- Education might rebound into the start of the school year; of the 57k rise in health/education, all of it and then some was in health.
- Temp help has been soft, down for two months and trending lower since early 2022. It’s below pre-pandemic levels and may be getting toward equilibrium.
- The UR is expected to dip because it comes from the companion household survey that is unlikely to repeat the massive 718k jump in the labour force in July relative to the paltry 67k employment gain. Look for the two to swing opposite to one another and tighten the job market.
- Most expect trend nominal wage growth of about 0.2–0.3% m/m SA (I’m 0.3). As inflation falls, nominal wage growth around 3½% y/y is driving modest real wage gains.
In all, a panoply of measures would suggest that payrolls will be weak this morning. The usual caution is that these other measures often do not align with payroll changes. Nonfarm is a different beast altogether, with different SA factors, a different sample, high statistical noise and a different methodology including but not limited to its use of the birth-death model adjustments. Furthermore, the household survey’s noise factor is vastly higher than for payrolls and yet it’s the household survey that produces many of the labour market readings like the UR. In short, well, good luck!
CANADIAN JOBS PREVIEW
Canada updates job market readings at the same time as the US this morning (8:30amET). Take what I wrote above about statistical noise in US payrolls and magnify it. Canada releases its payroll measures with about a two-month lag, and so this morning’s readings come from a household survey with a modest sample. In proportionate terms, the confidence intervals around the estimates for job change in Canada’s measures this morning are vastly greater than for US payrolls.
Here is a summary of expectations:
- Median consensus: 25k
- Average consensus: 22.3k (no material skewness)
- Scotia: 30k
- Range: -10k to +35k. (Most within about 20–35k).
- Whisper: n/a
- 95% confidence interval: +/-57k
- Std dev: 11.7k
- Avg hourly earnings: n/a, no useful consensus. The trend in m/m SAAR terms has been running quite warm, driving faster real wage gains.
- UR: 6.5% consensus and Scotia, up from 6.4%
- Hours worked: Watch for a pull back. July registered a large 1% m/m SA jump which was the biggest reported gain since January 2023 which makes for a high jumping off point in terms of momentum into August.
Drivers:
- there is less evidence that Canadian jobs face the same issues with SA factors as the US as written in my Global Week Ahead. In fact, SA factors for this June and this July (months when jobs were weak) were the highest on record, implying that June and July would have been weaker in SA terms if not for this point.
- However, the recent weakness with two roughly flat jobs prints has been due to youths and part-time jobs. This effect may be maturing as the summer job market winds down.
- Youths 15–24 lost 42.5k jobs over the past two months. Men 25+ gained 13k, women 25+ gained 25k.
- I maintain that youths are paying the price for the excessive numbers of nonpermanent residents that have arrived in Canada over the past couple of years through international students and temp foreign workers. As the school year begins, as Canada reduces work eligibility rules for int’l students and as absolute numbers of int’l students and temp foreign workers are reduced, the youth job market may stabilize and pick up.
- There are very few useful advance indicators for job growth in Canada
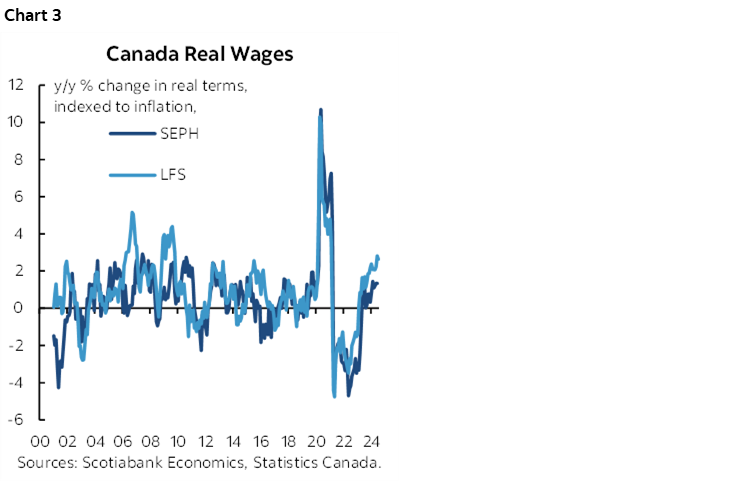
- Wages have been climbed at the sharpest three consecutive m/m SAAR pace since last summer. Real wage growth by LFS and payroll SEPH measures has been on an upswing.
- the reason I think the UR could tick higher is because the labour force is likely to surge. July was anomalous to the prior trend as the labour force fell by 11k despite rapid population growth that was driving much faster gains in the labour force over prior months. Unless jobs really rip, the resumption of population-fed gains in labour supply should push the UR higher. This could swing in the other direction with cooling labour force expansion and potentially downward pressure on the unemployment rate when movement toward changing immigration policy translates into data.
- The further reason for a potential tick higher in the UR is that its rise has been mostly fed by temps, aka nonpermanent residents including international students, temporary foreign workers and asylum seekers that have been allowed to arrive in Canada in vastly excessive numbers. This effect is likely to persist in the short-term before waning as soon as into next year.
In summation, the job market in Canada has been stronger under the hood than the headline job reading over the past couple of months, but let’s see what this morning’s numbers reveal. This position is informed by the fact that the softness has been skewed toward the youth market that has been messed up by Ottawa’s mismanagement of temps. Take that out, and the rest of the job market is performing better alongside persistent wage pressures marked by accelerating real wage gains (chart 3). Be careful toward dismissing that latter observation as a lagging indicator because, unlike the US, collective bargaining is a much more important factor in Canada as many more contracts face wage resets and they filter into hard wage data with a lag.
DISCLAIMER
This report has been prepared by Scotiabank Economics as a resource for the clients of Scotiabank. Opinions, estimates and projections contained herein are our own as of the date hereof and are subject to change without notice. The information and opinions contained herein have been compiled or arrived at from sources believed reliable but no representation or warranty, express or implied, is made as to their accuracy or completeness. Neither Scotiabank nor any of its officers, directors, partners, employees or affiliates accepts any liability whatsoever for any direct or consequential loss arising from any use of this report or its contents.
These reports are provided to you for informational purposes only. This report is not, and is not constructed as, an offer to sell or solicitation of any offer to buy any financial instrument, nor shall this report be construed as an opinion as to whether you should enter into any swap or trading strategy involving a swap or any other transaction. The information contained in this report is not intended to be, and does not constitute, a recommendation of a swap or trading strategy involving a swap within the meaning of U.S. Commodity Futures Trading Commission Regulation 23.434 and Appendix A thereto. This material is not intended to be individually tailored to your needs or characteristics and should not be viewed as a “call to action” or suggestion that you enter into a swap or trading strategy involving a swap or any other transaction. Scotiabank may engage in transactions in a manner inconsistent with the views discussed this report and may have positions, or be in the process of acquiring or disposing of positions, referred to in this report.
Scotiabank, its affiliates and any of their respective officers, directors and employees may from time to time take positions in currencies, act as managers, co-managers or underwriters of a public offering or act as principals or agents, deal in, own or act as market makers or advisors, brokers or commercial and/or investment bankers in relation to securities or related derivatives. As a result of these actions, Scotiabank may receive remuneration. All Scotiabank products and services are subject to the terms of applicable agreements and local regulations. Officers, directors and employees of Scotiabank and its affiliates may serve as directors of corporations.
Any securities discussed in this report may not be suitable for all investors. Scotiabank recommends that investors independently evaluate any issuer and security discussed in this report, and consult with any advisors they deem necessary prior to making any investment.
This report and all information, opinions and conclusions contained in it are protected by copyright. This information may not be reproduced without the prior express written consent of Scotiabank.
™ Trademark of The Bank of Nova Scotia. Used under license, where applicable.
Scotiabank, together with “Global Banking and Markets”, is a marketing name for the global corporate and investment banking and capital markets businesses of The Bank of Nova Scotia and certain of its affiliates in the countries where they operate, including; Scotiabank Europe plc; Scotiabank (Ireland) Designated Activity Company; Scotiabank Inverlat S.A., Institución de Banca Múltiple, Grupo Financiero Scotiabank Inverlat, Scotia Inverlat Casa de Bolsa, S.A. de C.V., Grupo Financiero Scotiabank Inverlat, Scotia Inverlat Derivados S.A. de C.V. – all members of the Scotiabank group and authorized users of the Scotiabank mark. The Bank of Nova Scotia is incorporated in Canada with limited liability and is authorised and regulated by the Office of the Superintendent of Financial Institutions Canada. The Bank of Nova Scotia is authorized by the UK Prudential Regulation Authority and is subject to regulation by the UK Financial Conduct Authority and limited regulation by the UK Prudential Regulation Authority. Details about the extent of The Bank of Nova Scotia's regulation by the UK Prudential Regulation Authority are available from us on request. Scotiabank Europe plc is authorized by the UK Prudential Regulation Authority and regulated by the UK Financial Conduct Authority and the UK Prudential Regulation Authority.
Scotiabank Inverlat, S.A., Scotia Inverlat Casa de Bolsa, S.A. de C.V, Grupo Financiero Scotiabank Inverlat, and Scotia Inverlat Derivados, S.A. de C.V., are each authorized and regulated by the Mexican financial authorities.
Not all products and services are offered in all jurisdictions. Services described are available in jurisdictions where permitted by law.