ON DECK FOR MONDAY, SEPTEMBER 9

KEY POINTS:
- Markets shake off Friday’s post-payrolls reaction
- Chinese core prices are falling
- Surveying the evidence on Chinese deflation…
- ...and how the Fed might wake up the PBOC…
- ...as US election risk looms large
As a reminder, please see the Global Week Ahead—What You Thought You Knew About Canadian Consumers Is All Wrong (here). Key topics include:
- Canadian consumers could pose tsunami risk to the economy
- US CPI: will core services inflation be rejuvenated?
- ECB to cut, adjust policy rate bands
- BoC’s Macklem to speak on trade post jobs
- Peru’s central bank expected to cut again
- Russia’s central bank may hike again on wartime inflation
- Harris versus Trump round 1
- Other global indicators to focus on China, UK jobs
It’s a really light morning with nothing much of consequence by way of macro developments. Stocks are rebounding somewhat across N.A. futures and European cash markets with only Asian exchanges in the red as they catch up to Friday’s developments since they were shut when nonfarm landed. Sovereign bonds are mildly cheaper across most global benchmarks. The dollar is firmer except versus CAD and MXN. Oil prices are up by about 1%.
CHINESE CORE CPI FALLS AGAIN
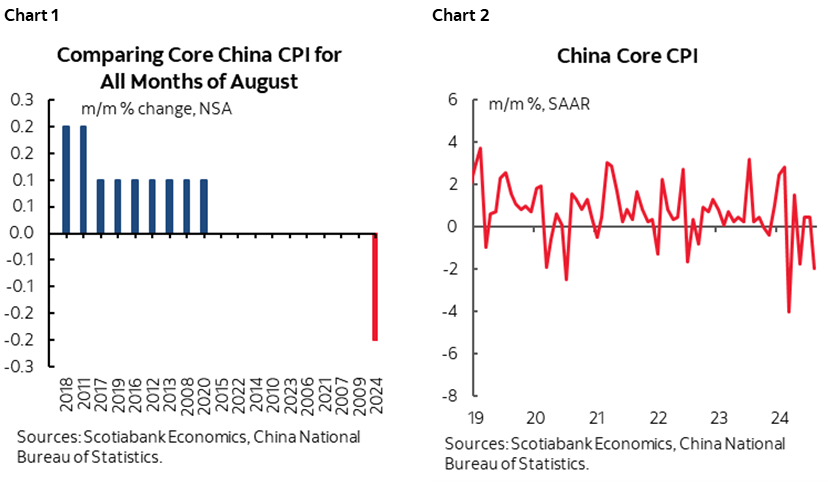
China’s CPI inflation landed at 0.6% y/y (0.5% prior, 0.7% consensus) with core at 0.3% y/y. That remains very soft. August was an outlier in terms of seasonally unadjusted core CPI compared to like months of August in the past (chart 1) and core CPI m/m at a seasonally adjusted and annualized pace is trending lower (chart 2).
But is it deflation? That’s more complex than merely pointing to the price changes at the margin. Deflation is a sustained, economy-wide decline in a broad set of prices that is expected to continue and that fundamentally alters behaviour such as toward postponing consumer spending and business investment into future periods when prices are expected to be lower. It can be very difficult to arrest which was the problem in the 1930s.
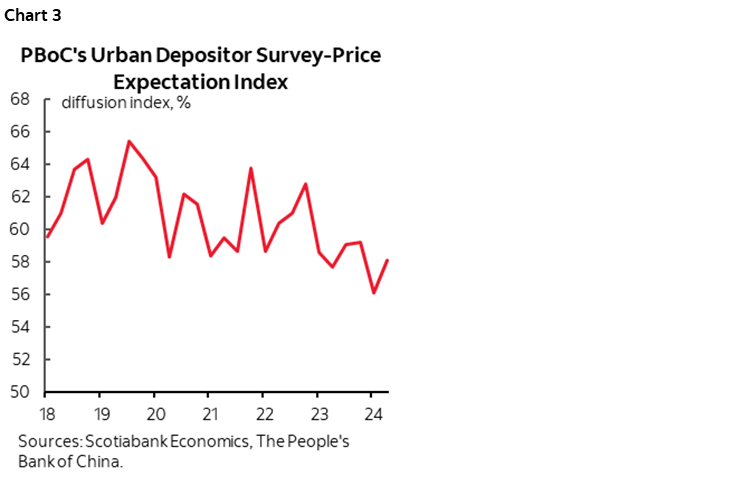
We can look at expectations using a couple of sources. One is the PBOC’s urban depositors survey that includes several measures including expectations for prices and house prices (chart 3 and here). The price expectation index increased in 2024Q2 with 23.5% of respondents saying they expect higher prices next quarter, 54.5% expecting little change and 9.4% expecting lower prices with about 13% unsure. The overall expected price index has been softening along a very long-term trend since the aftermath of the GFC. No real deflation expectations there, but surveys of consumer attitudes are not necessarily reliable and perhaps more so in China’s system!
What about forecasters? Bloomberg consensus shows that forecasters expect prices to rise by 1.5% y/y next year and 1.9% in 2026. No deflation there either, but let’s just say that forecasters have been known to make mistakes!
On house prices, the same PBOC survey shows 11% expect higher prices, 52% expect little change, and 23% expect a drop with about 14% unsure about the next quarter.
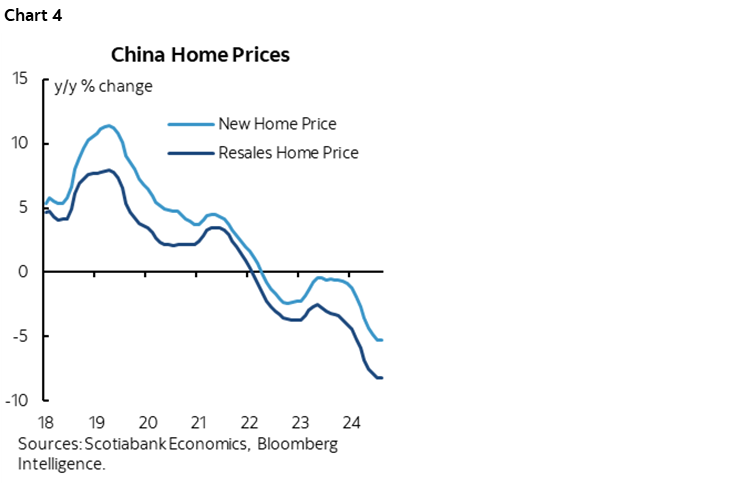
And yet, new house prices are down by about 5.3% y/y and existing home prices are down 8.2% y/y (chart 4).
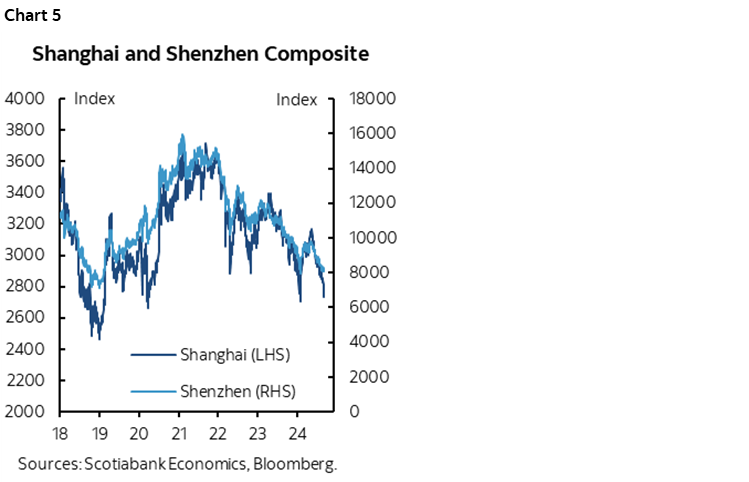
Equity prices are in a tailspin. The Shanghai composite that is skewed more toward SOEs is down by 26% since the late 2021 peak. The Shenzhen composite is down by over 40%. Chart 5.
The yuan exchange rate to the USD has slightly appreciated since late July and has been managed through fixings to largely move sideways this year. There won’t be much help offered to prices from exchange rate movements to date.
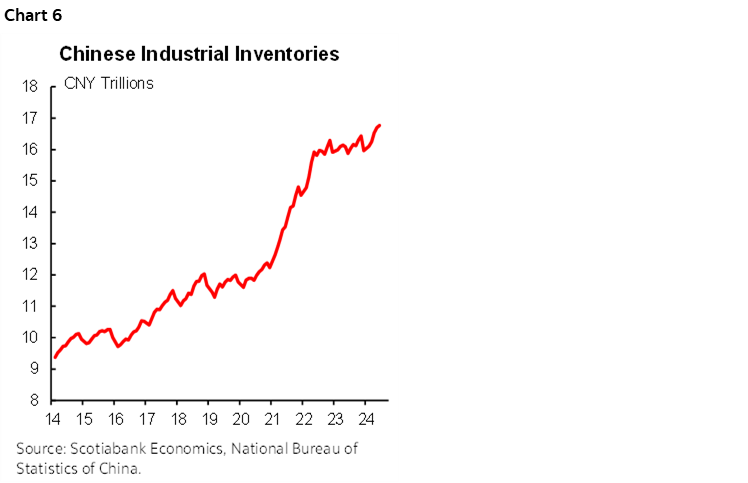
Inventories remain high in China’s economy as it over-produces partly given its global ambitions, partly because over-producing provides some short-term support to the economy absent greater policy easing that I’ll come back to, and partly through overt mismanagement (chart 6). Higher inventories make for a tougher pricing environment.
Could all of this change in future? Perhaps. With the Fed embarking upon an easing path, the PBOC may have relatively less worry about easing to address the fact that it is blowing its 3% inflation target that it rarely hits anyway. That’s because the currency may be less vulnerable to Chinese policy easing if the Fed is also easing which lessens related financial stability concerns.
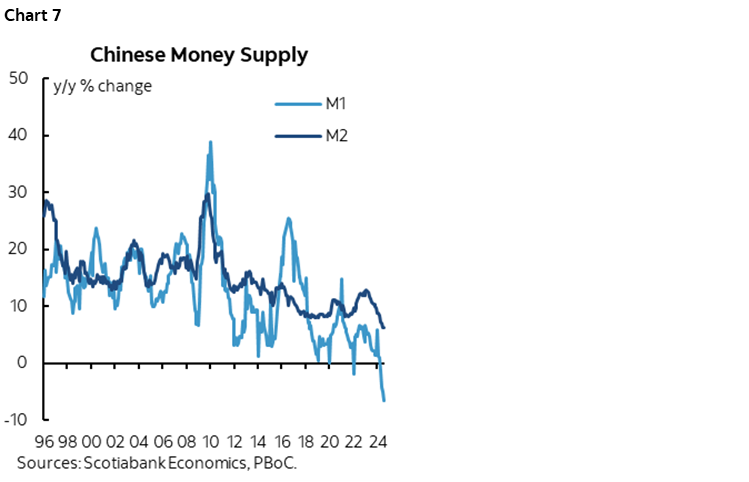
On that note, China has enormous untapped room for applying stimulus but it needs to match more action to recent rhetoric. It is among the rare number of major global central banks that have not embraced quantitative easing if needed. It has ample room to lower its key policy rates amidst confusion surrounding another shift in its preferred policy rates, and to inject liquidity. M1 money supply is falling by 6.6% y/y for the biggest contraction in decades, while M2 is growing by only 6.3% y/y for its slowest rate in decades (chart 7). There remains room to reduce required reserve ratios and free up bank capital.
Of course, much of the world is pushing back with protectionist measures against China’s over producing and global ambitions. If Trump gets elected and imposes a big tariff risk then China faces bigger problems yet, but so will the US and everyone else.
LIGHT N.A. CALENDAR
The N.A. calendar is very light. Mexican CPI for August was flat in m/m erms and landed at 5% y/y, close to expectations because Mexico releases CPI on a bi-weekly basis. Core CPI landed on the screws at 4% y/y.
The NY Fed’s 1-year inflation expectations measure for August arrives at 11amET. At about 3%, it has been moving sideways this year after decelerating from a peak of 6.8% in mid-2022.
DISCLAIMER
This report has been prepared by Scotiabank Economics as a resource for the clients of Scotiabank. Opinions, estimates and projections contained herein are our own as of the date hereof and are subject to change without notice. The information and opinions contained herein have been compiled or arrived at from sources believed reliable but no representation or warranty, express or implied, is made as to their accuracy or completeness. Neither Scotiabank nor any of its officers, directors, partners, employees or affiliates accepts any liability whatsoever for any direct or consequential loss arising from any use of this report or its contents.
These reports are provided to you for informational purposes only. This report is not, and is not constructed as, an offer to sell or solicitation of any offer to buy any financial instrument, nor shall this report be construed as an opinion as to whether you should enter into any swap or trading strategy involving a swap or any other transaction. The information contained in this report is not intended to be, and does not constitute, a recommendation of a swap or trading strategy involving a swap within the meaning of U.S. Commodity Futures Trading Commission Regulation 23.434 and Appendix A thereto. This material is not intended to be individually tailored to your needs or characteristics and should not be viewed as a “call to action” or suggestion that you enter into a swap or trading strategy involving a swap or any other transaction. Scotiabank may engage in transactions in a manner inconsistent with the views discussed this report and may have positions, or be in the process of acquiring or disposing of positions, referred to in this report.
Scotiabank, its affiliates and any of their respective officers, directors and employees may from time to time take positions in currencies, act as managers, co-managers or underwriters of a public offering or act as principals or agents, deal in, own or act as market makers or advisors, brokers or commercial and/or investment bankers in relation to securities or related derivatives. As a result of these actions, Scotiabank may receive remuneration. All Scotiabank products and services are subject to the terms of applicable agreements and local regulations. Officers, directors and employees of Scotiabank and its affiliates may serve as directors of corporations.
Any securities discussed in this report may not be suitable for all investors. Scotiabank recommends that investors independently evaluate any issuer and security discussed in this report, and consult with any advisors they deem necessary prior to making any investment.
This report and all information, opinions and conclusions contained in it are protected by copyright. This information may not be reproduced without the prior express written consent of Scotiabank.
™ Trademark of The Bank of Nova Scotia. Used under license, where applicable.
Scotiabank, together with “Global Banking and Markets”, is a marketing name for the global corporate and investment banking and capital markets businesses of The Bank of Nova Scotia and certain of its affiliates in the countries where they operate, including; Scotiabank Europe plc; Scotiabank (Ireland) Designated Activity Company; Scotiabank Inverlat S.A., Institución de Banca Múltiple, Grupo Financiero Scotiabank Inverlat, Scotia Inverlat Casa de Bolsa, S.A. de C.V., Grupo Financiero Scotiabank Inverlat, Scotia Inverlat Derivados S.A. de C.V. – all members of the Scotiabank group and authorized users of the Scotiabank mark. The Bank of Nova Scotia is incorporated in Canada with limited liability and is authorised and regulated by the Office of the Superintendent of Financial Institutions Canada. The Bank of Nova Scotia is authorized by the UK Prudential Regulation Authority and is subject to regulation by the UK Financial Conduct Authority and limited regulation by the UK Prudential Regulation Authority. Details about the extent of The Bank of Nova Scotia's regulation by the UK Prudential Regulation Authority are available from us on request. Scotiabank Europe plc is authorized by the UK Prudential Regulation Authority and regulated by the UK Financial Conduct Authority and the UK Prudential Regulation Authority.
Scotiabank Inverlat, S.A., Scotia Inverlat Casa de Bolsa, S.A. de C.V, Grupo Financiero Scotiabank Inverlat, and Scotia Inverlat Derivados, S.A. de C.V., are each authorized and regulated by the Mexican financial authorities.
Not all products and services are offered in all jurisdictions. Services described are available in jurisdictions where permitted by law.