- Colombia: July Imports and GDP proxy growth surpass pre-pandemic, defy attenuating base effects
COLOMBIA: JULY IMPORTS AND GDP PROXY GROWTH SURPASS PRE-PANDEMIC, DEFY ATTENUATING BASE EFFECTS
I. July’s imports grew 31.7% y/y; current account deficit now forecasted at 5.2% of GDP in 2021
July’s imports data, released by DANE on Friday, September, came in at USD 4.80 bn (CIF terms), expanding 31.7% y/y (chart 1) amidst attenuating base effects that boosted the previous month’s 69.8% y/y growth. Compared with July 2019, imports increased by 5.2%, showing that economic recovery is pushing up demand of raw materials and capital goods, in addition to the higher international prices affecting dollar-term imports. July imports remained close to their highest levels since the pandemic began (chart 1, again) and, consistent with the previous month, they evidence strong investment-related imports, boding well for medium-term FDI.
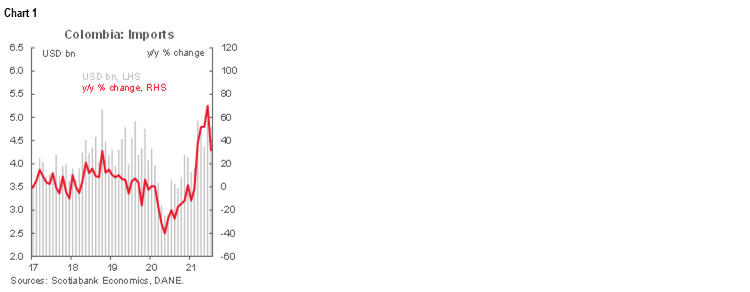
In view of the recent results and the balance of payment dynamics in Q2, we are revising our forecast for the current account deficit from -4.0% of GDP to -5.2 of GDP in 2021, which will still have enough financing through fiscal indebtedness but with a better contribution from FDI in the H2-2021.
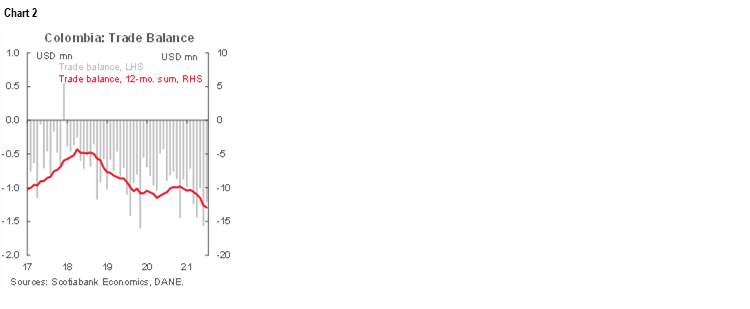
Manufacturing imports grew by 32.5% y/y (+9.6% vs July-2019) accounted for the strongest positive contribution to annual imports growth, while agriculture-related imports increased by 22.9% y/y and mining-related imports grew by 2.3% y/y. As a result, the monthly trade deficit widened to USD 1.21 bn (FOB), and now is now 1.3 times the deficit of July-2020 (chart 2), although similar to July-2019 deficit (USD 1.10 bn). Colombia’s YTD trade deficit stood at USD 8.17 bn for January–July.
From the perspective of imports by use, the three major segments showed positive signals compared with July 2020 (chart 3).
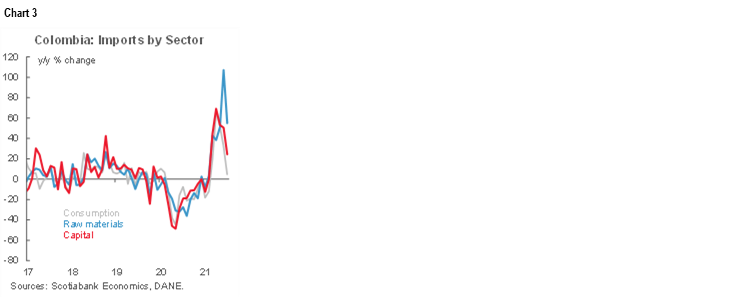
- Consumption-goods imports increased by +4.8% y/y and stood at USD 1.04 bn, owing mainly to higher durable-goods imports (+45% y/y), especially in vehicles with an expansion of 77.2% and jewelry (+49.9% y/y); meanwhile, non-durable goods imports fell by 12.5% y/y, mainly clothing (-74.2%y/y). Consumption-related imports continued getting closer to pre-pandemic monthly averages (2019: USD 1.05 bn and 2020 YTD: USD 965 mn).
- Raw-materials imports grew by 55.0% y/y, due to larger purchases of foreign goods for the industrial sector (+64.0% y/y), especially those related with chemical products (+59.6%y/y). Raw materials imports, in dollar terms, are close to their historical high, and it would reflect the effect of higher prices as well as the ongoing economic recovery.
- Capital-goods imports were up by 24.4% y/y (USD 1.43 bn), led by higher purchases of investment-related goods in the industry (7.2% y/y) and transport equipment (+74.4% y/y). That said, capital-goods imports reached the pre-pandemic averages (2019: USD 1.37 bn and YTD-2020: USD 1.30 mn). This strong rebound let us to affirm our expectation of better FDI in coming months that would help finance the higher current account deficit.
Overall, July’s imports remained strong as evidence of the economic recovery but were also impacted by higher international prices. However, the trade balance deficit deterioration is moderating. We expect Colombia’s external deficit over the coming months to stabilize.
II. Economic activity expanded 14.3% y/y in July, surpassing pre-pandemic levels
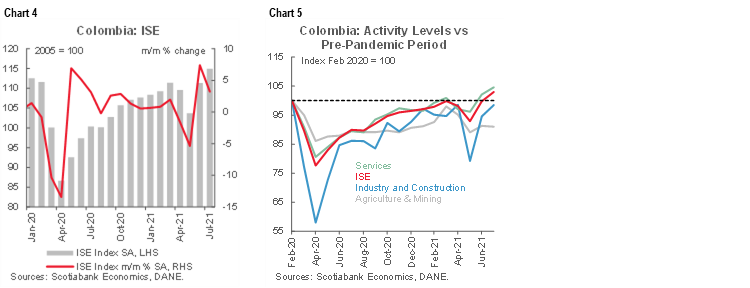
On Friday, September 17, Colombia’s Statistical Agency (DANE) released July’s Economic Activity Indicator (ISE, the main GDP proxy). Compared with the same month in 2020, July’s activity expanded by 14.3% y/y, landing above the market consensus of 13.1% y/y according to Bloomberg; and close to the previous month’s 14.5% y/y, defying any diminishing base effects.
On a seasonally adjusted basis, Colombia’s economic activity increased by 3.2% m/m (chart 4), achieving the best monthly expansion since August 2020 and overall surpassing pre-pandemic levels. However, the balance is unequal across sectors (chart 5).
Economic recovery is different across the three main activity groups (chart 6). A closer look is detailed below:
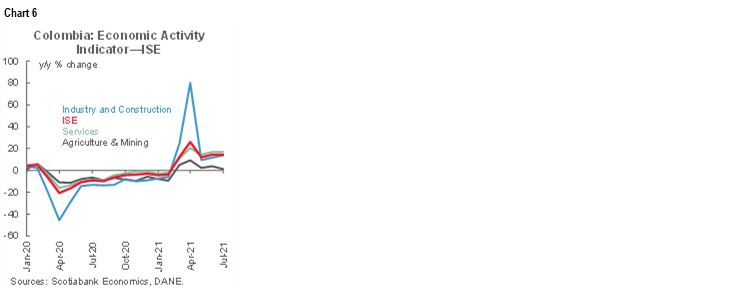
- Primary activities (13% of the economy) grew by 1.3% y/y but fell by -0.3% m/m seasonally adjusted in July. This means that the sector closed the month operating at a similar level to that observed in January 2021 (chart 5 again), showing moderation in the agricultural activity as some effects from the nationwide strike are still impacting some sub-sectors such as coffee, chicken, and eggs production. On the mining side, oil and coal production continued lagging the recovery and are well below pre-pandemic levels.
- Secondary sectors (19% of the economy) were up by 13.8% y/y, and increased by 4.1% m/m sa, posting another strong monthly gain. As shown in the Wednesday release, manufacturing production is rebounding amid better activity in oil refining due to better mobility, but also in sectors associated with the reopening (such as beverages, among others). Construction activities, meanwhile, remained weak as civil works haven’t normalized. That said, the group of secondary activities closed the month operating at the best level since the pandemic began, but below 1.5% compared to pre-pandemic levels (Feb 2020) (chart 5 again).
- Services-related activities (68% of the economy) were up by 16.8% y/y and expanded by 2.4% m/m. Commerce, transport, and hotel sectors are showing better performance as the country is again operating under broad normality in services sectors. That said, services-related activities are now operating above pre-pandemic levels (+4.6% y/y), with the positive contribution of non-traditional activities such as online gambling, and now we are seeing the recovery of traditional activities such as theatres, soccer games, massive events, among others, which skew to the positive side our vision in this sector.
Overall, economic activity results beat expectations again and now are above the pre-pandemic benchmark (February 2020). As COVID-19 contagions remain low and regional leaders are allowing new activities to continue increasing their capacity, we expect the economy will continue showing a positive performance. As we reported last week, we revised to the upside our GDP growth forecast for 2021 to 8.2%, affirming our expectation of a gradual normalizing process in the monetary policy rate beginning September 2021 with a 25 bps hike.
—Sergio Olarte & Jackeline Piraján
DISCLAIMER
This report has been prepared by Scotiabank Economics as a resource for the clients of Scotiabank. Opinions, estimates and projections contained herein are our own as of the date hereof and are subject to change without notice. The information and opinions contained herein have been compiled or arrived at from sources believed reliable but no representation or warranty, express or implied, is made as to their accuracy or completeness. Neither Scotiabank nor any of its officers, directors, partners, employees or affiliates accepts any liability whatsoever for any direct or consequential loss arising from any use of this report or its contents.
These reports are provided to you for informational purposes only. This report is not, and is not constructed as, an offer to sell or solicitation of any offer to buy any financial instrument, nor shall this report be construed as an opinion as to whether you should enter into any swap or trading strategy involving a swap or any other transaction. The information contained in this report is not intended to be, and does not constitute, a recommendation of a swap or trading strategy involving a swap within the meaning of U.S. Commodity Futures Trading Commission Regulation 23.434 and Appendix A thereto. This material is not intended to be individually tailored to your needs or characteristics and should not be viewed as a “call to action” or suggestion that you enter into a swap or trading strategy involving a swap or any other transaction. Scotiabank may engage in transactions in a manner inconsistent with the views discussed this report and may have positions, or be in the process of acquiring or disposing of positions, referred to in this report.
Scotiabank, its affiliates and any of their respective officers, directors and employees may from time to time take positions in currencies, act as managers, co-managers or underwriters of a public offering or act as principals or agents, deal in, own or act as market makers or advisors, brokers or commercial and/or investment bankers in relation to securities or related derivatives. As a result of these actions, Scotiabank may receive remuneration. All Scotiabank products and services are subject to the terms of applicable agreements and local regulations. Officers, directors and employees of Scotiabank and its affiliates may serve as directors of corporations.
Any securities discussed in this report may not be suitable for all investors. Scotiabank recommends that investors independently evaluate any issuer and security discussed in this report, and consult with any advisors they deem necessary prior to making any investment.
This report and all information, opinions and conclusions contained in it are protected by copyright. This information may not be reproduced without the prior express written consent of Scotiabank.
™ Trademark of The Bank of Nova Scotia. Used under license, where applicable.
Scotiabank, together with “Global Banking and Markets”, is a marketing name for the global corporate and investment banking and capital markets businesses of The Bank of Nova Scotia and certain of its affiliates in the countries where they operate, including; Scotiabank Europe plc; Scotiabank (Ireland) Designated Activity Company; Scotiabank Inverlat S.A., Institución de Banca Múltiple, Grupo Financiero Scotiabank Inverlat, Scotia Inverlat Casa de Bolsa, S.A. de C.V., Grupo Financiero Scotiabank Inverlat, Scotia Inverlat Derivados S.A. de C.V. – all members of the Scotiabank group and authorized users of the Scotiabank mark. The Bank of Nova Scotia is incorporated in Canada with limited liability and is authorised and regulated by the Office of the Superintendent of Financial Institutions Canada. The Bank of Nova Scotia is authorized by the UK Prudential Regulation Authority and is subject to regulation by the UK Financial Conduct Authority and limited regulation by the UK Prudential Regulation Authority. Details about the extent of The Bank of Nova Scotia's regulation by the UK Prudential Regulation Authority are available from us on request. Scotiabank Europe plc is authorized by the UK Prudential Regulation Authority and regulated by the UK Financial Conduct Authority and the UK Prudential Regulation Authority.
Scotiabank Inverlat, S.A., Scotia Inverlat Casa de Bolsa, S.A. de C.V, Grupo Financiero Scotiabank Inverlat, and Scotia Inverlat Derivados, S.A. de C.V., are each authorized and regulated by the Mexican financial authorities.
Not all products and services are offered in all jurisdictions. Services described are available in jurisdictions where permitted by law.