- Chile: We project June CPI of -0.1% m/m (3.7% y/y); May GDP of 1.1% y/y (-0.4% m/m) disappoints significantly
- Mexico: GFI accelerated with significant increases in all its components, although in the monthly comparison machinery and equipment fell; Private consumption: imported goods have had double-digit increases for sixteen months
CHILE: WE PROJECT JUNE CPI OF -0.1% M/M (3.7% Y/Y)
- Partial reversal of pre-CyberDay price increases would lead to falls in six of the thirteen divisions
We project June CPI of -0.1% m/m (3.7% y/y), in line with market expectations reflected in forwards, surveys and in the base scenario of the June IPoM. Likewise, we project that the CPI ex-volatiles would increase 0.1% m/m (3.5% y/y), mainly due to the contribution of its services component (+0.2% m/m), since goods would fall 0.1% m/m. Meanwhile, we project falls in volatile items (-0.5% m/m), which would occur mainly due to the decline we project for gasoline and some foods.
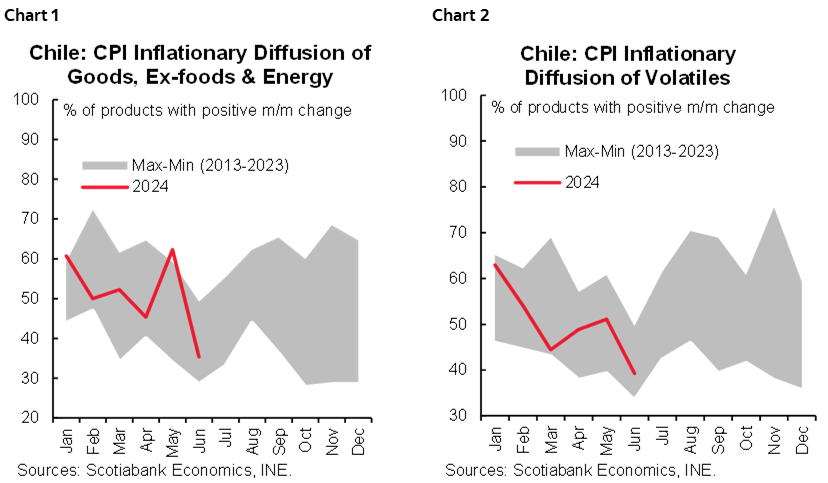
As we noted in our previous report, we project reversals of the increases observed in May that occurred before CyberDay. This would have been observed mainly in the clothing and footwear division but also in electronic items, for which we project relevant price drops in June. With this, the inflationary diffusion for June would be the lowest so far this year (charts 1 and 2).
MAY GDP OF 1.1% Y/Y (-0.4% M/M) DISAPPOINTS SIGNIFICANTLY
- GDP expansion above 2.7% is going uphill this year
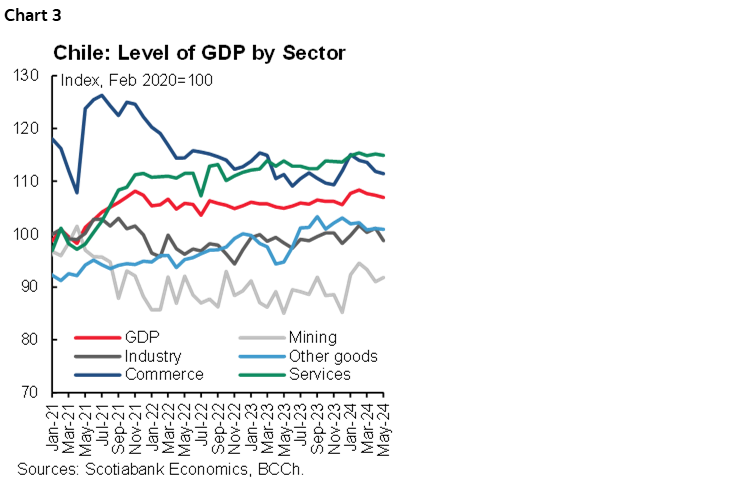
On Monday, July 1st, the Central Bank (BCCh) published GDP for May, which grew 1.1% y/y, well below the consensus (Survey of Economists: 2.8%; Bloomberg: 2.5%), with a seasonally adjusted contraction of 0.4% m/m that goes far beyond the lower growth in one less business day. We can associate this important slowdown with the negative impact of the rains that affected industry and services, which could have been more relevant than initially thought, but given the general drop in economic activity (chart 3), we are probably facing a slowdown that would have been something stronger due to these factors. We detected an amplified calendar effect.
The zero-dynamism observed in the last three months makes it difficult to achieve growth above 2.7% y/y in 2024. After registering high dynamism at the beginning of the year, economic activity has reversed much of the carry-over effect obtained (chart 4). Behind this is the reversal that commerce has shown and the lack of dynamism in sectors such as industry and services. If there is no recovery in investment in the remainder of the year, it will be difficult to achieve GDP growth rates higher than those estimated by the BCCh and the Ministry of Finance for the year (2.7%).
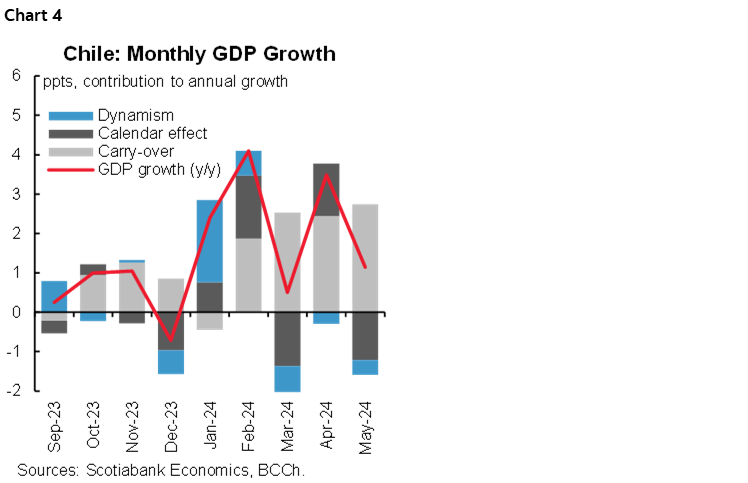
The magnitude of the negative calendar effect is very striking. During May, there was one less business day than the previous year, but the low level of the seasonal factor reflects a calendar effect comparable to March, where we had three fewer business days. The composition of days of the month was very relevant, but it is still difficult to explain the magnitude of such an effect on the month. In any case, for the second half of the year we expect a reversal of the negative calendar effects seen in these months, given that between July and December we will have two additional business days compared to last year.
June GDP would also be affected by the rains. Consequently, it is difficult for now to expect a relevant seasonally adjusted recovery at the end of the second quarter. Preliminarily, we estimate GDP growth between 1% and 2% y/y in June, where the positive climate effects in the electricity generation sector would be compensated by the lower economic activity in personal services and difficulty in the production of goods, especially in the manufacturing and construction industries.
—Aníbal Alarcón
MEXICO: GFI ACCELERATED WITH SIGNIFICANT INCREASES IN ALL ITS COMPONENTS, ALTHOUGH IN THE MONTHLY COMPARISON MACHINERY AND EQUIPMENT FELL
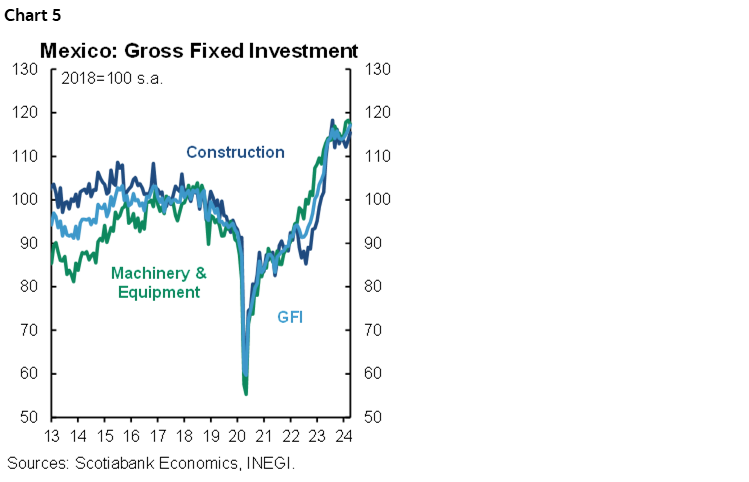
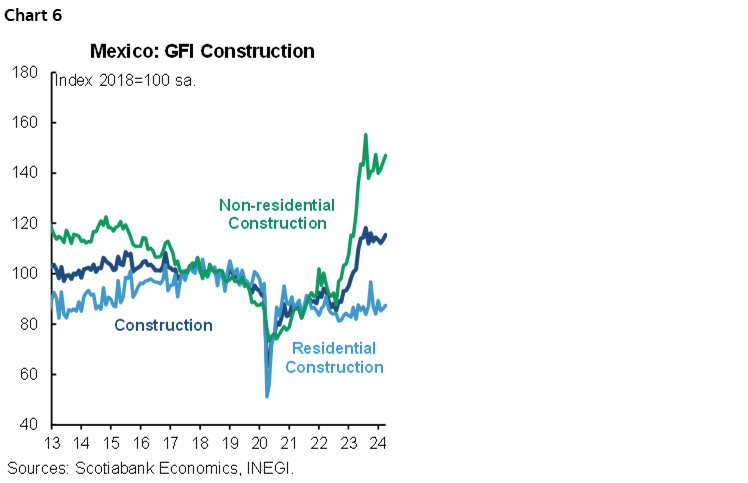
During April, Gross Fixed Investment accelerated to 18.1% from 3.0%. Machinery and equipment increased 19.5% (-3.4% previously), the domestic subcomponent rose 9.0% (-1.5% previously), and the imported 26.7% (-4.7% previously). Construction rose 16.8% (9.4% previously), non-residential construction has maintained almost the same level at 21.5% y/y (21.6% previously) and residential 11.2% (-4.2% previously). In the seasonally adjusted monthly comparison, the GFI showed an increase of 0.9% (0.8% previously), machinery and equipment fell -0.8% (0.4% previously), and construction rose 1.6% (1.3% previously), see chart 5.
By type of investment, private construction increased 18.0%, while public construction increased by 10.5%. Private machinery and equipment increased 20.1%, and the public subcomponent 4.9% (chart 6). The annual data surprises the market due to the strength of construction, although in the monthly comparison the slowdown in machinery and equipment is observed, related to the fact that the renewal of equipment is about to be completed.
PRIVATE CONSUMPTION: IMPORTED GOODS HAVE HAD DOUBLE-DIGIT INCREASES FOR SIXTEEN MONTHS
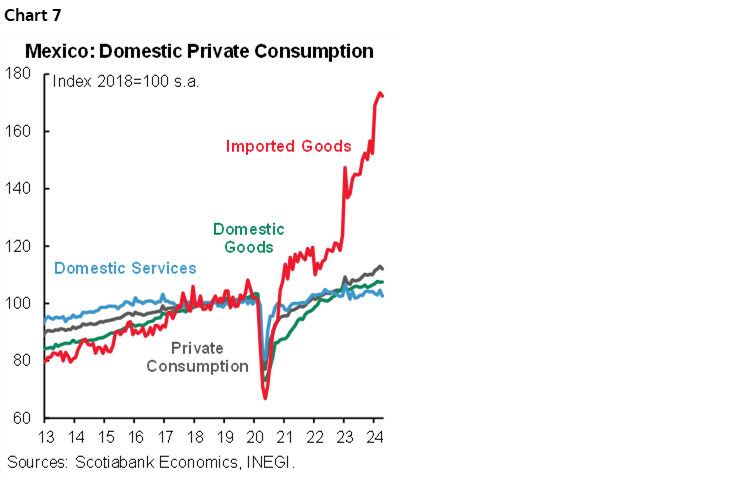
In April, private consumption increased its pace in real annual terms, from 8.0% to 1.6%. National goods showed a rebound of 4.2% (-2.3% previously), national services increased 2.1% (2.2% previously), while imported goods accelerated 39.1% (11.3% previously), with an increase in durable goods of 58.0% (14.5% previously). In its seasonally adjusted monthly comparison, private consumption fell -0.9% (0.9% previously), derived from the fact that consumption of national goods fell -2.0% (chart 7). We expect that the next data will continue to be led by the consumption of imported goods, derived from the slowdown in the local economy as we saw in the IGAE index (monthly GDP), mainly in manufactures that fell -1.5% m/m in April, also the consumption will be affected by the monetary policy rate.
—Brian Pérez
DISCLAIMER
This report has been prepared by Scotiabank Economics as a resource for the clients of Scotiabank. Opinions, estimates and projections contained herein are our own as of the date hereof and are subject to change without notice. The information and opinions contained herein have been compiled or arrived at from sources believed reliable but no representation or warranty, express or implied, is made as to their accuracy or completeness. Neither Scotiabank nor any of its officers, directors, partners, employees or affiliates accepts any liability whatsoever for any direct or consequential loss arising from any use of this report or its contents.
These reports are provided to you for informational purposes only. This report is not, and is not constructed as, an offer to sell or solicitation of any offer to buy any financial instrument, nor shall this report be construed as an opinion as to whether you should enter into any swap or trading strategy involving a swap or any other transaction. The information contained in this report is not intended to be, and does not constitute, a recommendation of a swap or trading strategy involving a swap within the meaning of U.S. Commodity Futures Trading Commission Regulation 23.434 and Appendix A thereto. This material is not intended to be individually tailored to your needs or characteristics and should not be viewed as a “call to action” or suggestion that you enter into a swap or trading strategy involving a swap or any other transaction. Scotiabank may engage in transactions in a manner inconsistent with the views discussed this report and may have positions, or be in the process of acquiring or disposing of positions, referred to in this report.
Scotiabank, its affiliates and any of their respective officers, directors and employees may from time to time take positions in currencies, act as managers, co-managers or underwriters of a public offering or act as principals or agents, deal in, own or act as market makers or advisors, brokers or commercial and/or investment bankers in relation to securities or related derivatives. As a result of these actions, Scotiabank may receive remuneration. All Scotiabank products and services are subject to the terms of applicable agreements and local regulations. Officers, directors and employees of Scotiabank and its affiliates may serve as directors of corporations.
Any securities discussed in this report may not be suitable for all investors. Scotiabank recommends that investors independently evaluate any issuer and security discussed in this report, and consult with any advisors they deem necessary prior to making any investment.
This report and all information, opinions and conclusions contained in it are protected by copyright. This information may not be reproduced without the prior express written consent of Scotiabank.
™ Trademark of The Bank of Nova Scotia. Used under license, where applicable.
Scotiabank, together with “Global Banking and Markets”, is a marketing name for the global corporate and investment banking and capital markets businesses of The Bank of Nova Scotia and certain of its affiliates in the countries where they operate, including; Scotiabank Europe plc; Scotiabank (Ireland) Designated Activity Company; Scotiabank Inverlat S.A., Institución de Banca Múltiple, Grupo Financiero Scotiabank Inverlat, Scotia Inverlat Casa de Bolsa, S.A. de C.V., Grupo Financiero Scotiabank Inverlat, Scotia Inverlat Derivados S.A. de C.V. – all members of the Scotiabank group and authorized users of the Scotiabank mark. The Bank of Nova Scotia is incorporated in Canada with limited liability and is authorised and regulated by the Office of the Superintendent of Financial Institutions Canada. The Bank of Nova Scotia is authorized by the UK Prudential Regulation Authority and is subject to regulation by the UK Financial Conduct Authority and limited regulation by the UK Prudential Regulation Authority. Details about the extent of The Bank of Nova Scotia's regulation by the UK Prudential Regulation Authority are available from us on request. Scotiabank Europe plc is authorized by the UK Prudential Regulation Authority and regulated by the UK Financial Conduct Authority and the UK Prudential Regulation Authority.
Scotiabank Inverlat, S.A., Scotia Inverlat Casa de Bolsa, S.A. de C.V, Grupo Financiero Scotiabank Inverlat, and Scotia Inverlat Derivados, S.A. de C.V., are each authorized and regulated by the Mexican financial authorities.
Not all products and services are offered in all jurisdictions. Services described are available in jurisdictions where permitted by law.

