- Chile: March CPI of 0.5% m/m keeps the Central Bank’s baseline scenario in place (4.9% y/y)
- Colombia: Annual headline decreased in March, interrupting four months of stagnation
CHILE: MARCH CPI OF 0.5% M/M KEEPS THE CENTRAL BANK’S BASELINE SCENARIO IN PLACE (4.9% Y/Y)
- Services (Healthcare and Housing) show high inflationary diffusion, prompting greater caution in Monetary Policy
The March CPI reading of 0.5% m/m was in line with our projection, that of the Central Bank, and the consensus, leaving annual inflation at 4.9%. The CPI "excluding volatiles" print of 0.4% m/m was the lowest since 2013, explained by goods and services. However, particularly in services, high diffusion is observed, suggesting that many services are experiencing price adjustments (charts 1 and 2). The evolution of services is worrying, as they could be responding to indexation effects (in healthcare), demand pressures (in housing), and/or second-round effects linked to electricity prices. It is still early to determine the importance of these factors in services, but a degree of caution is undoubtedly warranted in monetary policy despite the low underlying inflation rate.
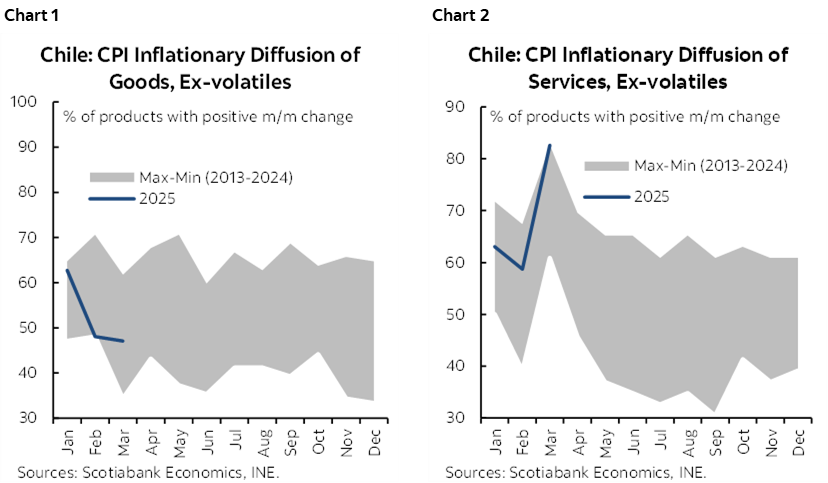
Some products are providing relief, especially shelter, which experienced a modest 0.1% m/m increase, the lowest since 2013, despite headline inflation close to 5%. This could reflect less pressure for additional price adjustments in that sector. The same is true for Household Services, which did not experience price increases this month (0% m/m), something never seen before in March (at least since 2013).
The high inflationary diffusion of services, especially in health and housing, is worrisome given that goods significantly offset inflation in services (charts 1 and 2 again). However, the recent depreciation of the Chilean peso could put pressure on tradable goods, adding to the persistent price adjustment in services. This combination would likely be the most challenging for inflationary convergence. For example, it should not be surprising if the peso’s depreciation leads to increases in the tourism package item, which declined in March, but could reverse and result in a significant increase in the April CPI.
In terms of monetary policy, this outcome does not come as a surprise to the Central Bank’s baseline scenario. Regarding the partial materialization of external risks linked to the trade war, the effects run in opposite directions. On the one hand, they reduce medium-term external demand, widening the output gap and suggesting greater monetary stimulus, but they also place upward pressure on external and domestic prices. While it is still early to assess the quantitative effects on the path that monetary policy should follow, the Central Bank’s and our scenario, which contemplates two cuts in the monetary policy rate during the second half of the year, remains in effect, especially given that short-term figures have met expectations.
—Waldo Riveras
COLOMBIA: ANNUAL HEADLINE DECREASED IN MARCH, INTERRUPTING FOUR MONTHS OF STAGNATION
Colombia’s monthly CPI inflation rate was 0.52% m/m in March, according to data published by DANE on Monday, April 7th, 2025. The result was below analysts’ expectations in the BanRep survey of 0.58% m/m and Scotiabank Colpatria’s expectation of 0.54% m/m. In March, 11 of the 12 main groups had positive monthly variations, with 63% of inflation explained by food, rent, and utilities.
In March, we continued to observe indexation effects, especially in rental rates. The lodging and utilities category (+0.56% m/m) contributed the most to inflation, with 17 bps, mainly explained by increases in rents and increases in energy fees. Food (+0.86% m/m) was the second largest contributor to inflation, with 16 bps, perhaps due to the start of the winter season. Services, such as urban transportation, restaurants, and hotels, showed further effects of indexation to the minimum wage.
Annual inflation fell from 5.28% to 5.09%, breaking the upward trend of the previous four months (chart 3) and recording its lowest figure since October 2021. Core inflation showed a favourable performance; inflation excluding food fell from 5.44% to 5.19%, while inflation excluding food and regulated prices fell from 4.92% to 4.88%. Meanwhile, goods inflation accelerated from 0.67% to 0.93% annually, due to an increase in vehicle and furniture prices, while services inflation fell from 6.57% to 6.38%.
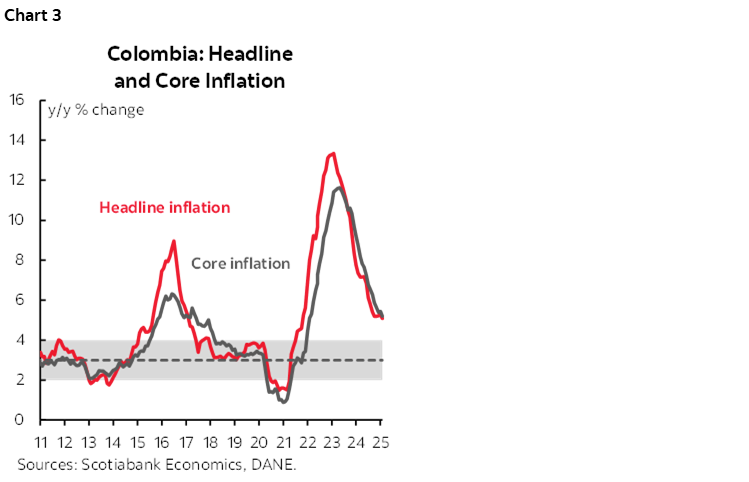
The March results can be viewed positively for the next BanRep meeting; however, reaching the 3% target could take time. In our scenario, annual inflation would remain above 4% throughout the year, showing a slight rebound in the final quarter to close at around 4.9%. Under this scenario, we believe BanRep could consider cutting the interest rate by 25 basis points at its April 30th meeting, considering that the real rate would remain contractionary. However, the international outlook and its effects on local assets will play a key role in the decision, given that a significant FX depreciation could translate into inflationary pressures. We expect the board to continue acting cautiously, resuming gradual cuts that will bring the interest rate to 8% for the year’s end.
Other highlights:
- The lodging and utilities sector was the largest contributor to inflation (chart 4). The lodging and utilities sector registered a monthly increase of 0.56%, contributing 17 bps to the total increase. Rental rates registered a change of 0.57% m/m, lower than the 0.82% increase recorded in February and lower than the 0.74% increase recorded the previous year, which could indicate that the strongest effect of indexation had already materialized. Utilities, meanwhile, registered a change of 0.38% m/m, with electricity (0.6% m/m) and garbage collection (3.84% m/m) increasing the most, while gas registered a negative change of -1.42% m/m, offsetting the result.

- Food was the second largest contributor to inflation, with a change of 0.86% m/m (chart 5). Food contributed 16 bps to total inflation, with increases in vegetables (6.36% m/m), potatoes (+4.35% m/m), fresh fruit (+2.94% m/m), and meat (0.90% m/m), all of which are important items in the family basket. However, variations in other foods were moderate and, in some cases, negative, such as tomatoes (-3.77% m/m), which had seen double-digit increases in the previous four months. We believe this result may be related to the winter season and the anticipation of the Easter holiday season.

- Services experienced indexation effects: however, they showed a decline in annual terms, while goods-maintained inflation below the target. Services such as restaurants and hotels showed a positive variation of 0.57% m/m, contributing 6 bps to the total and reflecting the effects of indexation to the minimum wage, especially for meals outside the home. Transportation also contributed 6 bps to the total, with a monthly variation of 0.41%, reflecting increases in urban transportation and parking. In the transportation sector, vehicle prices also increased (+0.57% m/m), slightly pushing up inflation in goods. Health care saw the largest variation (+1.01% m/m) but with a contribution of only 2 bps. This reflected a combination of services, with increased medical consultations and exams, and an increase in pharmaceutical products.
—Jackeline Piraján & Daniela Silva
DISCLAIMER
This report has been prepared by Scotiabank Economics as a resource for the clients of Scotiabank. Opinions, estimates and projections contained herein are our own as of the date hereof and are subject to change without notice. The information and opinions contained herein have been compiled or arrived at from sources believed reliable but no representation or warranty, express or implied, is made as to their accuracy or completeness. Neither Scotiabank nor any of its officers, directors, partners, employees or affiliates accepts any liability whatsoever for any direct or consequential loss arising from any use of this report or its contents.
These reports are provided to you for informational purposes only. This report is not, and is not constructed as, an offer to sell or solicitation of any offer to buy any financial instrument, nor shall this report be construed as an opinion as to whether you should enter into any swap or trading strategy involving a swap or any other transaction. The information contained in this report is not intended to be, and does not constitute, a recommendation of a swap or trading strategy involving a swap within the meaning of U.S. Commodity Futures Trading Commission Regulation 23.434 and Appendix A thereto. This material is not intended to be individually tailored to your needs or characteristics and should not be viewed as a “call to action” or suggestion that you enter into a swap or trading strategy involving a swap or any other transaction. Scotiabank may engage in transactions in a manner inconsistent with the views discussed this report and may have positions, or be in the process of acquiring or disposing of positions, referred to in this report.
Scotiabank, its affiliates and any of their respective officers, directors and employees may from time to time take positions in currencies, act as managers, co-managers or underwriters of a public offering or act as principals or agents, deal in, own or act as market makers or advisors, brokers or commercial and/or investment bankers in relation to securities or related derivatives. As a result of these actions, Scotiabank may receive remuneration. All Scotiabank products and services are subject to the terms of applicable agreements and local regulations. Officers, directors and employees of Scotiabank and its affiliates may serve as directors of corporations.
Any securities discussed in this report may not be suitable for all investors. Scotiabank recommends that investors independently evaluate any issuer and security discussed in this report, and consult with any advisors they deem necessary prior to making any investment.
This report and all information, opinions and conclusions contained in it are protected by copyright. This information may not be reproduced without the prior express written consent of Scotiabank.
™ Trademark of The Bank of Nova Scotia. Used under license, where applicable.
Scotiabank, together with “Global Banking and Markets”, is a marketing name for the global corporate and investment banking and capital markets businesses of The Bank of Nova Scotia and certain of its affiliates in the countries where they operate, including; Scotiabank Europe plc; Scotiabank (Ireland) Designated Activity Company; Scotiabank Inverlat S.A., Institución de Banca Múltiple, Grupo Financiero Scotiabank Inverlat, Scotia Inverlat Casa de Bolsa, S.A. de C.V., Grupo Financiero Scotiabank Inverlat, Scotia Inverlat Derivados S.A. de C.V. – all members of the Scotiabank group and authorized users of the Scotiabank mark. The Bank of Nova Scotia is incorporated in Canada with limited liability and is authorised and regulated by the Office of the Superintendent of Financial Institutions Canada. The Bank of Nova Scotia is authorized by the UK Prudential Regulation Authority and is subject to regulation by the UK Financial Conduct Authority and limited regulation by the UK Prudential Regulation Authority. Details about the extent of The Bank of Nova Scotia's regulation by the UK Prudential Regulation Authority are available from us on request. Scotiabank Europe plc is authorized by the UK Prudential Regulation Authority and regulated by the UK Financial Conduct Authority and the UK Prudential Regulation Authority.
Scotiabank Inverlat, S.A., Scotia Inverlat Casa de Bolsa, S.A. de C.V, Grupo Financiero Scotiabank Inverlat, and Scotia Inverlat Derivados, S.A. de C.V., are each authorized and regulated by the Mexican financial authorities.
Not all products and services are offered in all jurisdictions. Services described are available in jurisdictions where permitted by law.