CANADA: STRONG END TO Q1-2025 AS TARIFFS WEIGH ON THE OUTLOOK
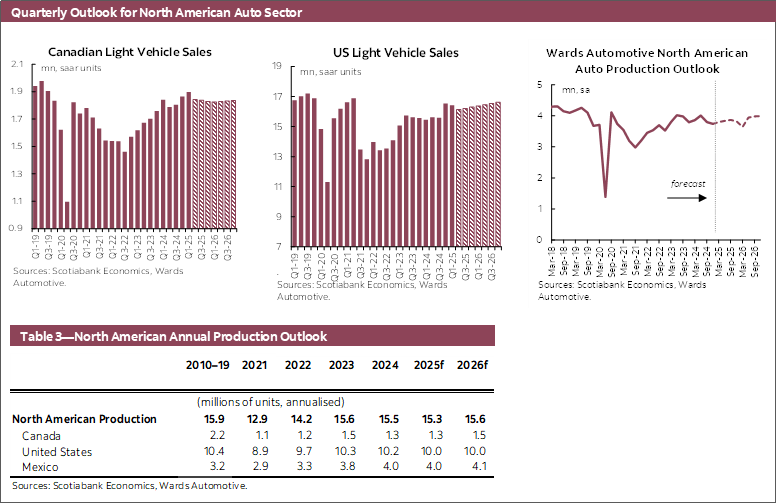
Canadian auto sales in March increased by 7.3% month-over-month to 1.98 mn units at a seasonally adjusted annualized rate (SAAR) according to Wards Automotive (chart 1). The rebound in auto sales, combined with upward revisions of more than 9% to data for both January and February respectively, resulted in a 1.8% quarter-over-quarter gain for Q1. And in non-seasonally adjusted terms, first quarter sales were up 4.3% year-over-year and up 3.6% above the same quarter in 2019.

Auto sales’ strong start to the year could be driven at least partially by sales pulled forward from consumers that may have been looking to front-run tariff disruptions, notably from the surge in March. The US had been threatening to impose tariffs on some imported Canadian goods since late-January, with some tariffs coming into effect in early March, and it was announced on March 26th that additional tariffs would directly target the automotive sector.
The US has imposed tariffs of 25% on automobile imports with plans, with preferential tariff treatment to CUSMA-compliant vehicles, and plans to expand these tariffs to automotive parts once there is a process in place to apply the tariff exclusively to their value of non-US content. Meanwhile, Canada has retaliated with 25% tariffs on non-CUSMA compliant vehicles being imported to Canada from the US, and 25% tariffs on non-Canadian and non-Mexican content of CUSMA compliant vehicles imported from the US. While Canada’s retaliation announced on April 3rd does not include automotive parts and the US has put a 90-day pause on retaliatory tariffs for most countries, the overall costs from measures to date and uncertainty around the (de-)escalating trade conflict are likely to having lasting effects with some businesses having announced changes to hiring and production plans while waiting further clarity.
Our outlook for Canadian light vehicle sales of 1.84 mn in 2025 and 1.83 in 2026 likely faces downside risk, notably in the outer years to reflect developments and pressures that the escalating tariffs will have on the automotive sector and overall economic activity.
UNITED STATES: MARCH SALES SURGE TO FRONT-RUN TARIFFS?
US auto sales in March increased by 11% month-over-month in seasonally adjusted terms to 17.8 mn units at an annualized rate (chart 2). Light vehicle sales in Q1 averaged 16.4 mn (SAAR) units, down by -0.8% quarter-over-quarter (SA). Non-seasonally adjusted automotive sales through the first quarter were up 4.8% year-over-year for the strongest start to a year through the first three months since 2019, with sales -1.9% below relative to the same quarter.

Strong auto sales in March could be consumers front-running tariff effects that would add to the cost of imported vehicles. The US imposed tariffs of 10% on nearly all trading partners, with varying retaliatory tariffs that have been put on hold for 90-days. These tariffs include a few exemptions depending on various factors, such as goods that are compliant with the Canada-US-Mexico Agreement (CUSMA). While trade policy continues to be quite volatile, tariffs imposed since the beginning of the year add significant costs to various intermediate and final goods imported to the US, including automotives. Analysis by Anderson Economic Group estimates that the tariffs announced on April 2nd could add $2,500 to $5,000 to the cost of imported vehicles subject to the lowest tariff rates, and up to $20,000 for some imported models.
Our outlook for US auto sales of 16.2 mn in 2025 and 16.5 mn in 2026 will likely be revised down as tariffs imposed by the US on imports, including automotives from Canada and Mexico that are not CUSMA-compliant and other trading partners, will weigh on demand and the economic outlook.
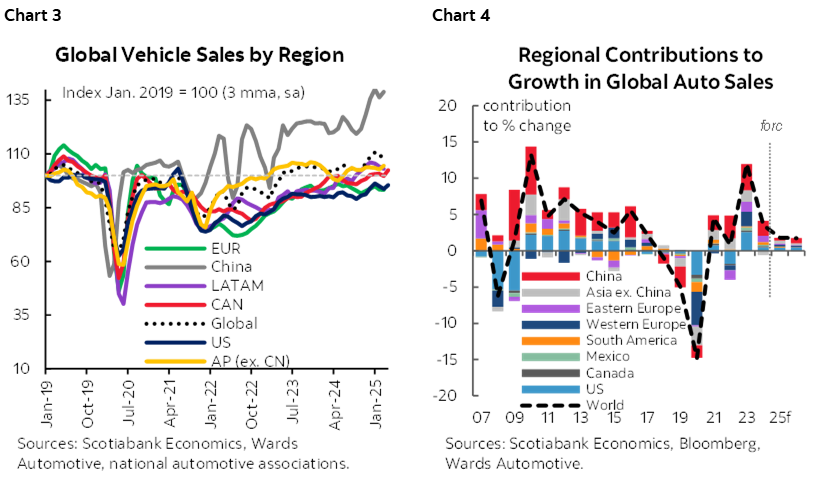
GLOBAL AUTO SALES: REBOUND IN FEBRUARY IS MOSTLY BROAD BASED AT THE REGIONAL LEVEL
Global auto sales increased 8.6% m/m (SA) in February (chart 3). The rebound in sales was broad based at the regional level and marks the first seasonally adjusted increase since November 2024. Auto sales in western Europe increased for a third consecutive month, +1.1% m/m (SA) in February, however the pace of growth has eased since early the tail end of Q3-2024. Auto sales in eastern Europe fell for the third time in the past four months, -6.6% m/m (SA) in February, continuing a trend of softening sales in the region. Asia Pacific auto sales rebounded by 15.6% m/m (SA) in February primarily owing to the 22.3% m/m (SA) increase in China, the largest market in the region, after declining the two prior months. In Latin America, auto sales were mostly unchanged in February (-0.2% m/m, SA), as the sales rate recovers from the recent low in December. Our outlook for global vehicle sales is 1.8% in 2025 and 1.7% in 2026, with the risks potentially weighing more to the downside as tariffs pose headwinds to global growth (chart 4).
DISCLAIMER
This report has been prepared by Scotiabank Economics as a resource for the clients of Scotiabank. Opinions, estimates and projections contained herein are our own as of the date hereof and are subject to change without notice. The information and opinions contained herein have been compiled or arrived at from sources believed reliable but no representation or warranty, express or implied, is made as to their accuracy or completeness. Neither Scotiabank nor any of its officers, directors, partners, employees or affiliates accepts any liability whatsoever for any direct or consequential loss arising from any use of this report or its contents.
These reports are provided to you for informational purposes only. This report is not, and is not constructed as, an offer to sell or solicitation of any offer to buy any financial instrument, nor shall this report be construed as an opinion as to whether you should enter into any swap or trading strategy involving a swap or any other transaction. The information contained in this report is not intended to be, and does not constitute, a recommendation of a swap or trading strategy involving a swap within the meaning of U.S. Commodity Futures Trading Commission Regulation 23.434 and Appendix A thereto. This material is not intended to be individually tailored to your needs or characteristics and should not be viewed as a “call to action” or suggestion that you enter into a swap or trading strategy involving a swap or any other transaction. Scotiabank may engage in transactions in a manner inconsistent with the views discussed this report and may have positions, or be in the process of acquiring or disposing of positions, referred to in this report.
Scotiabank, its affiliates and any of their respective officers, directors and employees may from time to time take positions in currencies, act as managers, co-managers or underwriters of a public offering or act as principals or agents, deal in, own or act as market makers or advisors, brokers or commercial and/or investment bankers in relation to securities or related derivatives. As a result of these actions, Scotiabank may receive remuneration. All Scotiabank products and services are subject to the terms of applicable agreements and local regulations. Officers, directors and employees of Scotiabank and its affiliates may serve as directors of corporations.
Any securities discussed in this report may not be suitable for all investors. Scotiabank recommends that investors independently evaluate any issuer and security discussed in this report, and consult with any advisors they deem necessary prior to making any investment.
This report and all information, opinions and conclusions contained in it are protected by copyright. This information may not be reproduced without the prior express written consent of Scotiabank.
™ Trademark of The Bank of Nova Scotia. Used under license, where applicable.
Scotiabank, together with “Global Banking and Markets”, is a marketing name for the global corporate and investment banking and capital markets businesses of The Bank of Nova Scotia and certain of its affiliates in the countries where they operate, including; Scotiabank Europe plc; Scotiabank (Ireland) Designated Activity Company; Scotiabank Inverlat S.A., Institución de Banca Múltiple, Grupo Financiero Scotiabank Inverlat, Scotia Inverlat Casa de Bolsa, S.A. de C.V., Grupo Financiero Scotiabank Inverlat, Scotia Inverlat Derivados S.A. de C.V. – all members of the Scotiabank group and authorized users of the Scotiabank mark. The Bank of Nova Scotia is incorporated in Canada with limited liability and is authorised and regulated by the Office of the Superintendent of Financial Institutions Canada. The Bank of Nova Scotia is authorized by the UK Prudential Regulation Authority and is subject to regulation by the UK Financial Conduct Authority and limited regulation by the UK Prudential Regulation Authority. Details about the extent of The Bank of Nova Scotia's regulation by the UK Prudential Regulation Authority are available from us on request. Scotiabank Europe plc is authorized by the UK Prudential Regulation Authority and regulated by the UK Financial Conduct Authority and the UK Prudential Regulation Authority.
Scotiabank Inverlat, S.A., Scotia Inverlat Casa de Bolsa, S.A. de C.V, Grupo Financiero Scotiabank Inverlat, and Scotia Inverlat Derivados, S.A. de C.V., are each authorized and regulated by the Mexican financial authorities.
Not all products and services are offered in all jurisdictions. Services described are available in jurisdictions where permitted by law.