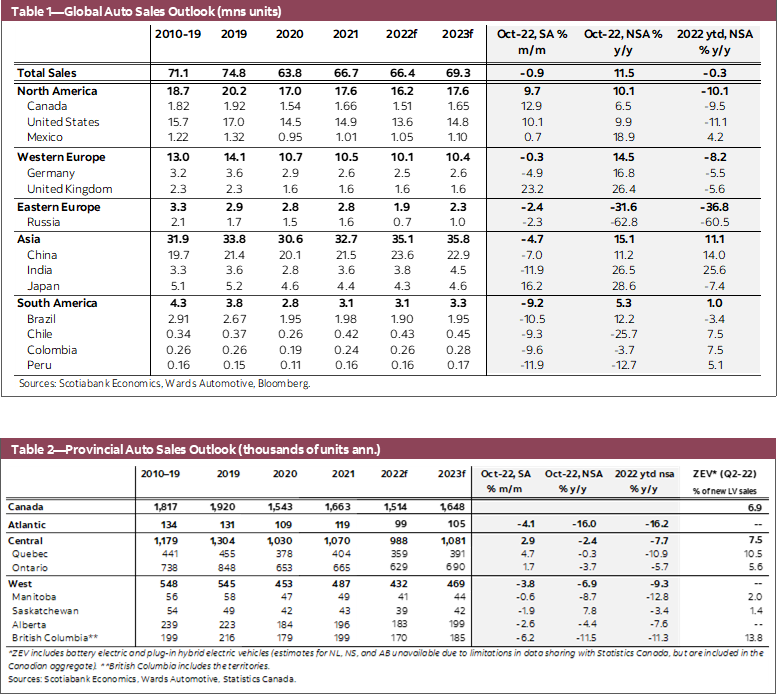
- Global auto sales saw a dip of -0.9% m/m (sa) in October for a third consecutive month of decline. Sales activity slid to 68.5 mn saar units, well below the 75 mn saar units that were trending in 2019, bringing the year-to-date shortfall to -1.4% relative to 2021.
- Major declines are concentrated in Asia Pacific (-4.7% m/m sa) and South America (-9.2% m/m sa). Sales in China pulled back for a third consecutive month in October by -7.0% m/m (sa). The contraction in South America is more broad-based, led by Brazil (-10.5% m/m sa) and Peru (-11.9% m/m sa).
- North American sales climbed by 9.7% m/m (sa) in October on the back of improving inventory but still face a long recovery ahead.
- Replenishing inventory will take time, especially with production expansion highly constrained by elevated input costs and labour shortages. While fundamentals remain strong in North America, especially in Canada, headwinds to auto demand in the near term are mounting. Exposure to rising interest rates, broader cost of living pressures along with still elevated vehicle pricing in a tight supply environment are likely weighing on sentiment at least to major purchases. With considerable uncertainty in the quarters ahead—including mild recession risk—despite solid balance sheets consumers may opt to sit on the sidelines until economic conditions normalise.
- We are holding the line on our outlook for Canadian and US auto sales, with our 2022 forecast for Canada and the US standing at 1.5 mn and 13.6 mn units, respectively, largely constrained by supply. We expect the sales rate in Canada and the US to reach 1.65 mn and 14.8 mn units in 2023, respectively—still below fundamental demand—but with considerable bandwidths around those figures in light of economic (and policy) uncertainty, layered on top of weak sight lines on auto production plans.
- We maintain our expectation of flat global sales for 2022 relative to 2021, and slightly higher sales in 2023 by around 4.5%.
HEADLINE WEAKNESS MASKS REGIONAL DIFFERENCES
Global auto sales posted another month-over-month decline in October following a similar pull-back in September, still driven by a deceleration in Asia Pacific (-4.7% m/m sa) and South America (-9.2% m/m sa). Auto sales in China contracted again by -7.0% m/m (sa) in October as the impact of the lockdown lingers—making it the third consecutive month of decline—but still up 11.2% from a year ago. Experiencing a series of slowdowns in the second half of the year, South American auto sales plunged across the board in October, with Brazil and Peru leading the drop. Sales recovery in Western Europe also lost some momentum and recorded a -0.3% m/m (sa) dip in October. Sales in the largest market—Germany—have influenced headline numbers with its pullback of -4.9% m/m, though sales were down in many others (i.e., France -7.7% m/m, Spain -5.3% m/m). A strong rebound in the UK (23.2% m/m sa) offsets the majority of the losses in the region.

In contrast to the weak headline number, North American sales saw clear signs of a turnaround in October with sales jumping by 9.7%, building up on the 1.7% gain last month. The US drove the improving trend with sales up 10.1% m/m (sa). Canada saw its first gain after five months of consecutive declines, posting a double-digit growth of 12.9% m/m (sa).
The strong sales in October on the back of improving inventory will likely persist—in line with our expectations of a gradual recovery for the rest of the year. We are holding the line on our outlook for Canadian and US auto sales, with our 2022 forecast for Canada and the US standing at 1.5 mn and 13.6 mn units, respectively. We see auto sales continuing to improve by over 8% in both countries in 2023 as supply improves, but with considerable bandwidths around those figures in light of economic (and policy) uncertainty, layered on top of weak sight lines on auto production plans.
A SLOW REBALANCING OF SUPPLY AND DEMAND IN NORTH AMERICA
After limited inventory took a toll on sales for most of the year, North American markets saw some early signs of easing supply constraints in recent months. Inventory levels in the US stood at 51% higher than in the same month a year ago in October, and light vehicle days’ supply reached the highest level since May 2021 (chart 2). While inventory levels showed some improvement, they remained low by historical standards, especially for some Asian non-luxury brands and Japanese and European luxury brands, according to Cox Automotive. The rate at which inventory is picking up is not fast enough to bring the inventory-to-sales ratio back to a normal level, which has been bottoming yet without any material sign of a turnaround. Proprietary data in Canada also suggests a slight uptick in inventory relative to a year ago, but the market conditions remain just as tight as in the US, if not more.

Demand-side factors have been holding up strong amid rising interest rates, especially in Canada. Canadian GDP surprised to the upside in Q3 and posted a strong q/q growth rate of 2.9%, pushing the anticipated slowdowns into later this year/early next year. The household saving rate edged up to 5.7% as of Q3, well above the pre-pandemic average of 3–4%. Primary household income rose 8.7% since the same quarter last year on the back of strong wage growth. Soaring immigration could give vehicle demand a decent boost moving forward—Canada is on track to beat the upper range of its 2022 immigration target of 445k people, which would be close to a 10% increase from last year’s record-level immigration. The Government of Canada also increased its immigration targets for the coming two years (chart 3), planning to welcome 447k new permanent residents in 2023 and 451k in 2024.

Car ownership is getting more expensive, but wages are catching up. In the US, new vehicle inflation stood at 8.4% y/y in October, down from the peak of over 13% in April (chart 4). JD Power reported the average monthly finance payment at $712 in November, up 7.2% from a year ago. As the pace of new vehicle price growth slows, wage growth remains steady at an annualized rate of 4% m/m as of October, bringing average hourly earnings 4.7% higher than in the same month a year prior. In Canada, new vehicle inflation stood at a similar level as in the US at 7.9% y/y, but wages have been growing faster at an annualized 8.8% m/m as of October, 5.5% higher than a year ago (chart 5).

But the headwinds to auto demand in the near term are mounting. In our latest forecasts, we see central banks to raise policy rates further by early next year given the persistent inflationary pressures. A mild recession is likely in the first half of 2023 along with some uptick in unemployment, but with policy actions in the coming weeks to play a determining role in whether this baseline holds. As interest rates still have rooms to rise in both Canada and the US, broader cost of living pressures along with uncertainties on the financial markets will likely weigh on sentiment and curtail purchases down the road—but so far these impacts have been masked by limited inventory.
Replenishing inventory in an environment of still-solid demand will take time despite the improving trend in production. As of October, North American production is still down -13.5% year-to-date compared to 2019. Wards Automotive forecasts light vehicle production to end the year 11% (1.4 mn units) higher relative to 2021 and pick up by another 7% (1.1 mn units) in 2023. Domestically produced vehicles account for roughly 78% of North American sales, and with an average sales loss of close to 3 mn per year since the pandemic, the forecasted recovery won’t be able to catch up to sales without an expansion in capacity. Currently, as production is highly constrained by elevated input costs and tight labour markets, we don’t expect to see the markets fully restoring the supply-demand balance in 2023.

DISCLAIMER
This report has been prepared by Scotiabank Economics as a resource for the clients of Scotiabank. Opinions, estimates and projections contained herein are our own as of the date hereof and are subject to change without notice. The information and opinions contained herein have been compiled or arrived at from sources believed reliable but no representation or warranty, express or implied, is made as to their accuracy or completeness. Neither Scotiabank nor any of its officers, directors, partners, employees or affiliates accepts any liability whatsoever for any direct or consequential loss arising from any use of this report or its contents.
These reports are provided to you for informational purposes only. This report is not, and is not constructed as, an offer to sell or solicitation of any offer to buy any financial instrument, nor shall this report be construed as an opinion as to whether you should enter into any swap or trading strategy involving a swap or any other transaction. The information contained in this report is not intended to be, and does not constitute, a recommendation of a swap or trading strategy involving a swap within the meaning of U.S. Commodity Futures Trading Commission Regulation 23.434 and Appendix A thereto. This material is not intended to be individually tailored to your needs or characteristics and should not be viewed as a “call to action” or suggestion that you enter into a swap or trading strategy involving a swap or any other transaction. Scotiabank may engage in transactions in a manner inconsistent with the views discussed this report and may have positions, or be in the process of acquiring or disposing of positions, referred to in this report.
Scotiabank, its affiliates and any of their respective officers, directors and employees may from time to time take positions in currencies, act as managers, co-managers or underwriters of a public offering or act as principals or agents, deal in, own or act as market makers or advisors, brokers or commercial and/or investment bankers in relation to securities or related derivatives. As a result of these actions, Scotiabank may receive remuneration. All Scotiabank products and services are subject to the terms of applicable agreements and local regulations. Officers, directors and employees of Scotiabank and its affiliates may serve as directors of corporations.
Any securities discussed in this report may not be suitable for all investors. Scotiabank recommends that investors independently evaluate any issuer and security discussed in this report, and consult with any advisors they deem necessary prior to making any investment.
This report and all information, opinions and conclusions contained in it are protected by copyright. This information may not be reproduced without the prior express written consent of Scotiabank.
™ Trademark of The Bank of Nova Scotia. Used under license, where applicable.
Scotiabank, together with “Global Banking and Markets”, is a marketing name for the global corporate and investment banking and capital markets businesses of The Bank of Nova Scotia and certain of its affiliates in the countries where they operate, including; Scotiabank Europe plc; Scotiabank (Ireland) Designated Activity Company; Scotiabank Inverlat S.A., Institución de Banca Múltiple, Grupo Financiero Scotiabank Inverlat, Scotia Inverlat Casa de Bolsa, S.A. de C.V., Grupo Financiero Scotiabank Inverlat, Scotia Inverlat Derivados S.A. de C.V. – all members of the Scotiabank group and authorized users of the Scotiabank mark. The Bank of Nova Scotia is incorporated in Canada with limited liability and is authorised and regulated by the Office of the Superintendent of Financial Institutions Canada. The Bank of Nova Scotia is authorized by the UK Prudential Regulation Authority and is subject to regulation by the UK Financial Conduct Authority and limited regulation by the UK Prudential Regulation Authority. Details about the extent of The Bank of Nova Scotia's regulation by the UK Prudential Regulation Authority are available from us on request. Scotiabank Europe plc is authorized by the UK Prudential Regulation Authority and regulated by the UK Financial Conduct Authority and the UK Prudential Regulation Authority.
Scotiabank Inverlat, S.A., Scotia Inverlat Casa de Bolsa, S.A. de C.V, Grupo Financiero Scotiabank Inverlat, and Scotia Inverlat Derivados, S.A. de C.V., are each authorized and regulated by the Mexican financial authorities.
Not all products and services are offered in all jurisdictions. Services described are available in jurisdictions where permitted by law.