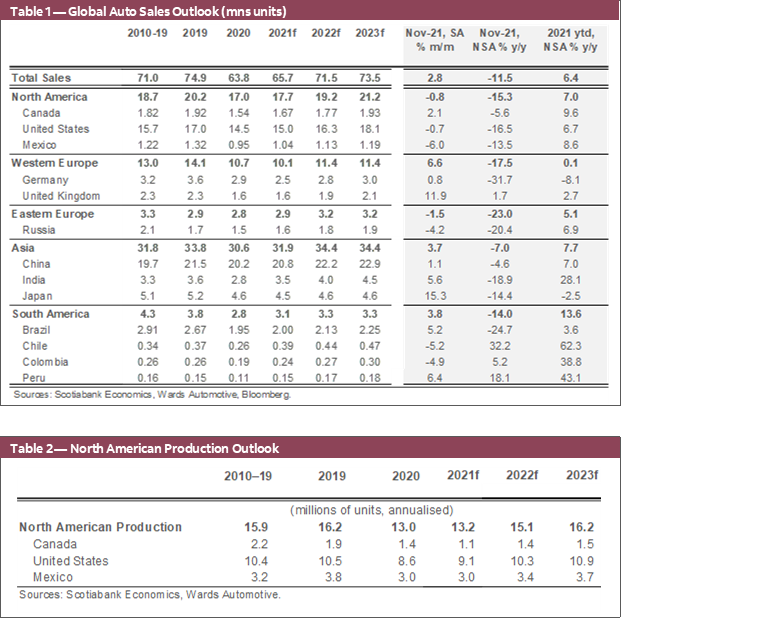
- Global auto sales posted another +2.8% m/m (sa) improvement in November for a second consecutive gain after nearly half a year of monthly declines. The year-over-year shortfall narrowed to -11.5% but, increasingly, base effects will minimize the perceived impact of the semiconductor chip shortage that surfaced nearly a year ago.
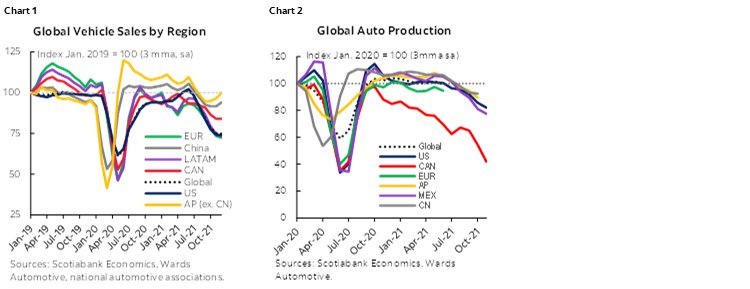
- Global auto sales sit at a seriously depressed 67 mn saar units (ytd)—well-below the 75 mn sales watermark of 2019—as no region has evaded the impacts of inventory shortages that have otherwise curtailed what should have been a robust year for global auto sales (chart 1).
- The regional picture was mixed, with largely flat sales (give or take a percentage) in most major markets such as the US (-0.7% m/m), Germany (+0.8% m/m), and China (+1.1% m/m), but with some important outliers that boosted the headline number (Japan, +15% m/m; UK, +12% m/m; France, +9% m/m, and Brazil, +5% m/m).
- The nascent recovery in global auto production underpins these gains in sales, but output is still well-below pre-pandemic levels (chart 2) and recent improvements are not yet translating into meaningfully higher inventory on dealers’ lots.
- Consequently, sentiment is likely curbing some sales activity as consumers defer purchases amidst still-escalating prices and limited selection. We do believe this is fueling pent-up demand for vehicle purchases down the road given strong household balance sheets and improving labour markets in countries like Canada and the US.
- While we had assumed auto production would accelerate through the first half of 2022, we now believe there is a serious risk that this will only happen towards the middle of the year owing to omicron outbreaks around the world and the potential for further supply chain disruptions (not to mention health impacts).
- This would dampen the global auto sales outlook with an expectation that limited supply and a high pricing environment would persist through 2022 and into 2023. Auto production capacity would be the limiting factor to how quickly the sector could capitalize on mounting pent-up demand as supply chain bottlenecks unwind.
- We expect global auto sales will finish the year with only a modest 3% improvement relative to last year, and have pencilled in 9% y/y and 6% y/y gains for 2022 and 2023, respectively. While we do not forecast out to 2024, it is reasonable to expect that this auto cycle could extend advances over this horizon despite policy tightening that is imminent in many major markets.
- There is considerable risk around this outlook including policy uncertainty. In the near term, this includes how governments around the world react to the latest outbreak. There is also potential for policy missteps that could lead to harder-than-anticipated exits with some erosion of the pent-up demand that could otherwise be expected.
GLOBAL AUTO SALES IN BRIEF
Global auto sales posted another positive gain in November for a second consecutive month of improvement following the latest setback in supply chain challenges. Purchases accelerated by another 2.8% m/m (sa) last month following a similar advance in October, (briefly) offering hope that bottlenecks related to the global semiconductor chip shortage (and in some cases other materials, labour, and shipping constraints) were beginning to durably unwind. Annualised sales still stood at a meagre 61 mn saar units in November, bringing year-to-date sales up only marginally to 67 mn saar units. This is well-below the 75 mn vehicles sold in 2019.
There was some regional differentiation across markets, but mostly reflective of monthly volatility around pandemic and inventory factors. North American auto sales were down by -0.8% m/m (sa) driven by the contraction in US sales (-0.7% m/m, sa). Wards Automotive data pointed to a 2% m/m (sa) gain for Canada (in contrast to an earlier-reported contraction of almost 8% m/m (sa) by Desrosiers Automotive Consultants Inc.). Western European auto sales saw a positive advance (7% m/m, sa) driven by improvements in the UK and France (12% m/m and 9% m/m, respectively), while largely flat sales in Germany (0.8% m/m, sa) directionally supported the regional trend. Asia Pacific posted a 4% m/m (sa) improvement as sales surged in Japan by 15% m/m (sa) and—to a lesser extent—in China (1% m/m). South American auto purchases were up by almost 4% m/m (sa), driven mostly by a 5% m/m (sa) gain in Brazil.
See Box 1 in the Annex for a more detailed view of global auto sales in November.
PRODUCTION POISED FOR ANOTHER SETBACK?
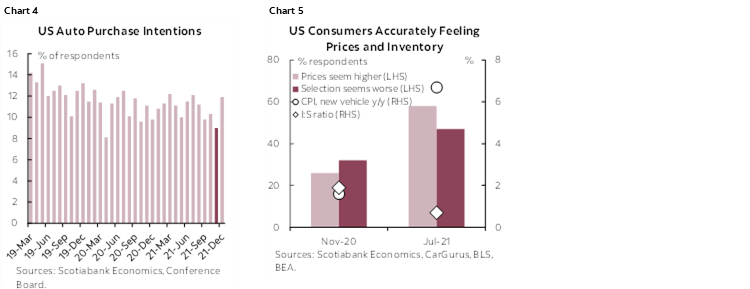
Leading data suggest global auto production continued to accelerate through November, but another setback is likely in the cards. North American auto production was up +7% m/m (sa) in November on the back of October’s sharp +10% m/m (sa) improvement as the sector began its slow recovery from summer supply disruptions owing to Delta variant outbreaks in South Asia (chart 3). Though November data is not yet available for other major auto producers, China and Japan likely saw gains as well.
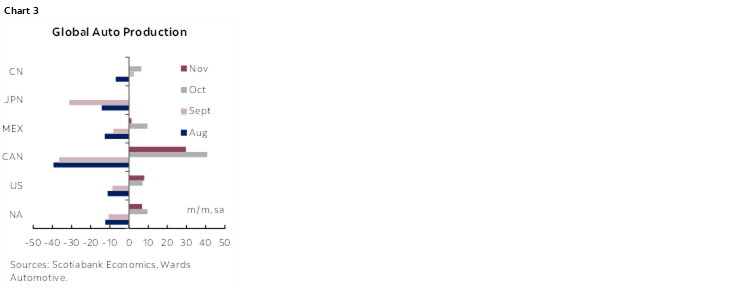
The nascent recovery could be short-lived. With outbreaks of omicron taking off around the world by mid-December, it is reasonable to expect further supply disruptions in what has been a bumpy path for auto production over the past year and a half. Recall, Delta-related impacts through supply chains saw North American auto output pull back by almost -10% q/q (sa) in the third quarter of 2021. The higher contagion of omicron could potentially lead to larger spillbacks through supply chains into the early winter months of 2022.
Other idiosyncratic factors could also impact regional auto production in the weeks ahead. This includes potentially more stringent lockdowns ahead of China’s Olympics, as well as delayed impacts from the late-November flooding in British Columbia given the oversized share of motor vehicles and parts moving through the Port of Vancouver.
PERCEPTION REFLECTS REALITY
Despite positive developments in auto production in November, the transmission to sales is not clear-cut just yet. Even if retail inventory metrics have improved modestly (in the US for example, the inventory-to-sales ratio nudged back up above one again in November), weaker sales provided some assist. While inventory picked up by almost 3% m/m (nsa), US auto sales slipped by -4% m/m, nsa (nsa used for comparability only here).
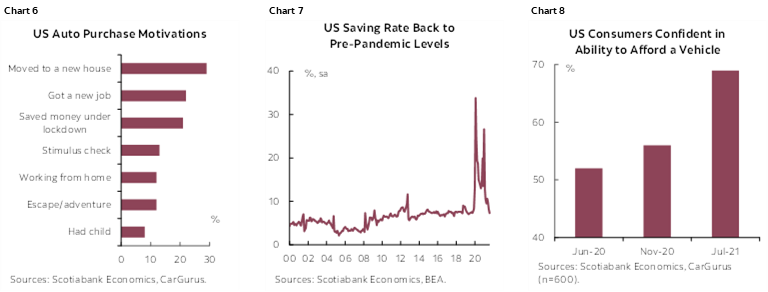
These improvements are likely not yet discernible to the consumer. Annualised inventory in the US still stood at a paltry 12.1 mn saar units in November. And prices have not let up: new vehicle price appreciation surged into double-digit territory in the US (11.1% y/y, 1.1% m/m), while used vehicle prices also continued to climb higher (31.4% y/y, 2.5% m/m) in November. The high pricing environment and limited inventory likely took a toll on consumer confidence in November with auto purchase intentions dipping sharply, according to The Conference Board (chart 4). The most recent CarGurus survey indicates that 31% of US shoppers have delayed their auto purchase due to the pricing environment with perceptions around price and selection deteriorating sharply since late 2020. The situation has only worsened since polling in July, but perceptions are not far from reality (chart 5).
This current softening in auto demand should rebound as inventory picks up (and prices stabilize). At a fundamental level, auto demand should be strong in markets such as the US and Canada where substantial policy supports have offset (if not overshot) the pandemic impacts on household balance sheets. Scotiabank Economics’ modeling, for example, finds housing wealth a strong driver of US auto sales. Soaring real estate asset values propelled net household wealth to another all-time high in the third quarter of 2021–and not incidentally—new home purchases are motivating auto purchase intentions (chart 6). The US household savings rate (i.e., on a flow basis) has dipped back down to pre-pandemic levels at the end of October, but wealth effects (i.e., stock effects) and trend improvements in labour markets should underpin (financial) confidence as inventory and prices normalise (charts 7 & 8).
NORMALISATION LIKELY DELAYED
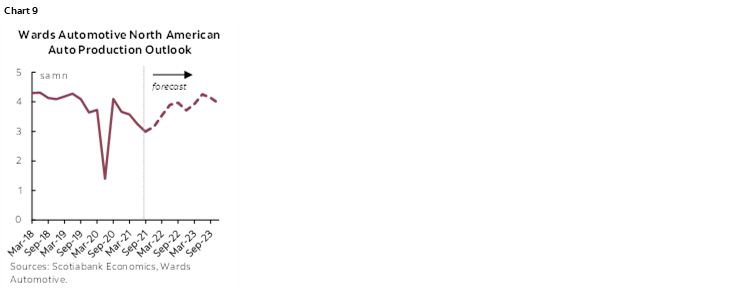
We have maintained that auto production capacity is a limiting factor to how quickly auto sales can capitalize on pent-up demand. Wards Automotive still has a 5% q/q (sa) rebound in North American auto production pencilled in for the first quarter of 2022, followed by double-digit gains in the middle quarters, that would see annual output at 15.1 mn vehicles before accounting for potential omicron impacts (chart 9). This would be substantially better than the estimated 12.9 mn vehicles that will likely be produced by the end of this year, but well-below the 16.2 mn vehicles assembled in 2019. This would put capacity utilization for the industry (in the US) at around 70% in 2022, not much below the 20-year average of 72%. Wards’ outlook for 2023 auto production is back to pre-pandemic levels of 16.2 mn vehicles with US capacity utilization running at a solid 75%.
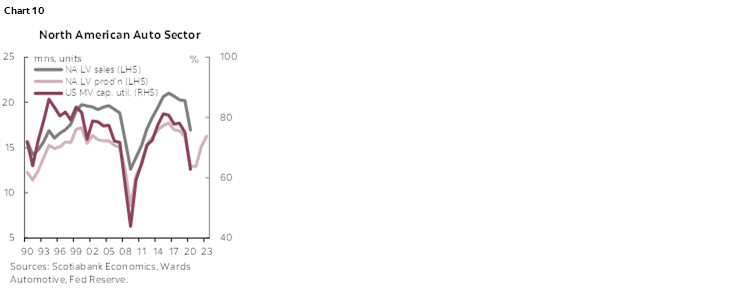
Even without pandemic risk ahead, the industry would be stretched to catch up to demand in 2022. The pent-up demand from 2021 is likely now closer to 2.5 mn (versus our earlier 2 mn estimate), while the production shortfall (relative to demand) in 2022 could add another 1 mn. We base this on North American auto production numbers, which are not one-for-one with respect to sales, but the share of domestically produced auto purchases has been relatively stable (around 78% of new vehicle purchases) over the past five years, while other regional auto production is facing similar constraints suggesting limited potential for displacement (chart 10). For these reasons, we continue to believe that pricing will remain elevated over this horizon for both new and used vehicles (given the former is the feeder for the latter with a lag).
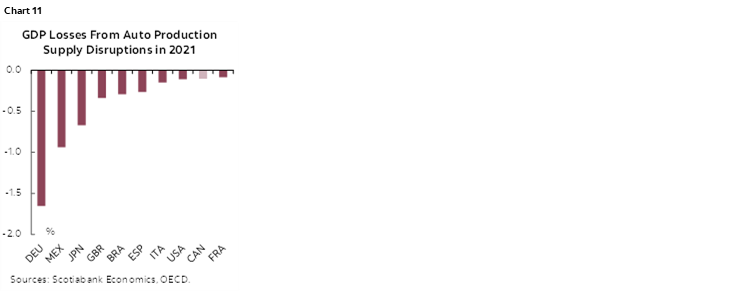
It is still too early to change baselines owing to omicron just yet, but downside risks have widened in the past few weeks. For illustrative purposes only, pushing the North American auto production recovery out by another quarter, along with a -10% q/q contraction in first quarter of 2022, would see auto output back around 13 mn again for 2022, layering on another 2 mn shortfall in regional production relative to demand in 2022. This would push the demand-supply shortfall above 5 mn vehicles accrued over the course of 2021 through 2023. And the longer this demand is unmet, the more tenuous it could become as the economic cycle matures. This is a risk not only for producers and retailers, but also economies where the auto sector is a larger share. This includes countries such as Germany, Mexico, and Japan which are likely banking on rebounds ahead given that the estimated impacts on 2021 are material (chart 11).
BOX 1: TRENDS IN REGIONAL AUTO SALES
Global auto sales posted another positive m/m gain for a second consecutive month in November at 2.8% (sa), with most regions showing signs of stabilizing. On an annualised basis, sales sat just shy of 61 mn units in November after trending closer to 72 mn vehicles over the first half of the year, and still 16.9% (y/y, nsa) lower relative to the same month last year. It is obvious that the slow recoupment of the global semiconductor chip production continues to weigh on the speed of global auto sales recovery.
Auto sales in Asia Pacific led the recovery and further recouped some sales loss from the sharp dip in August and September. Japanese auto sales have been at full steam and rose by a whopping 15.3% m/m (sa) in November, although still long way from reaching levels before the production disruptions (-14.4% y/y, nsa). Chinese auto sales—representing over 60% of the Asia Pacific light vehicle market, picked up 1.1% m/m sa in November, yet still 4.6% (y/y, nsa) lower compared to the same month last year. Indian auto sales recorded a 5.6% m/m growth (sa), after a notable growth of 19.1% in October.
The headline trends were also driven by sales in Western Europe, which finally showed signs of a widespread rebound in November after some major monthly declines since July. France and Italy experienced similar bounce-backs (8.7% m/m and 4.6% m/m, respectively), while Germany saw virtually no sign of recovery after the October slowdown (0.8% m/m sa in November, and -11% in October). UK auto sales posted another strong gain of 11.9% m/m (sa), compounding October’s 6.5% m/m (sa) improvement.
North American auto sales saw growth stagnate in November after some encouraging improvement in October. Still strained by limited inventory, US sales declined by -0.7% m/m (sa) at a very weak annualised sales rate of 12.9 mn vehicles. Very low inventories are curbing otherwise relatively strong demand-side factors as discussed here. There are mixed messages in monthly sales figures for Canada—Wards Automotive reported some slight m/m improvement of 2.1% (sa) in November following October’s -3.2% m/m (sa) contraction, whereas DesRosiers Automotive Consultants Inc. pointed to a -7.6% m/m (sa) decline, following October’s modest gain (1.3% m/m, sa).
Latin American sales ended the four-month streak of decline and were up slightly by 1.4% m/m (sa). The sales gains mostly came from the Brazilian market, which posted a 5% m/m (sa) gain in November. Argentina and Peru also saw sales picking up by 15.1% m/m (sa) and 6.4% m/m (sa), respectively. On the flip side, Mexican auto sales doubled down on its downtrend started in May, and continued to weigh on the headline growth with another -6% m/m (sa) decline in November. Overall, Latin American auto sales stood at -14.4% lower relative to the same month last year, and the year-to-date sales were still -19.1% lower than in 2019.
DISCLAIMER
This report has been prepared by Scotiabank Economics as a resource for the clients of Scotiabank. Opinions, estimates and projections contained herein are our own as of the date hereof and are subject to change without notice. The information and opinions contained herein have been compiled or arrived at from sources believed reliable but no representation or warranty, express or implied, is made as to their accuracy or completeness. Neither Scotiabank nor any of its officers, directors, partners, employees or affiliates accepts any liability whatsoever for any direct or consequential loss arising from any use of this report or its contents.
These reports are provided to you for informational purposes only. This report is not, and is not constructed as, an offer to sell or solicitation of any offer to buy any financial instrument, nor shall this report be construed as an opinion as to whether you should enter into any swap or trading strategy involving a swap or any other transaction. The information contained in this report is not intended to be, and does not constitute, a recommendation of a swap or trading strategy involving a swap within the meaning of U.S. Commodity Futures Trading Commission Regulation 23.434 and Appendix A thereto. This material is not intended to be individually tailored to your needs or characteristics and should not be viewed as a “call to action” or suggestion that you enter into a swap or trading strategy involving a swap or any other transaction. Scotiabank may engage in transactions in a manner inconsistent with the views discussed this report and may have positions, or be in the process of acquiring or disposing of positions, referred to in this report.
Scotiabank, its affiliates and any of their respective officers, directors and employees may from time to time take positions in currencies, act as managers, co-managers or underwriters of a public offering or act as principals or agents, deal in, own or act as market makers or advisors, brokers or commercial and/or investment bankers in relation to securities or related derivatives. As a result of these actions, Scotiabank may receive remuneration. All Scotiabank products and services are subject to the terms of applicable agreements and local regulations. Officers, directors and employees of Scotiabank and its affiliates may serve as directors of corporations.
Any securities discussed in this report may not be suitable for all investors. Scotiabank recommends that investors independently evaluate any issuer and security discussed in this report, and consult with any advisors they deem necessary prior to making any investment.
This report and all information, opinions and conclusions contained in it are protected by copyright. This information may not be reproduced without the prior express written consent of Scotiabank.
™ Trademark of The Bank of Nova Scotia. Used under license, where applicable.
Scotiabank, together with “Global Banking and Markets”, is a marketing name for the global corporate and investment banking and capital markets businesses of The Bank of Nova Scotia and certain of its affiliates in the countries where they operate, including; Scotiabank Europe plc; Scotiabank (Ireland) Designated Activity Company; Scotiabank Inverlat S.A., Institución de Banca Múltiple, Grupo Financiero Scotiabank Inverlat, Scotia Inverlat Casa de Bolsa, S.A. de C.V., Grupo Financiero Scotiabank Inverlat, Scotia Inverlat Derivados S.A. de C.V. – all members of the Scotiabank group and authorized users of the Scotiabank mark. The Bank of Nova Scotia is incorporated in Canada with limited liability and is authorised and regulated by the Office of the Superintendent of Financial Institutions Canada. The Bank of Nova Scotia is authorized by the UK Prudential Regulation Authority and is subject to regulation by the UK Financial Conduct Authority and limited regulation by the UK Prudential Regulation Authority. Details about the extent of The Bank of Nova Scotia's regulation by the UK Prudential Regulation Authority are available from us on request. Scotiabank Europe plc is authorized by the UK Prudential Regulation Authority and regulated by the UK Financial Conduct Authority and the UK Prudential Regulation Authority.
Scotiabank Inverlat, S.A., Scotia Inverlat Casa de Bolsa, S.A. de C.V, Grupo Financiero Scotiabank Inverlat, and Scotia Inverlat Derivados, S.A. de C.V., are each authorized and regulated by the Mexican financial authorities.
Not all products and services are offered in all jurisdictions. Services described are available in jurisdictions where permitted by law.