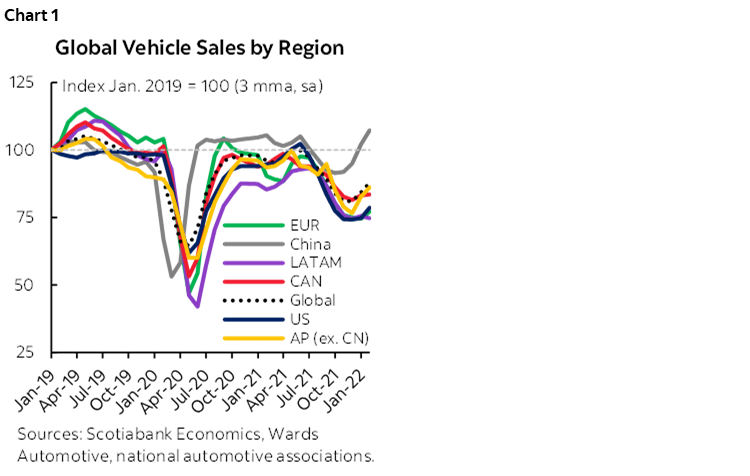
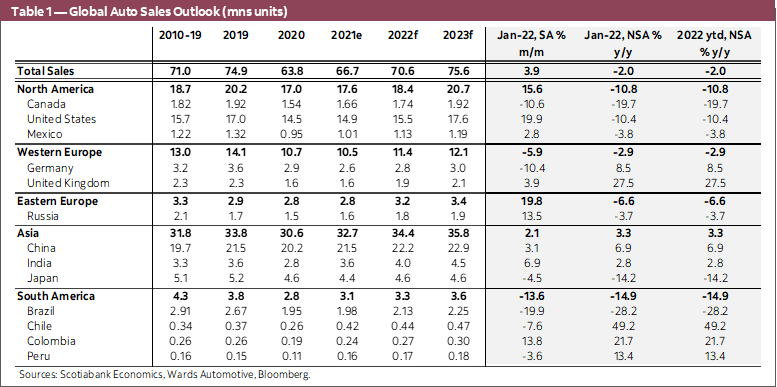
- Global auto sales improved again in January with a 3.9% m/m (sa) improvement. Monthly gains have averaged about 4% m/m (sa) over the past four months after experiencing monthly declines for much of 2021 (chart 1).
- Global auto purchases are nevertheless still seriously depressed with annualised sales in January at around 67 mn units—over 10% below 2019’s 75 mn units—underscoring that the path to recovery will be slow.
- Sales improvements were driven almost exclusively by US and China with purchase gains of 20% m/m (sa) and 3% m/m (sa), respectively. Other major global auto markets such as Germany and Japan posted declines (-10% m/m and -4.5% m/m, respectively).
- Canadian data sources differ widely on their view of January sales: ranging from +6% m/m to -11% m/m. This puts the seasonally adjusted annualised sales rate in the range of 1.45 to 1.65 mn units which is low by all accounts.
- By early February, automakers had already begun to scale back production forecasts temporarily owing to persistent supply shortages attributed to omicron-related constraints as well as bridge blockades in Canada. This will have knock-on effects for the auto sales recovery with earlier-anticipated first-quarter production rebounds now likely out of reach.
- Consequently, price pressures in both new and used vehicle markets show little sign of abatement in light of persistent supply-demand imbalances.
- In this issue, we explore potential implications for auto sales as central banks in the US and Canada are expected to begin raising policy rates in the coming weeks. While increasing market rates will add to the headwinds of already-escalating vehicle ownership costs, we do not expect immediate dampening effects owing to strong labour market conditions, solid household balance sheets, and pent-up demand for new vehicles.
- With excess demand conditions to persist over our forecasting horizon in both economies, we expect the auto sales expansion to continue through 2023 at least.
IF YOU BUILD IT THEY WILL COME
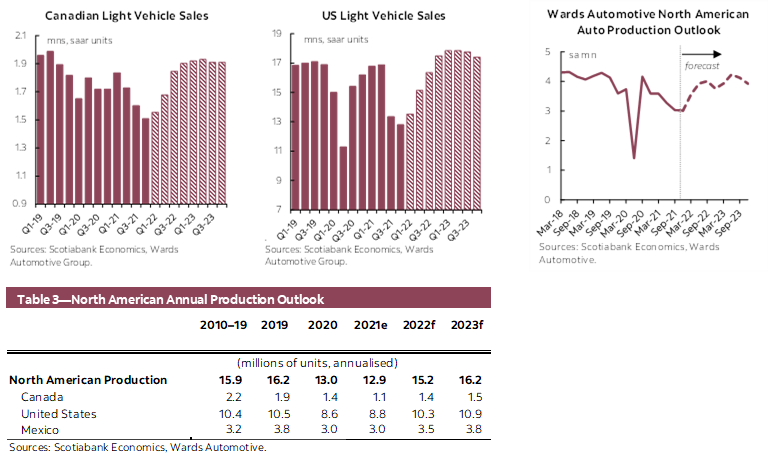
Auto production—and relatedly prices—continue to capture headlines and dominate the global auto sales landscape. North American auto production had at least stabilized in the final quarter of 2021 after quarterly losses since late-2020 (chart 2). However, January was a reminder of the precariousness of the auto production recovery and a warning to brace for (more) volatility as North America auto output pulled back by over -5% m/m (sa). Some of this was expected owing to omicron-related setbacks in January, but made-in-Canada blockades in February added to an already-challenging environment.
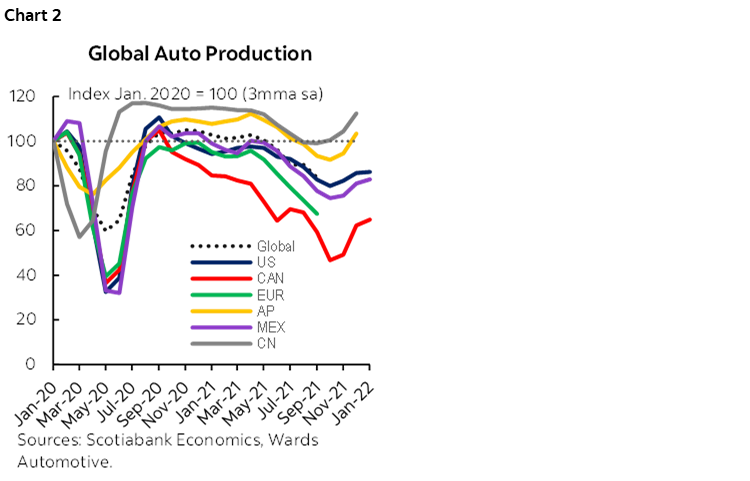
North American auto production in the first quarter of 2022 likely faces more downside. Wards Automotive Group has recently revised down its Q1-2022 production forecast by 110, 000 vehicles, of which it attributes about 40,000 to the blockades. It maintains its 2022 production forecast at 15.3 mn units—up from the sub-13 mn units produced regionally in 2020 and 2021, but still well-below the 16.2 mn units in 2019. This assumes the recovery resumes in March onward (see annex for production outlook).
Global auto production shortfalls are expected to persist through 2022 albeit to a lesser extent than in 2021. LMC Automotive projects a 3.8 mn vehicle deficit globally in 2022 owing to supply constraints versus the 9 mn vehicle shortfall in 2021. However, the supply recovery will be slower in some markets including North America where the shortfall is still expected to be above 1 mn units in 2022 following last year’s 2 mn output loss. (For a discussion on the outsized impact on Canadian auto production and implications for Ontario’s economy, see here).
These production shortfalls provide a reasonable approximation of pent-up demand in North American markets. Namely, market demand would have supported an additional 3 mn more vehicle sales over 2021 and 2022 than what is currently expected as a result of inventory constraints. Structural drivers will increasingly feed this growing pent-up demand as the production recovery stretches out. IHS Markit had reported that the age of vehicle stock in the US is accelerating given low replacement rates with the average age surpassing 12 years in mid-2021 (and 25% over 16 years).
AT ANY COST?
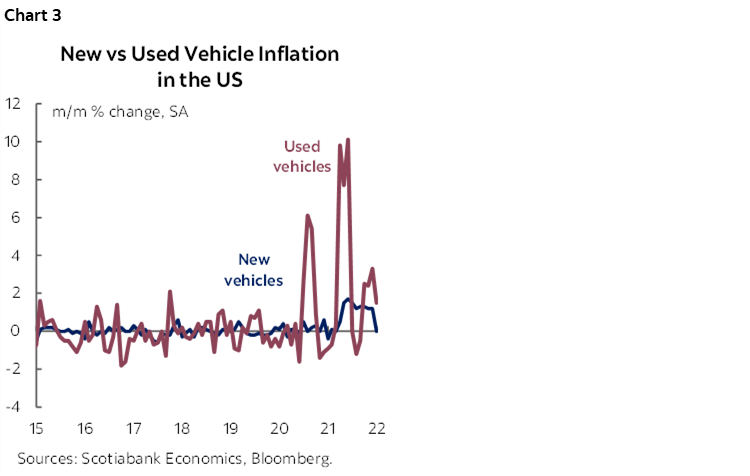
Inventory shortfalls and higher production costs are keeping prices under pressure. New vehicle prices continued to remain elevated around the world. In the US, for example, new vehicle prices as measured through CPI were up 12.2% y/y in January. While month-over-month increases paused for the first time in ten months, levels remained elevated (chart 3). TrueCar data, as cited by Wards, shows average transaction prices were up by over 16% y/y and incentives down by almost 19% y/y in January in the US. A model selection bias likely underpins some of these price pressures as higher-margin vehicles have been prioritized in production lines. Some of this should unwind as the recovery in auto production offers more selection, but it also underscores the strength in underlying demand.
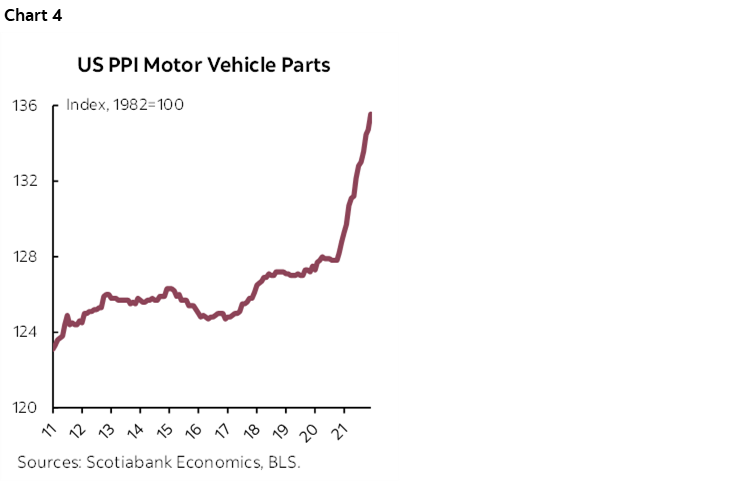
Producer price pressures are likely also contributing to price appreciation. The US producer price index for motor vehicles and parts increased again in January. The index is up by 6% since the onset of the pandemic after far more modest gains in earlier years (chart 4). The uptick in January—at a pace of 1.7% m/m—was only modestly slower than the monthly gains averaging 2.3% m/m over 2021. Longer-term shifts in inventory and supply chain practices by automakers may add to production costs over the medium term particularly in an environment where demand appears willing to foot some of these increases.
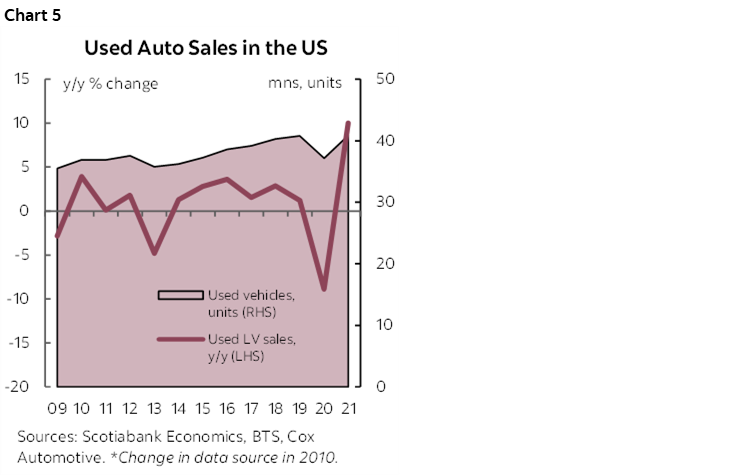
Used vehicle markets are not providing the off-ramp for consumers looking for more affordable alternatives. Normally, shoppers shift to the used vehicle market as the economic cycle matures in a counter-cyclical manner, but limited new vehicle inventory has pushed consumers prematurely into the second hand market. Cox Automotive has reported that US used vehicle sales posted a 10% y/y improvement in 2021 (on a unit basis) with sales approaching 41 mn units versus average annual sales of 38 mn units in the decade prior to the pandemic (chart 5). This exceptional sales performance explains whopping price appreciation in used car prices (40% y/y as measured in CPI data), particularly when major supply channels had dried up (e.g., fleet retirement, lease returns, and, to a lesser extent, forfeitures).
WILL A RISING RATE ENVIRONMENT THROW COLD WATER ON AUTO SALES?
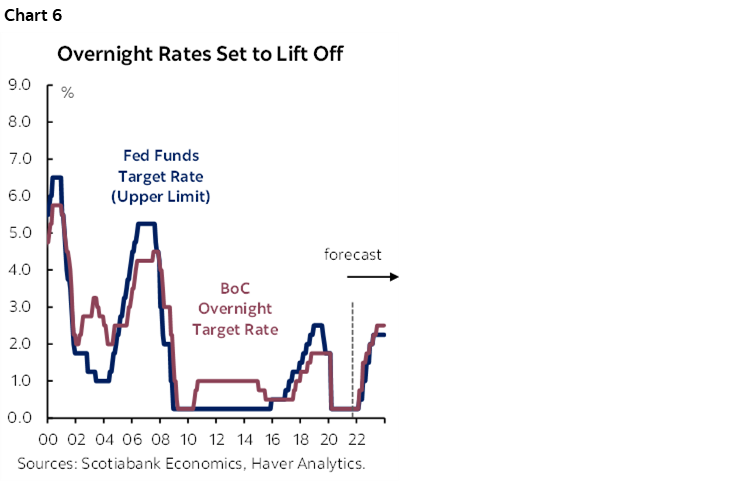
Central banks in Canada and the US have all but confirmed overnight rate hikes will begin imminently. Scotiabank Economics’ expects the Bank of Canada, for example, will have to lean aggressively against more persistent inflationary pressures, calling for a series of hikes that would bring the overnight rate to 2.00% by the end of 2022 and 2.50% by mid-2023. The US Federal Reserve is likely to follow a similar path with a terminal rate of 2.25% by early-2023 (chart 6). In Canada where auto loan interest rates follow Treasury yields more closely, market rates have already begun to rise with auto loan interest rates, as reported by the Bank of Canada, sitting only marginally below pre-pandemic rates in December. This rate likely still has more upside given markets have yet to fully price in Scotiabank Economics’ more hawkish view on where the policy rate will need to go.
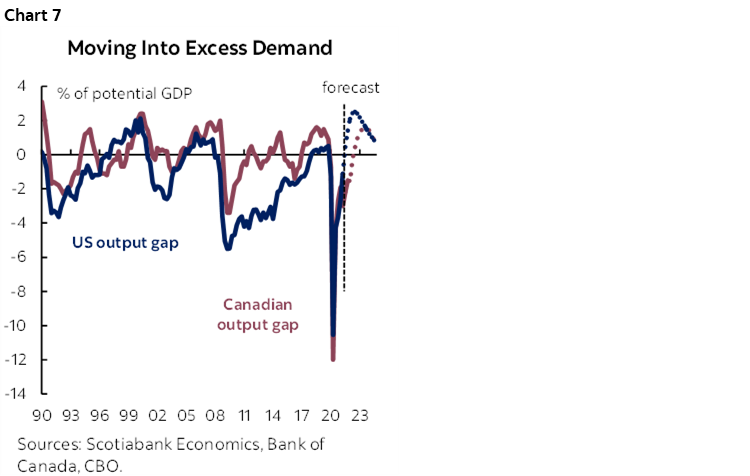
It would be hasty to write off auto sales in an environment of rising rates. Context matters. More aggressive rate hikes are predicated on both US and Canadian economies sitting in excess demand over the forecasting horizon (chart 7) even once rate hikes are incorporated. A slowing economic expansion (versus a contraction), continued improvements in labour markets, strong household balance sheets, and still-accommodative financing conditions (especially in real terms) are among some of the common themes across the US and Canadian markets (discussed in more detail later). While rate hikes are, by design, intended to cool consumption, the lag is typically measured in quarters or longer.
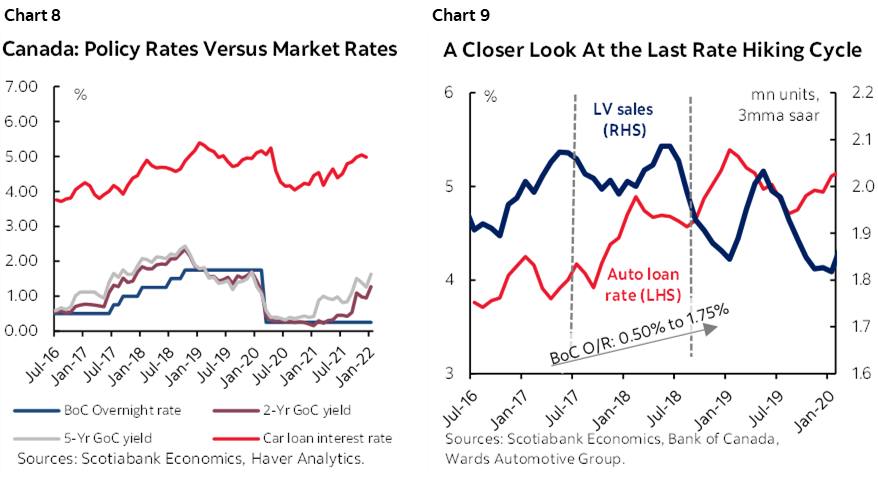
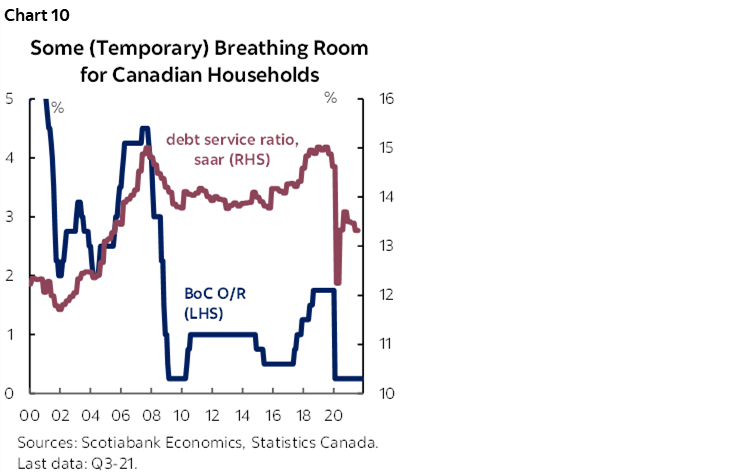
Past rate hiking cycles illustrate this lag. Canada’s last rate tightening cycle saw the overnight rate increase by 150 bps from mid-2017 through the Fall of 2018, while auto loan rates increased by about 85 bps during this period (and another 40 bps in the months that followed). Auto sales continued to expand for a good part of the hiking cycle, setting record annual sales of just over 2 mn units in 2017 (charts 8 & 9). Intended dampening effects started taking hold by mid-2018 with 2018 annual sales down by -2% y/y and -3% y/y in 2019. Despite decent economic activity and excess demand conditions, weakening household balance sheets took a toll on discretionary purchases like automobiles. Debt service ratios, for example, had ticked up by three-quarters of a percentage point over the course of the rate hiking cycle and surpassed 15% for the first time ever by early 2019 (chart 10). (This ratio stood comfortably at 13.3% at the end of Q3-2021, albeit trending back up from pandemic lows.)
Canadian households head into this hiking cycle on stronger footing relative to the last one. From a stock perspective, assets have amassed faster than debt . For example, debt as a share of net worth currently sits at 17.3% versus 19.6% heading into the last rate hikes. A good part of this is higher equity in real estate assets with this ratio standing at 75.4% versus 73.4% in mid-2017. Consumers have a bit more breathing room as disposable income boons during the pandemic drove improvements to the debt-to-income ratio, which currently sits at 179.5% versus 181.2% before the last hikes began. Perhaps most importantly from a flow basis, the share of income servicing debt is materially lower: 13.3% now versus 14.3% then. Stripping out the mortgage component of the debt service ratio (which would be refinanced at a slower pace), servicing costs on consumer debt account for the bulk of the improvement with this ratio at 6.5% of income versus 7.6% in mid-2017.
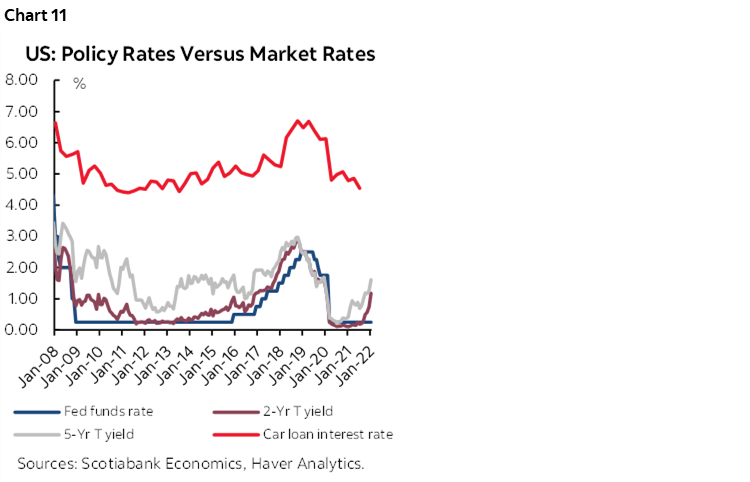
In the US, the impact was more muted in the last rate hiking cycle, admittedly in a different context. A drawn out tightening cycle that began in late 2015 while the output gap was still materially negative (but closing) extended through late 2018 for a total of 225 bps in increases. The transmission to auto loan rates was smaller—for a 150 bps increase—and lagged with the bulk of increases taking effect only by 2018 (chart 11). Not surprisingly, 2016 auto sales were record-setting at 17.5 mn units with modest declines thereafter (though Trump tax cuts likely offset some of the impact).
It would be reasonable to expect more muted and delayed impacts this hiking cycle in both markets given the persistence of excess demand in broad economic terms, as well as substantial pent-up demand specific to auto markets.
US CONSUMERS FIRST IN LINE IN JANUARY
American consumers likely got first dibs on limited inventory. January auto sales improved by a substantial 20% m/m (sa), posting a seven-month high at an annualised selling rate of 15 mn units. Improving inventory accounted for the sales boost, with levels picking up by almost 10% m/m (sa) by the end of December, according to Wards Automotive. But this was depleted (and then some) over the course January that saw the inventory-to-sales ratio hit a new low (0.87). Fleet sales are still depressed—comprising only 12.5% of total new vehicle sales in 2021 versus the pre-pandemic 20% share.
Underlying demand remains solid. January’s job report in the US surprised on the upside, along with revisions to prior months, that put the labour markets into full employment territory. The unemployment rate sits at just 3.9%. Wage growth has been accelerating, running at an annualized pace of over 7% for the past several months, though elevated inflation (7.5% y/y CPI in January) is likely offsetting wage gains.
Solid sentiment is underpinning sales. US auto purchase intentions as measured by The Conference Board have steadied at or above 11% over the past several months. This is still slightly below historic average (around 12% in the decade leading up to the pandemic), but not bad in light of other potential deterrents. This is translating into sales—as inventory permits—with January retail sales posting a 3.8% m/m gain—aided in part by the strong rebound in auto sales. On the downside, the likelihood of additional fiscal support through the USD1.7 tn Build Back Better agenda is further diminishing in light of elevated inflation and tight labour markets.
Our outlook for US auto sales in 2022 incorporates persistent supply challenges. We have penciled in annual sales of 15.6 mn units (or about a 5% gain over 2021’s 15.0 mn units sold) despite strong demand. There is upside that the recovery in auto production is faster than anticipated which could easily push sales well-above the 16 mn mark, but there is also more downside. Preliminary estimates suggest February auto sales weakened again, underscoring the volatile nature of the recovery for the auto sector. We expect sales could attain or even exceed all-time highs in 2023 with about 17.6 mn annual sales in our outlook.
CANADIANS WAIT IN THE QUEUE
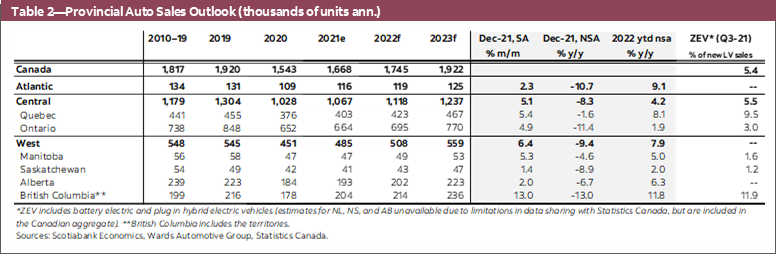
January auto sales in Canada remain a bit of wild card. Since OEMs shifted to quarterly reporting just prior to the pandemic, monthly estimates can vary widely across sources. Wards Automotive Group reported a sharp pullback of -10.6% m/m (-20% y/y, nsa) putting sales at a seasonally adjusted annualized rate of 1.45 mn units. Meanwhile, Desrosiers Automotive Consultants Inc. has reported a monthly increase of about 6% m/m (sa) at a saar of 1.66 mn units in January. We will have to wait another month or so for Statistics Canada to weigh in based on vehicle registrations.
While caution is warranted in interpreting too much into one month’s print, sales levels were weak by all accounts. Most parts of the country were under lockdown for the month of January which may have dampened appetite for car-shopping but, more realistically, tight inventory likely remained the constraining factor. Proprietary data indicates days supply barely budged across Canada in January, sitting at less than half of what it was in January 2021.
Demand-side factors in Canada remain robust despite a temporary dip in jobs. Omicron-related impacts saw January jobs decline by 200k (-1% m/m), though this is expected to be short-lived similar to past pandemic waves. Most provinces began fully re-opening in February. Wages have continued to trend upward with annualised growth in the range of 6–9% y/y since the summer, while household savings remain elevated. Household balance sheets—though dated figures as of Q3-2021—show Canadian consumers still have some breathing room across a range of metrics from debt as a share of disposable income to debt service ratios.
Much like south of the border, elevated inflationary pressures eat into some of this consumer firepower. Headline inflation hit a 30-year high in January (5.1% y/y) with vehicle ownership costs a material contributor to trend price pressures. New vehicle price appreciation surged by 0.9% m/m (nsa) for a 5.2% y/y increase. This doesn’t take into account escalating prices at the pump that sit well-above pre-pandemic levels. Used vehicle shortages provide little alternative with the Canadian Black Book retention index up by 2.3% m/m in January.
Pent-up demand should also drive a longer tail to the auto sales expansion. Auto sales have been well-below fundamental demand for most of 2021 and the supply shortfall expected to persist through 2022. This is expected to drive pent-up demand. In the Bank of Canada’s most recent Canadian Survey of Consumer Expectations in the final quarter of 2021, consumers reported spending growth intentions of 5% in the next six months and a net positive number of consumers (5 ppts) planned to spend more on durables such as vehicles. Fleet replenishment is also still at the back of the queue for the most part as higher-margin retail sales have been prioritized in a limited inventory environment. Fleet still comprises about one-in-five versus one-in-four pre-pandemic new vehicle sales. A rising rate environment may shift the terms of purchases (e.g., lease versus loan and terms of financing), but it is unlikely to create substantial headwinds to sales in the near- to-medium term.
Our outlook for auto sales in 2022 is 1.75 mn units. This reflects only a modest 4.5% y/y improvement relative to 2021 sales owing to the anticipated persistence in inventory shortages. A faster-than-expected vehicle production recovery would put sales closer to 1.85 mn units, but there is a similar range in downside risk owing to a slower recovery in sales. Lost sales are pushed out to 2023—where we forecast pre-pandemic levels of 1.92 mn units—but there is a risk that some pent-up demand disappears the longer the inventory recovery drags on as the economic (and rate hiking) cycle matures.
EV MANIA...JUST NOT HERE YET
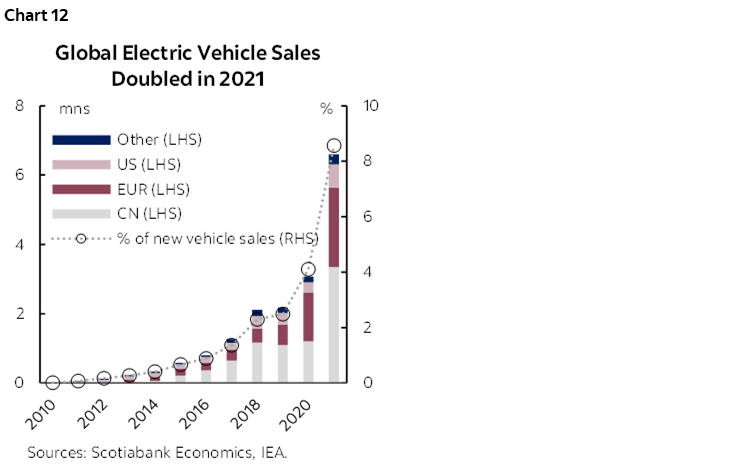
Despite broad-based supply challenges for the global auto sector, 2021 proved to be a stellar year for electric vehicle sales. The International Energy Agency reported that EV sales more than doubled in 2021 (to 6.6 mn units) over half of which were sold in China (chart 12). European EV sales increased by 70% y/y for total sales of 2.3 mn units. Meanwhile US sales doubled but to a mere 500 k. Globally, EV sales represented over 8% of total new vehicle sales with wide variation across markets. In China, EV sales reflected one-in-five vehicle purchases. In the UK, they comprised one-in-four, while German EV sales were an impressive one-in-three. In the US, the share is less than one-in-twenty.
While Canada hit its own milestone—with EVs accounting for 5% of new sales in the third quarter of 2021 (latest available)—that also works out to just one-in-twenty. Canadian budget season started earlier this week with British Columbia the first to table a fiscal plan. Already a leader in the Canadian context with almost 12% of new vehicle sales EVs, the budget provided a number of measures to further support the market. This included a $79 mn top-up to its new vehicle purchase rebate program and charging systems, a PST exemption for used zero emission vehicles (until 2027), and an increase in the luxury tax threshold on passenger ZEVs (from $55,000 to $75,000).
All eyes will be on Ontario when it launches its pre-election budget later this Spring. With EV sales stubbornly low at around 3% following the roll-back of consumer rebates three years ago, the government is keeping its cards close as to whether incentives might be back on the table, all the while actively supporting the EV production landscape. Earlier this week, it scrapped its vehicle licence plate renewal fees touting it as an affordability measure. At $120 per year, it is likely to have minimal effect on overall vehicle ownership costs.
Box 1: Trends in Global Auto Sales
Global auto sales settled at a total of 67 mn units sold over the course of 2021, a slight improvement from the weak 64 mn units in 2020, yet still well below the 75 mn units sold in 2019. Entering 2022, global auto sales continued to pick up in January by 3.9% m/m (sa) for a fourth consecutive month of growth. On an annualized basis, sales came in at a modest 67 mn units in January after trending closer to 72 mn vehicles over the first half of 2021, still 2% (y/y, nsa) lower relative to the same month a year ago. The recovery in January was mainly attributable to strong momentum in the Asia Pacific markets and a large improvement in the US market.
After stabilizing in the fourth quarter last year, North American auto sales started the year on the upswing despite omicron-related constraints. Auto production gains in December supported strong auto sales in the US in January with a 20% m/m (sa) improvement, reaching a seven-month sales high at seasonally adjusted annualized rate (saar) of 15 mn units. Canadian auto sales continued to grapple with supply challenges, with Wards Automotive Group reporting a pullback of -10.6% m/m in January following December’s double-digit growth, putting sales at 1.45 mn saar units. Meanwhile, Desrosiers Automotive Consultants Inc. has reported a monthly increase of about 6% m/m (sa) at a saar of 1.66 mn units in January, following six months of decline.
Asia Pacific recorded further sales gains for a fourth consecutive month at 2.1% m/m (sa) in January, exceeding the level in the same month a year ago by 3%. Chinese auto sales—representing over 30% of the global light vehicle market—picked up further by 3.1% m/m sa in January, albeit with some deceleration relative to the 10% m/m improvement in December. Elsewhere on the continent, India continued to see a robust sales rebound at 6.9% m/m (sa) in January, whereas Japanese sales slid by -4.5% m/m (sa) following three months of strong recovery.
Western European markets lost some momentum and recorded a -5.9% m/m (sa) contraction in January. Sales in the largest market—Germany—have influenced headline numbers with its pullback of -10.4% m/m, though sales were down in many others (i.e., France -6.1% m/m; Spain -22.3% m/m; Netherlands -10.7% m/m). Italy and UK experienced some bounce-backs (6% m/m and 3.9% m/m, respectively) from December’s declines. Eastern European auto sales, on the other hand, saw a whopping 19.8% jump in January after eight consecutive months of retrenchment, driven by Russia and Turkey (13.5% m/m and 79.7% m/m, respectively).
Latin American auto sales also saw sharp declines in January (-9.8% m/m, sa). Brazilian sales drove headline numbers with a retrenchment of -19.9% m/m, followed by Chile (-7.6% m/m) Argentina (-5.7% m/m) and Peru (-3.6% m/m). Mexico pulled off its second consecutive month of improvement although at a slower 2.8% m/m (sa).
Box 2: Trends in Provincial Auto Sales
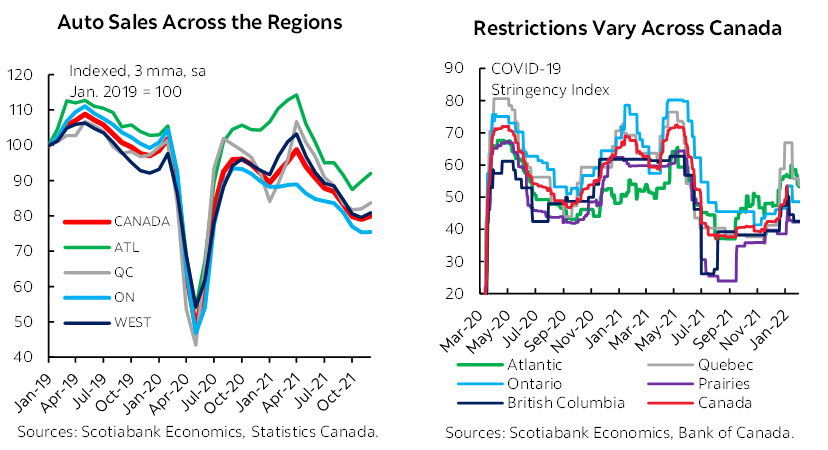
Lagging provincial auto sales data confirm a volatile recovery in auto sales across the country. With OEMs moving to quarterly reporting, caution is warranted in reading too much into one month’s sales print. Provincial sales data can vary considerably across data sources due to differences in methodologies (i.e., StatsCan reporting on vehicle registrations versus Wards Automotive and Desrosiers Automotive estimating OEM sales).
Despite discrepancies in short-term volatility, all data sources point to auto sales trending down since early Spring last year across the country as inventory shortages eclipsed the broader economic recovery. Towards the end of 2020 and early 2021, there had been some notable differentiation across markets: Atlantic Canada’s auto sales recovery was less impacted by pandemic restrictions; Quebec’s shorter and less stringent lockdowns, along with robust economic fundamentals drove an earlier surge in auto sales; Ontario’s weaker economic path—in large part owing to broader pandemic effects—weighed more heavily on its auto sales; while Western Canadian sales were fueled by rebounding commodity prices and stronger economic fundamentals in British Columbia. However, inventory shortages have universally pulled down sales across the regions since Spring 2021.
Towards the end of 2021, all three data sources recorded encouraging monthly rebounds in national auto sales. Wards reported national sales growth of 11.3% m/m sa in December, supported by 4.7% m/m growth estimated by StatsCan, and almost 9% by Desrosiers. With 2021 now in the rear-view mirror, total national auto sales in 2021 settled at slightly higher than the depressed level in 2020 yet stood well below the pre-pandemic level in 2019. Wards Automotive, for instance, recorded national auto sales at 1.7 mn units in 2021, 7.8% up from 2020, and -23.4% below 2019. Overall, the recoveries in Atlantic Canada, Quebec and British Columbia continue to perform above the national average, with sales in Saskatchewan and Ontario barely improving relative to the all-round challenging sales year in 2020.
Production factors are likely to continue to affect auto sales in the months ahead with persistent supply challenges attributable to omicron-related constraints as well as bridge blockades. It will likely only be well into 2022 before we start to see differentiation across markets based on more traditional economic drivers as limited inventory continues to put a cap on auto sales in an environment of pent-up demand.
Quarterly Outlook for North American Auto Sector
DISCLAIMER
This report has been prepared by Scotiabank Economics as a resource for the clients of Scotiabank. Opinions, estimates and projections contained herein are our own as of the date hereof and are subject to change without notice. The information and opinions contained herein have been compiled or arrived at from sources believed reliable but no representation or warranty, express or implied, is made as to their accuracy or completeness. Neither Scotiabank nor any of its officers, directors, partners, employees or affiliates accepts any liability whatsoever for any direct or consequential loss arising from any use of this report or its contents.
These reports are provided to you for informational purposes only. This report is not, and is not constructed as, an offer to sell or solicitation of any offer to buy any financial instrument, nor shall this report be construed as an opinion as to whether you should enter into any swap or trading strategy involving a swap or any other transaction. The information contained in this report is not intended to be, and does not constitute, a recommendation of a swap or trading strategy involving a swap within the meaning of U.S. Commodity Futures Trading Commission Regulation 23.434 and Appendix A thereto. This material is not intended to be individually tailored to your needs or characteristics and should not be viewed as a “call to action” or suggestion that you enter into a swap or trading strategy involving a swap or any other transaction. Scotiabank may engage in transactions in a manner inconsistent with the views discussed this report and may have positions, or be in the process of acquiring or disposing of positions, referred to in this report.
Scotiabank, its affiliates and any of their respective officers, directors and employees may from time to time take positions in currencies, act as managers, co-managers or underwriters of a public offering or act as principals or agents, deal in, own or act as market makers or advisors, brokers or commercial and/or investment bankers in relation to securities or related derivatives. As a result of these actions, Scotiabank may receive remuneration. All Scotiabank products and services are subject to the terms of applicable agreements and local regulations. Officers, directors and employees of Scotiabank and its affiliates may serve as directors of corporations.
Any securities discussed in this report may not be suitable for all investors. Scotiabank recommends that investors independently evaluate any issuer and security discussed in this report, and consult with any advisors they deem necessary prior to making any investment.
This report and all information, opinions and conclusions contained in it are protected by copyright. This information may not be reproduced without the prior express written consent of Scotiabank.
™ Trademark of The Bank of Nova Scotia. Used under license, where applicable.
Scotiabank, together with “Global Banking and Markets”, is a marketing name for the global corporate and investment banking and capital markets businesses of The Bank of Nova Scotia and certain of its affiliates in the countries where they operate, including; Scotiabank Europe plc; Scotiabank (Ireland) Designated Activity Company; Scotiabank Inverlat S.A., Institución de Banca Múltiple, Grupo Financiero Scotiabank Inverlat, Scotia Inverlat Casa de Bolsa, S.A. de C.V., Grupo Financiero Scotiabank Inverlat, Scotia Inverlat Derivados S.A. de C.V. – all members of the Scotiabank group and authorized users of the Scotiabank mark. The Bank of Nova Scotia is incorporated in Canada with limited liability and is authorised and regulated by the Office of the Superintendent of Financial Institutions Canada. The Bank of Nova Scotia is authorized by the UK Prudential Regulation Authority and is subject to regulation by the UK Financial Conduct Authority and limited regulation by the UK Prudential Regulation Authority. Details about the extent of The Bank of Nova Scotia's regulation by the UK Prudential Regulation Authority are available from us on request. Scotiabank Europe plc is authorized by the UK Prudential Regulation Authority and regulated by the UK Financial Conduct Authority and the UK Prudential Regulation Authority.
Scotiabank Inverlat, S.A., Scotia Inverlat Casa de Bolsa, S.A. de C.V, Grupo Financiero Scotiabank Inverlat, and Scotia Inverlat Derivados, S.A. de C.V., are each authorized and regulated by the Mexican financial authorities.
Not all products and services are offered in all jurisdictions. Services described are available in jurisdictions where permitted by law.