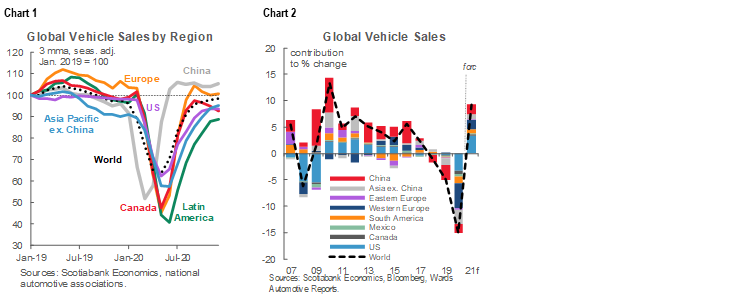
Global auto sales contracted sharply by -15% y/y* in 2020 as countries around the world confronted the COVID-19 pandemic (chart 1).
Pandemic-related factors were the biggest drivers of differentiation in auto sales across countries and regions last year: the prevalence of the pandemic, the stringency of containment measures, and magnitude of the policy responses.
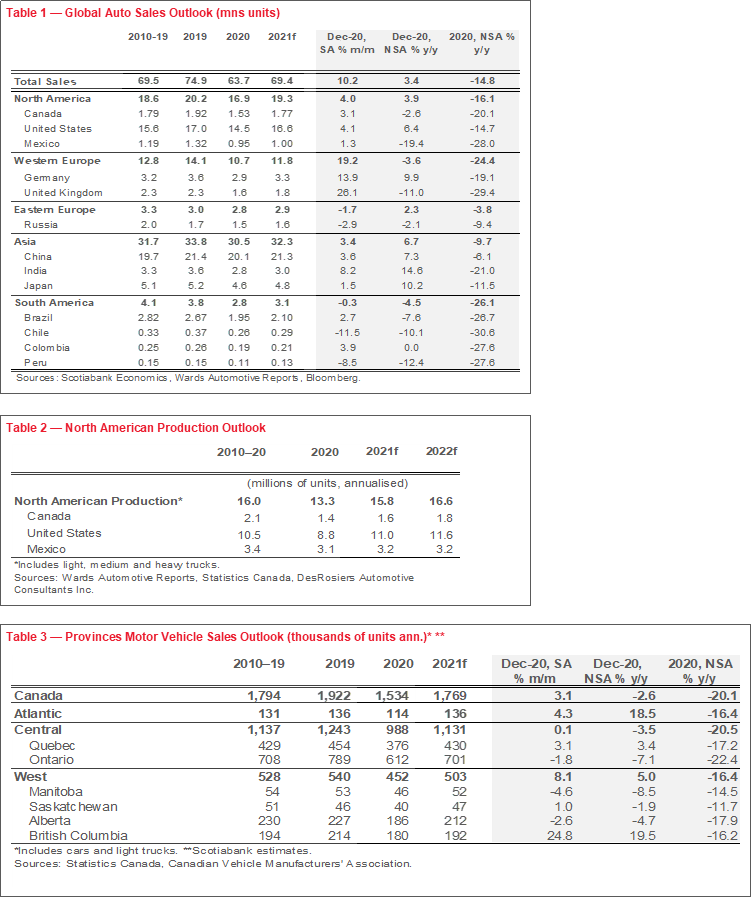
China sat on one end of the spectrum with auto sales down by ‘only’ -6% in 2020. Effectively avoiding second waves of COVID-19, China’s economic output returned to pre-crisis levels by year-end with the aid of substantial policy support.
Latin American countries fell on the other end of the spectrum with regional auto sales down by -27% y/y as first waves persisted well into the second half of the year. Variable policy support, as well as commodity exposure, drove some divergence within the region.
European economies did not fare much better with Western European auto sales down by -24% y/y in 2020. Despite ample policy supports, high COVID-19 cases and repeated waves in most countries necessitated tighter restrictions that took a serious economic toll.
US auto sales landed at -15% y/y. Despite high COVID-19 cases, less restrictive measures, along with a highly accommodative policy environment, moderated the economic impact of the pandemic in 2020.
Canada fell mid-range with auto sales down by -20% in 2020. Sizable policy responses offset the impact of stringent containment measures across large parts of the country in 2020.
We expect global auto sales will rebound by around 9% in 2021 with a wide range across countries (chart 2). Key drivers of country-specific auto sales outlooks include the depth of the auto sales decline in 2020, the strength of the economic hand-off from 2020, the speed of vaccine rollouts, the continuation of policy supports, and increasingly, structural characteristics prior to the pandemic.
Global auto sales are only expected to surpass pre-pandemic levels by 2023.
SHARP DECLINES, SHARP RISES
Global auto sales closed the year down by -15% in 2020. In the early months of the pandemic, many major economies saw auto sales plummet to depths of -70 to -80% y/y. Chinese auto sales, for example, came to a near-stop at -80% y/y in February as COVID-19 hit. Western European sales plummeted by -80% y/y in April as its economies were struck by first waves. Canada also saw similar declines in April as government-mandated shut-downs halted non-essential activity.
Almost as fast as the declines unfolded, auto sales rebounded at an exceptional pace as economies reopened after first waves were contained. Canada’s third quarter auto sales, for example, posted a 70% q/q (sa) improvement, after a decline of -35% q/q (sa) in the second quarter. Like most other markets around the world, fourth quarter sales activity began normalising as pent-up demand was largely exhausted. As the year-end approached, sales activity softened with second waves escalating in Canada.
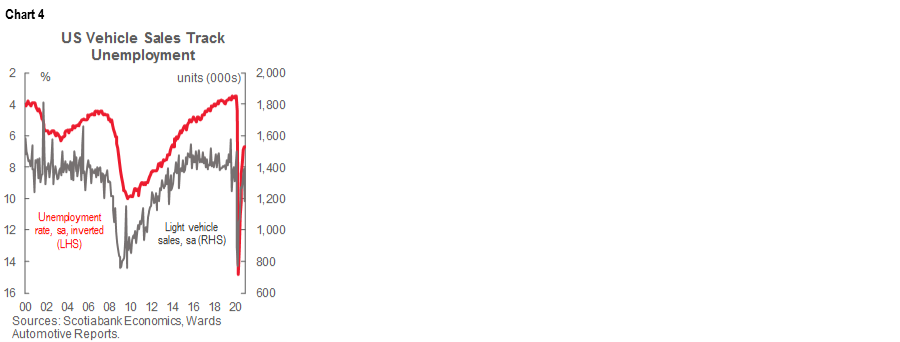
For the year as a whole, pandemic-related factors drove differentiation in auto sales across markets around the world (chart 3). These factors included the prevalence of the virus, the stringency of mandated restrictions on activity, and the offsetting supports from governments. Chinese auto sales, for example, were down by only -6% y/y (20.1 mn units) as the earlier onset of the pandemic provided more runway for sales recovery, while strict pandemic management prevented second waves. The government also provided substantial policy supports to reinvigorate activity which propelled economic activity back to pre-crisis levels by year-end.
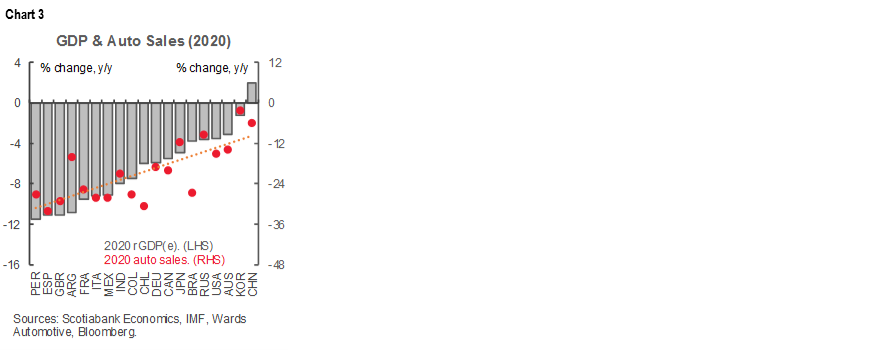
At the other end of the spectrum, Latin American auto sales were down around -27% (3.8 mn units) as first waves of COVID-19 persisted well-into the second half of 2020. Governments for the most part had more limited policy options to respond, at least relative to many advanced economy peers. That said, even with substantial policy support, Western Europe auto sales approached these depths with sales down -24% y/y (10.7 mn units) as its major markets were battered repeatedly by consecutive outbreaks that saw many European countries under strict lockdowns for substantial parts of the year.
US auto sales fared relatively well with a -15% y/y decline (or 14.5 mn units). Despite high COVID-19 case counts, American states adopted patchwork approaches to pandemic management, which on aggregate were less stringent than other countries. Consequently, the hit to its GDP was smaller (and auto sales losses more modest), with a less pronounced rebound effect mid-year.
Canadian sales finished the year down -20% y/y (1.5 mn units), which, by most accounts, could have been far worse. Our own forecasts at the onset of the pandemic had guided a decline in the order of -30% y/y. By June, we had revised these upward to -25% y/y based on substantial income replacement programs. We subsequently adjusted the forecast to -20% by August (and held it constant for the remainder of the year) based on the strength of the consumer rebound.
The following provides some reflections on the factors behind auto sales dynamics in 2020 with a focus on the Canadian market. A final section profiles our global forecasts for 2021.
(MOST) HOUSEHOLDS HOLDING UP
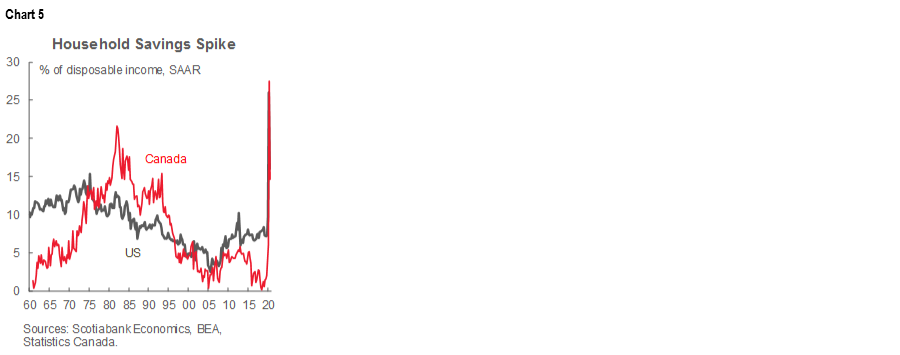
Elevated household disposable incomes were one driving factor behind the extraordinary rebound in auto sales in many advanced economies such as Canada and the US. Usually, employment numbers provide a proxy for disposable income, namely when job losses are high (and wage pressures muted), household income tends to suffer. This in turn depresses consumption. The link between employment and auto sales is well-established in major markets like the US (chart 4). In this downturn, record-breaking unemployment numbers in Canada (and other countries) at the peak of first lockdowns painted only a partial picture.
Exceptional policy supports—most notably income replacement schemes—offset this impact in 2020. The IMF has estimated governments around the world injected around USD12 tn (and counting) into the global economy in 2020 in response to the pandemic. Canada provided among the highest discretionary support to its economy relative to peers. In the second quarter alone, Canadian households received about $30 bn more in government transfers than they lost in aggregate wages through programs such as the Canada Emergency Response Benefit.
Household savings consequently spiked. In the second quarter of the year, household savings as a share of disposable income hit a record-high in Canada at almost 30% (chart 5). In normal times, Canadians tend to save only around 2–3%, while the Global Finance Crisis saw savings approach 7%. Unlike past recessions, savings were not driven exclusively by precautionary behaviours; rather, some was driven by involuntary savings as economic restrictions took hold (think hair cuts, coffee, travel), as well as substantial government transfers.
A partial unwinding of savings likely supported Canada’s mid-year auto sales rebound. By the end of the third quarter, household savings rates had nearly halved in Canada. Retail sales—and tangible goods in particular—boomed in the aftermath of first wave shutdowns. Retail sales in Canada had already exceeded pre-pandemic levels by July. The pace at which Canadians unwind remaining savings will have important implications for auto sales ahead. The Bank of Canada, in its latest Monetary Policy Report, assumes only a slow draw-down over the course of the recovery, but there is a decent chance this could happen faster providing some upside to the outlook.
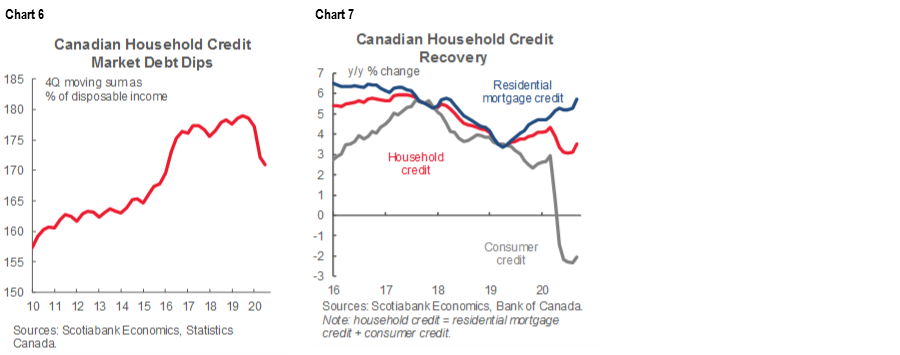
Households also created more headroom as they consolidated their balance sheets. For example, Canadian household debt as a share of income declined by about 5 ppts by the end of the third quarter (chart 6). Recall, there was debate in 2019 whether high household debt levels were curtailing discretionary spending on things like automobiles in Canada despite otherwise broadly stable economic growth. Part of this improvement was driven by the denominator (i.e., temporary higher disposable income), but households also shifted the composition of debt. Mortgage credit took off in 2020 as national home sales surged by almost 14% y/y in 2020, while consumer credit dipped (chart 7). The Bank of Canada indicates that many Canadians paid down credit card debt which is one component of consumer credit. The net effect would mean lower debt levels as well as greater equity behind that debt.
CAUTIOUSLY OPTIMISTIC CONSUMERS
Consumer confidence has also been influential on auto sales. At the onset of the pandemic, confidence plunged as measured by sentiment surveys by the University of Michigan and the Conference Board. In Canada, back in the Spring the Conference Board’s major purchase intention survey saw a serious deterioration in sentiment with almost 80% of respondents indicating it was a bad time to make a major purchase of items such as automobiles or appliances (chart 8).

However, sentiment quickly recovered after the first wave. Major purchase intentions in Canada still show a modest gap relative to pre-pandemic levels, but importantly they have not cratered under second waves as consumers likely see light at the end of the tunnel by way of vaccines on the horizon.
RISING WEALTH EFFECTS
Wealth effects also drive sentiment (and ultimately consumption). It is not only disposable income that supports consumption, but also other equity. For Canadians, housing equity is substantial, and even showed a modest improvement by the end of the third quarter in 2020 (chart 9). Home price appreciation—as measured by the MLS Average Home Price—was up by almost 13% across Canada in 2020 as strong demand held up against the pandemic, compounding persistent supply pressures that pre-dated COVID-19.

Financial markets also quickly recovered pandemic losses and then some by year’s end. At the onset of the pandemic, stock markets around the world declined substantially. The S&P 500, for example, dropped by 34% within a matter of weeks, but ended the year with a 16% gain. North of the border, the recovery is still underway—the TSX currently sits slightly below pre-pandemic levels in CAD terms—so admittedly the wealth effect would be less pronounced, but still better than a typical economic downturn when losses are more sustained. A host of factors fueled financial market recoveries, notably massive government responses that stemmed economic fallouts and drove down yields in bond markets, prompting a search for yield in riskier markets.
Towards the latter part of 2020, gains increasingly looked past pandemic drivers with vaccines on the horizon and prospects for greater US political stability. The cumulative effects would have seen higher-income households accruing higher net equity over the course of the pandemic. Wealth effects suggest this would be supportive of discretionary purchases such as automobiles.
CHEAP CREDIT
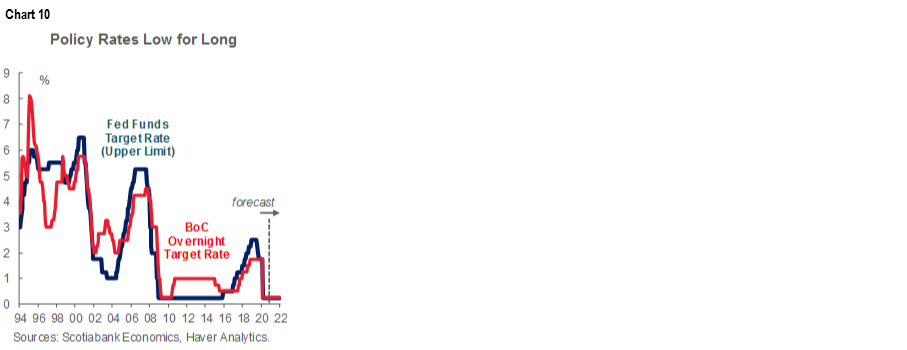
Loose financial conditions have been another supportive factor behind auto sales recoveries. Central banks around the world, including the Bank of Canada, dropped overnight rates at the onset of the pandemic. Both the Bank of Canada and the US Federal Reserve have guided that their policy rates will be held at the lower bound until inflation targets are durably achieved which they expect only in 2023 (chart 10).
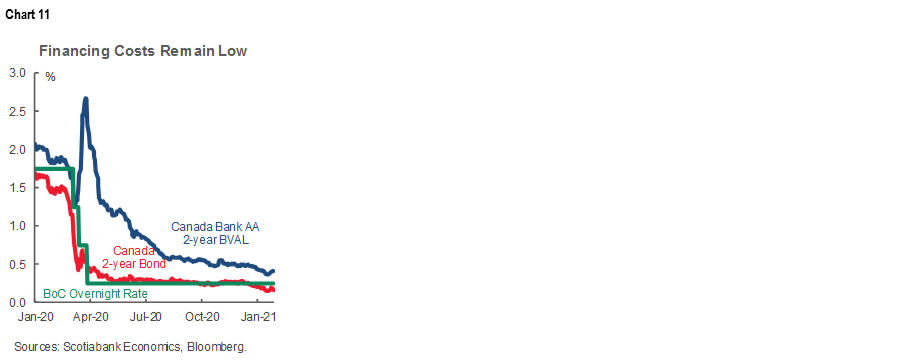
Recall, credit conditions initially tightened at the onset of the pandemic despite early action on policy rates. Whereas rate cuts in calmer times would spur credit growth and investment, heightened uncertainty froze lending markets as credit and liquidity risks were priced in. A host of purchase facilities launched by the Bank of Canada (that saw its balance sheet quintuple) quickly narrowed these premiums in a short period. Currently, the Bloomberg AA-rated Canadian bond indices (which are used in the rate setting process for subvented auto loan programs) sit only modestly above “risk-free” Government bond yields and about 1.5 ppts below pre-pandemic levels (chart 11).
Given the potential for stronger economic recoveries, as implied by yield curves, it is possible central banks could eventually bring forward timelines for policy rate lifts. But this may be less relevant to the auto outlook than pricing dynamics further along the curve. In Scotiabank Economics’ latest forecasts, the outlook for 5- and 10-year treasury bond yields sees a pick-up of about two-thirds of a percentage point to 1.00 and 1.35, respectively, by the end of 2021. This is still well-below pre-pandemic levels and suggests easy credit conditions should continue to support the recovery in auto sales in 2021. Given the multi-year outlook for the economic recovery, a slightly faster-than-anticipated pace of financial market tightening on balance should be a positive as it implies a stronger economic recovery is underway which would bode well for auto sales. That said, these assumptions warrant monitoring as there is high uncertainty around the Bank of Canada and the Federal Reserve tapering timelines with risks tilted to sooner rather than later timeframes which would put further upward pressure on yields currently forecasted.
COUNTERING PRICE PRESSURES
New vehicle price inflation may have provided modest headwinds to auto sales in 2020. New vehicle price inflation trended well-above headline inflation for most of the year with December print at 2.5% y/y for new vehicle purchase versus 0.7% y/y headline inflation. Similar effects have played out in the US. Inventory shortages were likely a key driver behind new vehicle pricing as fewer incentives were used to spur sales in both markets. According to J.D. Power, the average price paid for a vehicle in the US was up by about USD4,000 (to USD38,000) relative to early 2020 prices.
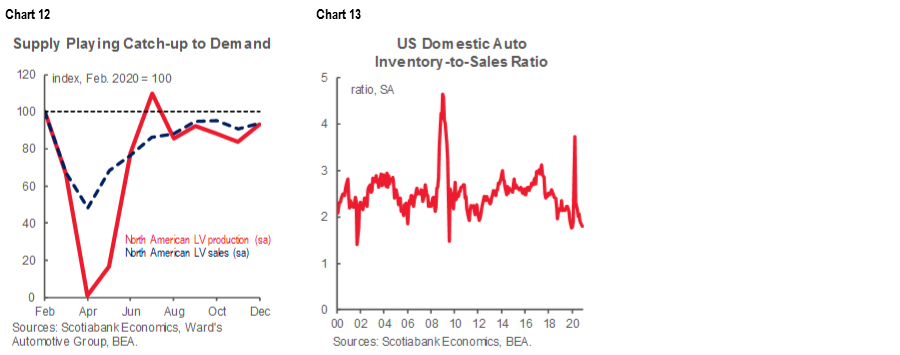
Supply has chronically trailed demand over the course of the pandemic. This is a result of full-stops (and disrupted starts) in auto production, alongside a stronger-than-anticipated rebound in demand (chart 12). The inventory to sales ratio in the US currently sits at a multi-year low (chart 13). These challenges are expected to spill over into 2021 at least through the first quarter (and possibly longer) as computer chip shortages exacerbate the situation.
Currency effects could impact the pricing environment. Normally, a weak CAD would feed through to higher new vehicle prices in the Canadian market with about a year lag but, with the sharp and transitory impacts of the pandemic on the loonie (as well as reduced risks of tariff friction on auto inputs) it is possible that auto manufacturers look through pandemic factors in 2021 pricing as the CAD is expected to continue strengthening against the USD over 2021.
The bigger impact from currency effects is likely felt in used vehicle prices. Used vehicle exports to the US increase when the CAD is weak. Anecdotal demand was already high heading into the pandemic with the CADUSD at 0.77. With the CADUSD at 0.71 in the first quarter of 2020, this only exacerbated other drivers of the used vehicle supply shortage such as lease extensions. This has driven up used vehicle prices (which otherwise normally soften in economic downturns), with Canadian Black Book reporting that used vehicle retained values (for 2–6 year-old vehicles) were at their highest level in the history of its Used Vehicle Retention Index by year-end. As used vehicle supply normalises, prices are expected to weaken and there should be more rotation towards used vehicles in 2021.
The net impact of a strong mid-year rebound in Canadian auto sales in 2020, along with relatively resilient sales activity in the face of second waves towards year-end, provides a solid hand-off to 2021.
OUTLOOK FOR CANADIAN AUTO SALES IN 2021
Canadian auto sales are expected to post a robust rebound in the order of 15% y/y in 2021 (chart 14). We have penciled in 1.77 mn sales units for the year which would still be about 8% below 2019 sales but the pace of recovery would be unprecedented relative to past recessions. Ongoing COVID-19 restrictions are expected to dampen early-year sales, but eventual re-openings should see another small surge in pent-up demand. When vaccinations are well-underway by the second half of the year, fleet sales are expected to pick up when travel resumes and reinforce headline new vehicle sales. New demand—through pandemic concerns or eventual immigration inflows—would further bolster the recovery. Loose financial conditions, a high likelihood of additional fiscal stimulus, ongoing job recovery, and the continued unwinding of substantial household savings will also contribute to the rebound through 2022 with pre-pandemic sales activity likely achieved towards the latter end of this outlook.

OUTLOOK FOR GLOBAL AUTO SALES IN 2021
We expect global auto sales to strengthen in the order of 9% y/y in 2021 to 69 mn units. Chinese and US markets continue to dominate global auto sales with 29% and 23% of global sales in 2019 (i.e., prior to the pandemic). Europe is the next largest market (19%), distantly followed by Japan (7%), while the rest of the world makes up the balance (23%).
Chinese auto sales are expected to grow by about 6% in 2021. This would bring sales to 21.3 mn units (almost on par with pre-pandemic sales in 2019). The strong economic recovery in 2020 will mean smaller pent-up demand effects in 2021, but the rotation from public investment and exports towards private consumption (along with continued supportive financial conditions) should support auto sales this year. There is upside to this outlook with low vehicle ownership suggesting potentially higher sensitivity to potential new demand from lingering health fears around public transit or ridesharing services. The Chinese auto market is likely experiencing an early-stage, multi-year growth cycle for auto sales.
US auto sales are forecast to improve by around 15% in 2021. This would bring annual sales to 16.6 mn units which is just 2% shy of 2019 sales levels. Its smaller output losses in 2020 erode some of the rebound effects for auto sales in 2021, but limited COVID-19 restrictions (so far) in early 2021 should also have a less dampening effect (on economic growth and auto sales) in the first quarter. Fleet replacement should buoy numbers in the latter part of the year as vaccinations are underway. Elevated unemployment will continue to weigh on auto sales over the course of the year, but the already-announced USD900 bn stimulus along with a high likelihood of additional spending early in the year (and most likely in the form of higher direct payments to households) could provide a very strong tailwind to auto sales. Additionally, financial conditions should remain supportive of sales. President Biden’s green tilt could also increase the chances of a cash-for-clunker program that could spur further upside demand potential (though eventually tighter fuel standards could be a downside).
Western European auto sales are forecast to strengthen in the order of 12% in 2021. At 11.8 mn units, this will still be 17% below pre-pandemic levels in 2019. The projected rebound in auto sales in 2021 is more reflective of the scale of the 2020 declines than necessarily the strength of the economic recovery (though this varies across countries within the region). Overall, continued policy support, including Next Generation EU funds, should support the economic (and auto) recovery in 2021 but pre-existing structural vulnerabilities and potential political instabilities could weigh on the outlook in some countries in the region. Furthermore, the auto market is in the midst of a multi-year structural shift towards cleaner vehicle technologies. The introduction of progressively tighter emissions regulations over the past couple of years (including in early 2020) has depressed auto sales, but effects should diminish as greater choice and affordability come on line. In fact, the German motor vehicle authority KBA reported that sales of electrified vehicles reached 22% of market share in the final quarter of 2020. France reported that full-electric vehicles represented almost 7% of total sales in 2020 (versus 2% in 2019).
Japanese auto sales could see a rebound in the order of 4% y/y in 2021. Annual sales of 4.8 mn units in 2021 would bring purchases to within 8% of 2019 sales levels. Broadly speaking, more effective pandemic containment along with strong policy supports have minimised the economic (and auto sales) impact of the pandemic. However, Japanese auto sales had been softening prior to the pandemic with a small contraction in 2019 sales owing, in part, to the increased sales tax that year. Continued support for the recovery into 2021, including large fiscal stimulus introduced at the end of 2020 should support auto sales in 2021, but a more mature auto market with weakening growth potential likely suggests a weaker medium-term outlook for auto sales.
Latin American auto sales are forecast to strengthen by 16% in 2021. This would bring total regional sales to 4.4 mn units. The rebound would be driven by the steepness of declines in 2020, as well as accommodative policy environments in 2021. However, there is a wide variation across countries in the region. At the extreme, Brazil is providing substantial fiscal support that has minimised the economic consequences of the pandemic, but its (relatively) mature auto sales market has been in decline for several years, suggesting more limited room for sales growth. Mexico, on the other hand, has faced a more substantial shock to output—to an economy that was already contracting prior to the pandemic—but has provided only limited fiscal support. Consequently, private consumption will likely lag the broader economic recovery for the foreseeable future which will dampen auto sales in the near term, but low vehicle ownership provides growth opportunity over the medium term.
*All numbers reported on y/y basis as not seasonally adjusted, whereas m/m are seasonally adjusted.
DISCLAIMER
This report has been prepared by Scotiabank Economics as a resource for the clients of Scotiabank. Opinions, estimates and projections contained herein are our own as of the date hereof and are subject to change without notice. The information and opinions contained herein have been compiled or arrived at from sources believed reliable but no representation or warranty, express or implied, is made as to their accuracy or completeness. Neither Scotiabank nor any of its officers, directors, partners, employees or affiliates accepts any liability whatsoever for any direct or consequential loss arising from any use of this report or its contents.
These reports are provided to you for informational purposes only. This report is not, and is not constructed as, an offer to sell or solicitation of any offer to buy any financial instrument, nor shall this report be construed as an opinion as to whether you should enter into any swap or trading strategy involving a swap or any other transaction. The information contained in this report is not intended to be, and does not constitute, a recommendation of a swap or trading strategy involving a swap within the meaning of U.S. Commodity Futures Trading Commission Regulation 23.434 and Appendix A thereto. This material is not intended to be individually tailored to your needs or characteristics and should not be viewed as a “call to action” or suggestion that you enter into a swap or trading strategy involving a swap or any other transaction. Scotiabank may engage in transactions in a manner inconsistent with the views discussed this report and may have positions, or be in the process of acquiring or disposing of positions, referred to in this report.
Scotiabank, its affiliates and any of their respective officers, directors and employees may from time to time take positions in currencies, act as managers, co-managers or underwriters of a public offering or act as principals or agents, deal in, own or act as market makers or advisors, brokers or commercial and/or investment bankers in relation to securities or related derivatives. As a result of these actions, Scotiabank may receive remuneration. All Scotiabank products and services are subject to the terms of applicable agreements and local regulations. Officers, directors and employees of Scotiabank and its affiliates may serve as directors of corporations.
Any securities discussed in this report may not be suitable for all investors. Scotiabank recommends that investors independently evaluate any issuer and security discussed in this report, and consult with any advisors they deem necessary prior to making any investment.
This report and all information, opinions and conclusions contained in it are protected by copyright. This information may not be reproduced without the prior express written consent of Scotiabank.
™ Trademark of The Bank of Nova Scotia. Used under license, where applicable.
Scotiabank, together with “Global Banking and Markets”, is a marketing name for the global corporate and investment banking and capital markets businesses of The Bank of Nova Scotia and certain of its affiliates in the countries where they operate, including; Scotiabank Europe plc; Scotiabank (Ireland) Designated Activity Company; Scotiabank Inverlat S.A., Institución de Banca Múltiple, Grupo Financiero Scotiabank Inverlat, Scotia Inverlat Casa de Bolsa, S.A. de C.V., Grupo Financiero Scotiabank Inverlat, Scotia Inverlat Derivados S.A. de C.V. – all members of the Scotiabank group and authorized users of the Scotiabank mark. The Bank of Nova Scotia is incorporated in Canada with limited liability and is authorised and regulated by the Office of the Superintendent of Financial Institutions Canada. The Bank of Nova Scotia is authorized by the UK Prudential Regulation Authority and is subject to regulation by the UK Financial Conduct Authority and limited regulation by the UK Prudential Regulation Authority. Details about the extent of The Bank of Nova Scotia's regulation by the UK Prudential Regulation Authority are available from us on request. Scotiabank Europe plc is authorized by the UK Prudential Regulation Authority and regulated by the UK Financial Conduct Authority and the UK Prudential Regulation Authority.
Scotiabank Inverlat, S.A., Scotia Inverlat Casa de Bolsa, S.A. de C.V, Grupo Financiero Scotiabank Inverlat, and Scotia Inverlat Derivados, S.A. de C.V., are each authorized and regulated by the Mexican financial authorities.
Not all products and services are offered in all jurisdictions. Services described are available in jurisdictions where permitted by law.