- Global auto sales saw a gain of 4.0% m/m (sa) in February for a fifth consecutive month of improvements, but sales activity is still depressed at 70.4 mn saar units.
- High monthly volatility across markets continues to mark the auto sales recovery. In pretty much a reversal of January fortunes, the US saw a sales pullback (-6.4% m/m), while Germany and Japan posted advances (+16.8% m/m and +5.0% m/m, respectively). Chinese sales gained ground for a fifth consecutive month (+6.7% m/m).
- Canadian auto sales data continues to differ according to source—from +6.8% m/m to -2.4% m/m—but sources converge on the selling rate at just above 1.6 mn units which is low by all accounts.
- Nevertheless, data is stale as the Russian invasion of Ukraine is likely to compound headwinds for the global auto sales (and production) recovery. We now expect flat sales for 2022 versus our earlier forecast for a 6% increase. The bulk of the impacts are initially concentrated in European markets, but we continue to monitor developments.
- We expect that strong economic fundamentals, along with substantial pent-up demand, should provide an offset to rising affordability challenges in the US and Canada. We maintain our auto sales outlook in these markets, but expect recent developments will reduce some of the upside potential while increasing downside risks.
- With additional inflationary pressures on key production inputs (and the potential for further supply chain disruptions), we anticipate an elevated pricing environment will persist for new and used vehicles in the US and Canada into 2023.
- In this issue, we explore gasoline price increases , relative affordability challenges, and possible implications for EV demand (and prices).
NEW RISKS ON THE HORIZON
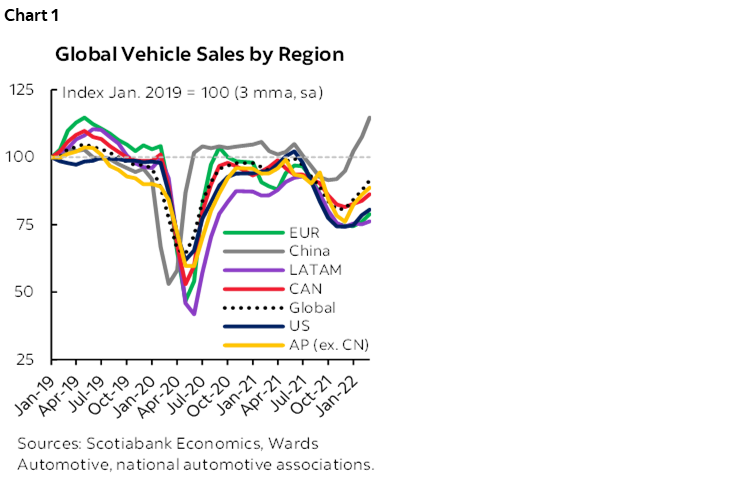
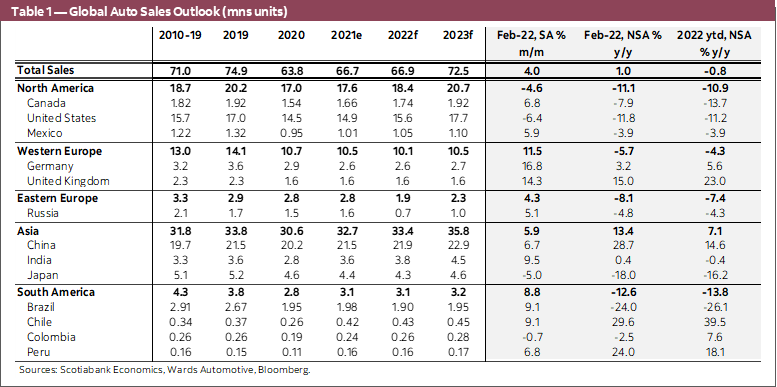
Global auto sales posted a 4.0% m/m (sa) improvement in February marking a fifth consecutive month of gains. While the pace of prior month gains has been relatively stable, there have been wild fluctuations across markets on a month-over-month basis with supply constraints (and COVID-19 factors, to a lesser extent), masking fundamental demand. Consider, for example, the performance across the four largest sales markets in February: US at -6.4% m/m; China at +6.7% m/m; Germany at +16.8% m/m; and Japan at +5.0% m/m (all sa). Global sales stood at 70.4 mn saar units in February—a decent pace of sales following the 67 mn light vehicles sold in 2021—but still below pre-pandemic sales of 75 mn units in 2019 (chart 1). (See Box 1, Annex for more details on February auto sales.)
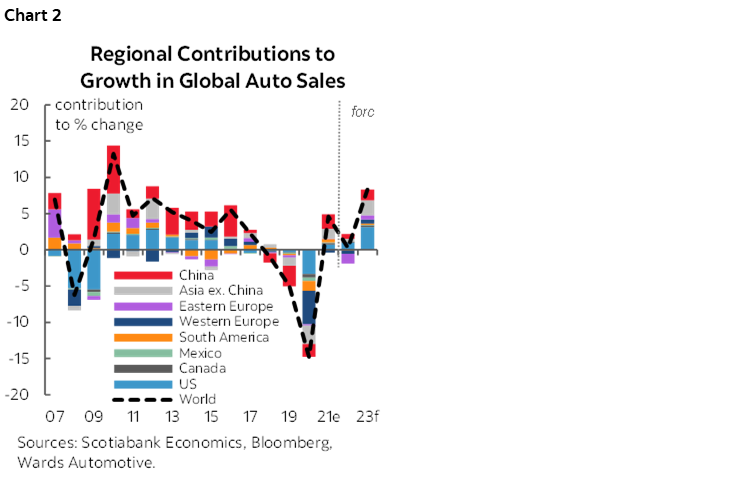
Looking ahead, the Russian invasion of Ukraine imposes material downside to the outlook for global vehicle sales. (See here for details on Scotiabank Economics’ latest economic outlook including baseline assumptions.) We have revised our 2022 global auto sales outlook to about 67 mn—or essentially flat relative to 2021 sales (chart 2). Negative economic shocks are likely to be concentrated in Europe initially, which would dampen regional auto demand (and supply). We have adjusted our European auto sales outlook from a prior mildly positive growth outlook for 2022 to a -3% y/y decline for Western Europe and very substantial losses in Eastern Europe given the size of the Russian auto sales market (we have pencilled in a -33% y/y decline for now).
The invasion is also likely to impact other regions through (even) higher inflationary environments. Higher interest rates (and higher costs of financing), elevated production costs (and pass-through to consumer prices), and higher ownership costs through fuel price increases could erode some demand. (See last month’s issue for a closer look at demand and household balance sheets in the context of a rising rate environment.) The degree to which current and pent-up demand offsets these factors should vary across countries and regions.
Relatively stronger economic fundamentals in the US and Canada, for example, provide some resilience. Both countries have experienced exceptionally strong recoveries, aided by substantial policy supports, with labour markets at or beyond full employment. Backward-looking job data from February underscores the strength in Canadian labour markets heading into the latest global setback. While the Conference Board reported improving consumer sentiment in March, higher-frequency polling in the Bloomberg Nanos Canadian Confidence Index saw sentiment sour towards the end of the month. On net, we expect the positive terms of trade shock (from higher commodity prices) stands to offset some of the potential drag from higher inflation and elevated uncertainty for the Canadian economy.
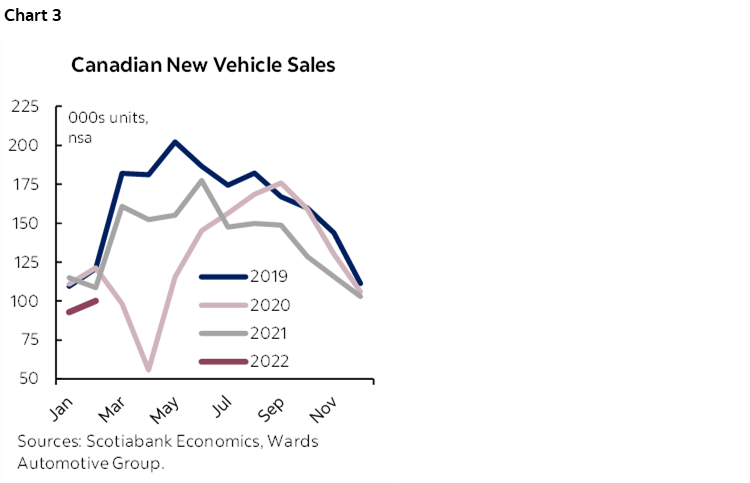
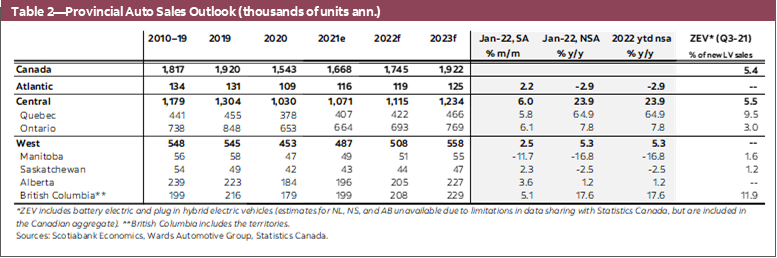
February auto sales data offers limited information on the health of the Canadian market. Data continues to be volatile and contradictory by source: Wards’ data reported a +6.8% m/m (sa) improvement following January’s -5.3% m/m decline. Meanwhile, DesRosiers Automotive Consultants Inc. has reported a dip of -2.4% m/m (sa) in February following the 6% m/m (sa) rebound in January. There is a bit more concurrence on estimates of February’s seasonally adjusted annualised sales rate with DesRosiers and Wards reporting 1.62 mn and 1.64 mn saar units, respectively. It is a soft start to the year (chart 3); proprietary data showed another decline in days supply in February that continues to limit sales potential.
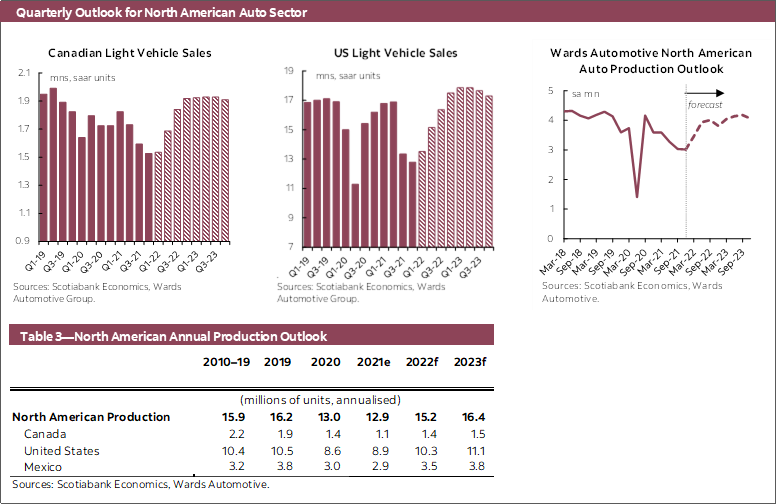
We are holding the line on our outlook for Canadian and US auto sales for now. Our forecast for Canada and the US this year is 1.75 mn and 15.6 mn units, respectively. Year-to-date saars stand at 1.6 mn and 14. 5 mn units so gradual trend-improvements lie ahead. Our early-year outlook had already built in considerable supply constraints over the course of 2022 that would keep auto sales below fundamental demand, which otherwise suggests sales should be back to or above pre-pandemic levels absent vehicle shortages. The effects of recent geopolitical developments likely erode some of the upside to our prior outlook (namely, the loss of some pent-up demand ), while adding more potential downside (particularly through supply channels).
PRODUCTION PAINS
Global auto production is at risk with the Russian invasion. There is still limited sight on production plans beyond regular announcements by automakers, but European production has already been curtailed. Regional supply chain disruptions of critical parts, including Ukrainian-produced wire harnesses, are pointing to production losses in the order of 2 mn vehicles according to AutoForecast Solutions. The losses announced so far are predominantly concentrated in Europe.
Should the conflict persist and sanctions continue to mount, it is reasonable to anticipate reverberations across global supply chains in the months ahead. Semiconductor chip manufacturers, for example, reportedly have several months of inventory of critical gases (neon and krypton), which are produced almost exclusively in Russia, Ukraine, and China. Meanwhile, a Japanese earthquake in mid-March took three Renesas chip plants temporarily offline, while Toyota halted operations at 18 regional facilities.
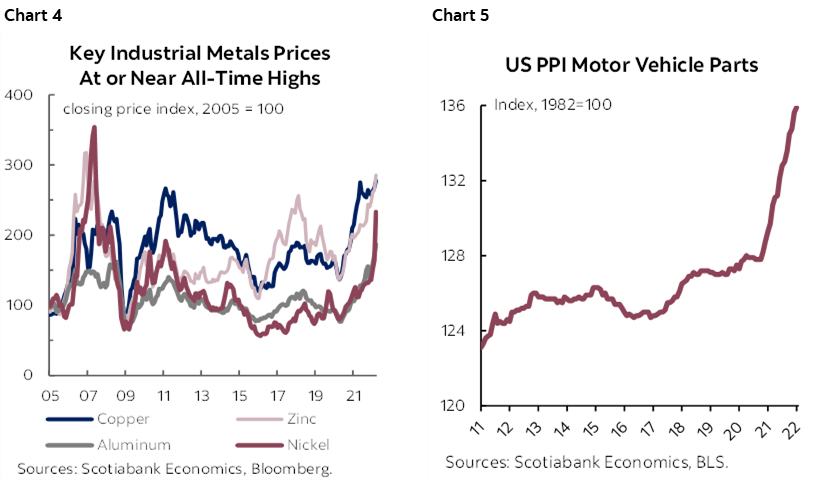
The global auto sector is also likely to experience additional production price pressures as a result of the invasion. With headline inflation expected to increase in most parts of the world owing to energy and food price escalation, a host of essential inputs to auto production have also been caught in the price upswings (including steel, aluminum, copper, and nickel) and are likely to add further pressure to producer prices (chart 4). US producer prices for motor vehicle parts continued to climb in February data, not yet reflecting latest developments (chart 5). JD Power expects new vehicle prices in the US are tracking 18% higher in the first quarter of 2022 relative to the first three months of 2021 with consumer incentive spending at record lows.
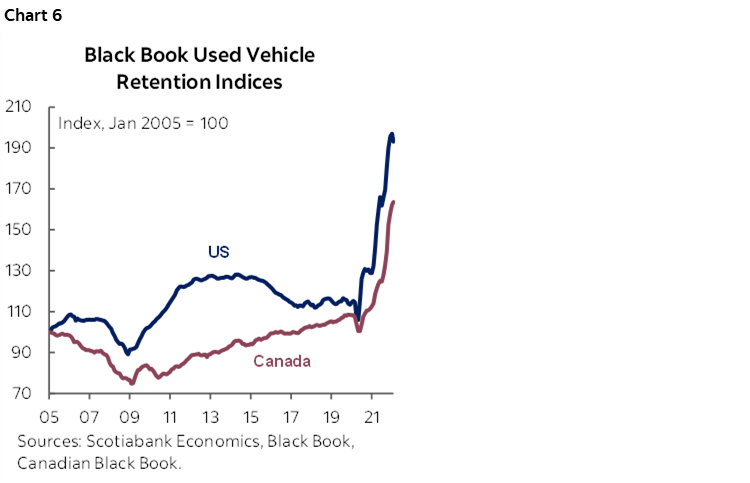
Some reprieve in used vehicle price pressures (in the US at least) in February appears temporary. Black Book’s retention index shows a decline in February data (chart 6), while its weekly wholesale price tracking showed softening. This didn’t translate into softer retail prices, and has since reversed as wholesale price appreciation has resumed. Tax season may be behind the near-term effects, but the persistence of high-prices and limited-inventory in new vehicle markets, set against a resumption in travel, suggests prices aren’t likely to give away durably anytime soon.
POCKETBOOK PRESSURES
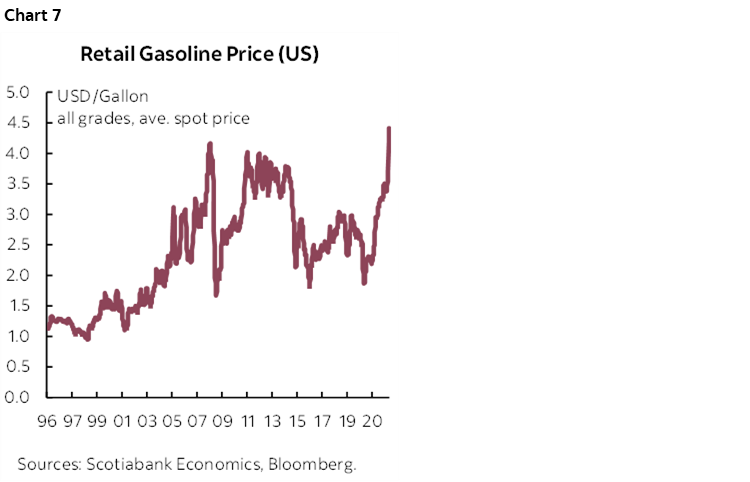
Recent gasoline price spikes will not go unnoticed. Retail gasoline prices in the US have increased by almost one USD per gallon since the beginning of the year and almost USD2.50/gallon since the ebb of the pandemic (chart 7). Cox Automotive’s Kelley Blue Book estimates that a one-dollar-a-gallon increase adds USD74/mo to fueling costs for a full-size SUV relative to last year (March 2021) against a 5-year average monthly fuel price of USD227.
This is likely to weigh on consumers as other costs also mount. Purely for illustrative purposes, a 2 ppt increase (to 7%) in the financing rate of a USD44,000 vehicle (the approximate average transaction price in the US in March) financed over 96-months would translate into an additional USD40/mo in financing costs. If new vehicle price appreciation continues—but slows to about half the rate we’ve seen over the past year—this would add another USD55/mo. The costs add up, but fuel prices potentially represent the most significant, immediate, and visible impact for drivers.
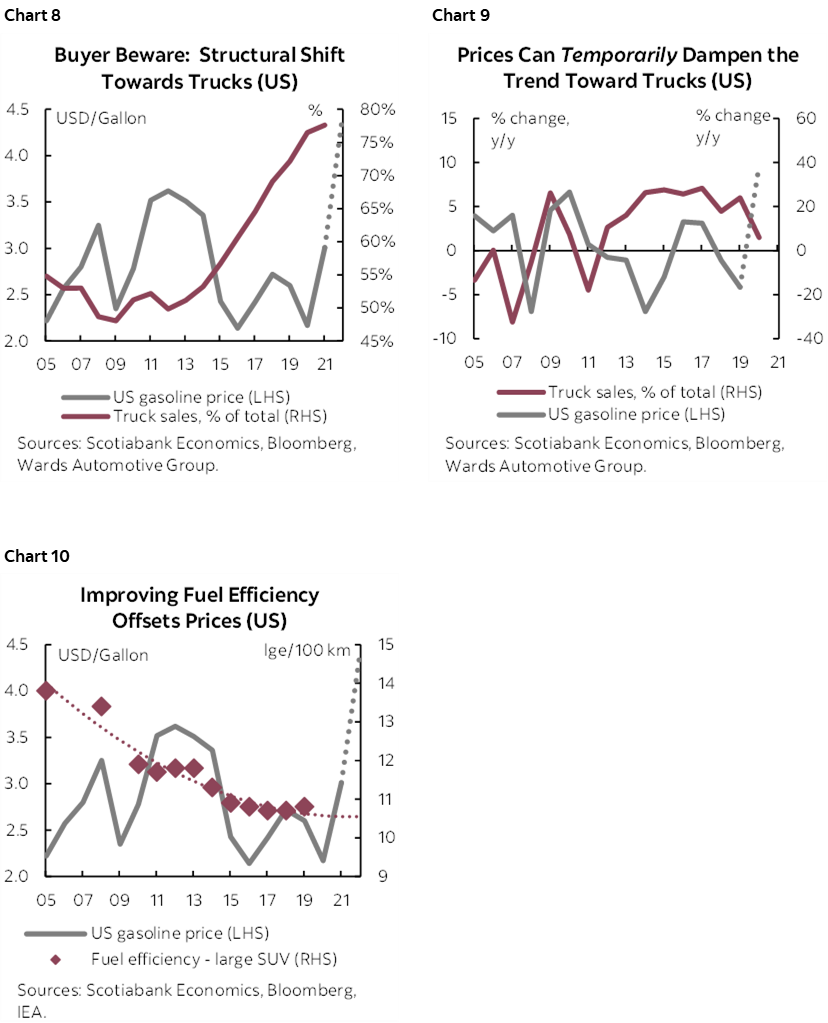
Will elevated gasoline prices propel EV sales? The answer is mixed. A shift in preference among American drivers (where data is better) towards “trucks” (i.e., light trucks and SUVs) has been underway for some time. Trucks as a share of new vehicle purchases has shifted from about one-in-two to almost four-in-five in the last fifteen years (chart 8). At best, periods of elevated gasoline prices may have temporarily slowed the shift with a lagged effect (chart 9). Peak gasoline prices in 2012 were followed by a pullback in relative truck sales in the following year, but lower cyclical peaks under the Trump years merely slowed the pace of the shift towards larger vehicles. Improving fuel efficiency over this time frame has also likely offset the impacts (chart 10).
Surveys suggest consumers in North America are increasingly considering EV purchases. Cox Automotive’ s Autotrader and Kelley Blue Book reported EV shopping consideration on their websites increased by 69% since January (in late-March), with the trend more pronounced among non-luxury vehicle shoppers. Closer to home, a KPMG survey recently reported that half of all respondents indicated their desire to buy an EV is greater today than it was a year ago. Similarly, a Leger poll put the Canadian interest in EVs at commensurate levels, while more than half reported driving less because of high fuel prices. (However, Google Mobility data shows no discernable difference in Canadian driving habits in recent weeks, even in more environmentally-conscious British Columbia.)
Fuel tax subsidies are unlikely to change the equation. Alberta announced in its recent budget a fuel tax reduction scheme pegged to the price of oil. At present prices, the government’s own estimated savings for Albertan drivers would be about 13.6 cents/litre. The current (March 29th) retail price in Alberta is $1.66/litre—up from $1.45/litre the month prior and $1.16 last year. British Columbia is offering a one-time rebate on auto insurance (about $110 per policy), while Ontario is permanently scrapping vehicle licence plate renewal fees (at $120 per year).
Canada’s plan to regulate EV sales mandates may turn up the pressure. In its recently tabled 2030 Emissions Reduction Plan, the federal government announced it intends to develop regulated mandates around the 100% EV sales target by 2035, along with interim targets of at least 20% by 2026 and 60% by 2030. (EV sales as a share of total sales were about 5% in 2021.) No doubt, these targets are calibrated on production plans but pricing factors will be a wild card.
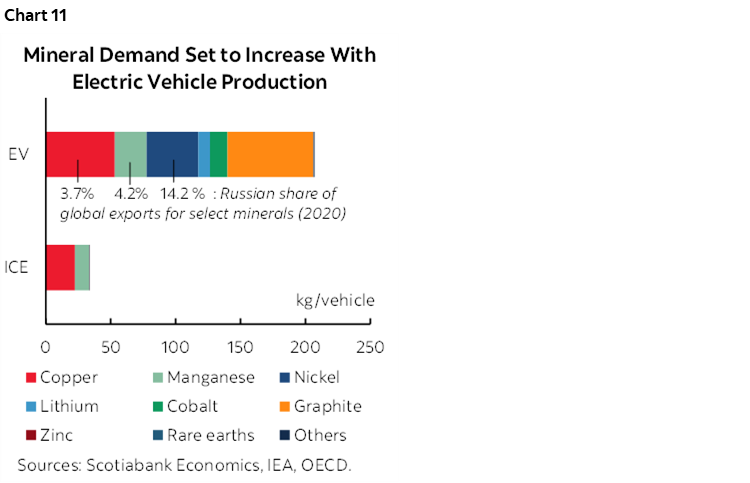
Price pressures for EV production will likely face more upside. Recent price mark-ups on new EVs in the US market have reportedly been in the order of 15–20%, owing to higher production costs. While battery technology advancements should bring costs down over the medium term, it is reasonable to expect further price pressures on materials. Prolonged Russian sanctions will likely take off-line a substantive share of global exports in critical minerals just as demand is expected to accelerate (chart 11). US President Biden is purportedly planning to shortly invoke the Defense Production Act to help increase the availability of critical minerals in the US.
Canada’s federal expansion of its EV rebate program will be all the more welcomed (and perhaps necessary). A “Buy North America” strategy south of the border is even more critical given its potential market depth. But if recent developments don’t broaden presidential horizons, it is unclear what will.
Box 1: Trends in Global Auto Sales
Global auto sales strengthened again in February by 4.0% m/m (sa) for a fifth consecutive month of growth. On an annualised basis, sales sat at 70.4 mn units in February, still slightly down from the 72 mn vehicle sales trending over the first half of 2021, but 1.0% (y/y, nsa) higher relative to the same month a year ago. The 2022 global sales recovery so far has been observed in all major markets, led by strong momentum in the Asia Pacific markets and a (fragile) pick-up in European sales.
North America was the only market that saw a decline in February, with sales falling by 4.6%, offsetting some of the gains in January. US auto sales contracted by -6.4% m/m, sa after a strong double-digit recovery in January, still 12% lower than the same month a year ago. Canadian auto sales strengthened by 6.8% in February according to Wards Automotive, while DesRosiers Automotive Consultants noted a decline, with sales still down 12.4% (y/y, nsa) from February 2021. Mexico also picked up with a third consecutive month of solid gain at 5.9% m/m (sa).
Asia Pacific continued to lead the recovery with a solid 5.9% m/m (sa) rebound in February, at 37.7 mn units saar, 16.7% higher than the same month a year ago. Chinese auto sales—representing over 60% of the Asia Pacific light vehicle market—have been at full steam and rose by another 6.7% m/m (sa) in February but recent COVID-19 outbreaks will likely slow sales activity ahead. Japanese auto sales contracted for a second consecutive month by -5% m/m (sa), still 18% (y/y, nsa) below the level a year ago. Indian auto sales continued the recovery from September’s dip with an impressive 9.5% m/m growth (sa) in February, sitting at the same level as in February 2021.
Western European auto sales recorded an 11.5% improvement in February, at 2.5% (y/y, nsa) below last February’s level. Signs of recovery are present in most major markets in the region, with the UK and Germany leading the pack. After some m/m volatility, German auto sales jumped by 16.8% m/m (sa) in February. UK auto sales posted a second consecutive m/m growth at 14.3% (sa). Spain and France both saw strong sales recoveries in February (32.8% m/m sa and 8.2% m/m sa, respectively). Italian auto sales also picked up modestly by 1.9% m/m (sa) in February, yet still 23% (y/y, nsa) lower relative to the same month a year ago. Before the geopolitical conflict rose in Eastern Europe, auto sales experienced strong growth in early 2022, with a 19.9% m/m (sa) jump in January, followed by a further 4.3% m/m (sa) increase in February. The war-related losses will likely start to be reflected in the March sales number.
South American sales also posted a positive m/m gain for in February at 8.8% (sa). The sales gains mostly came from the Brazilian market, which posted a 9.1% m/m (sa) gain in February. Argentina, Chile, and Peru also saw sales picking up by 16% m/m (sa), 9.1% and 6.8% m/m (sa), respectively. Overall, South American auto sales stood at -12.6% lower relative to the same month a year ago.
Box 2: Trends in Provincial Auto Sales
Despite divergence across sources on m/m movements, all sources point to a soft start to the year for Canadian auto sales. With the move to quarterly reporting by the industry, caution is warranted in reading too much into one month’s sales print. DesRosiers Automotive Consultants Inc. and Statistics Canada had both earlier reported national auto sales increases for January (+6% m/m, sa and +2.7% m/m, sa, respectively), both lower than estimated growth in December last year. Meanwhile, Wards’ data reported a -5.3% m/m decline for the same month. The difference in methodologies (i.e., StatsCan reporting on vehicle registrations versus the two other sources estimating OEM sales) could account for some of the variations as inventory shortages have increasingly led to pre-sales and longer vehicle delivery times (hence delayed registrations).
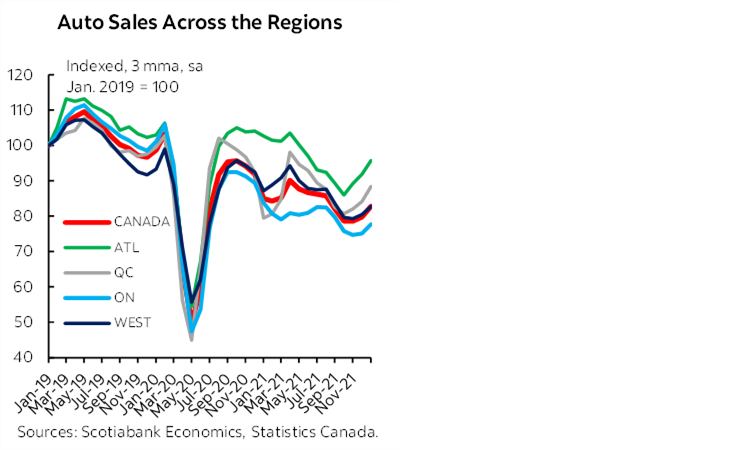
Lagging provincial auto sales data adds more colour to sales purchases at the regional level. After a lacklustre year of recovery in 2021, Ontario auto sales finally picked up some speed, leading January growth with a 6.1% m/m (sa) improvement in vehicle registrations. With robust economic fundamentals, Quebec’s auto sales are also holding strong, posting another positive m/m gain for a third consecutive month in January at 5.7% m/m (sa). Atlantic Canada’s auto sales recovery was less impacted by pandemic restrictions in 2021, and kept the momentum into 2022 with a 2.2% m/m (sa) growth in January. In the west, British Columbia and Alberta continue to strengthen with sales picking up further by 5.1% m/m (sa) and 3.6% m/m (sa), respectively. Manitoba saw the largest retrenchment in the month, down -11.8%, compounding the sales losses since last summer.
Auto sales numbers started to show a more normal regional distribution at the beginning of 2022, yet the general trends are still predominately affected by persistent supply challenges. The impact of recent geopolitical events will likely add pressure on production and pent-up demand, further masking the effects of more traditional economic drivers as the market continues to grapple with vehicle availability.
Quarterly Outlook for North American Auto Sector
DISCLAIMER
This report has been prepared by Scotiabank Economics as a resource for the clients of Scotiabank. Opinions, estimates and projections contained herein are our own as of the date hereof and are subject to change without notice. The information and opinions contained herein have been compiled or arrived at from sources believed reliable but no representation or warranty, express or implied, is made as to their accuracy or completeness. Neither Scotiabank nor any of its officers, directors, partners, employees or affiliates accepts any liability whatsoever for any direct or consequential loss arising from any use of this report or its contents.
These reports are provided to you for informational purposes only. This report is not, and is not constructed as, an offer to sell or solicitation of any offer to buy any financial instrument, nor shall this report be construed as an opinion as to whether you should enter into any swap or trading strategy involving a swap or any other transaction. The information contained in this report is not intended to be, and does not constitute, a recommendation of a swap or trading strategy involving a swap within the meaning of U.S. Commodity Futures Trading Commission Regulation 23.434 and Appendix A thereto. This material is not intended to be individually tailored to your needs or characteristics and should not be viewed as a “call to action” or suggestion that you enter into a swap or trading strategy involving a swap or any other transaction. Scotiabank may engage in transactions in a manner inconsistent with the views discussed this report and may have positions, or be in the process of acquiring or disposing of positions, referred to in this report.
Scotiabank, its affiliates and any of their respective officers, directors and employees may from time to time take positions in currencies, act as managers, co-managers or underwriters of a public offering or act as principals or agents, deal in, own or act as market makers or advisors, brokers or commercial and/or investment bankers in relation to securities or related derivatives. As a result of these actions, Scotiabank may receive remuneration. All Scotiabank products and services are subject to the terms of applicable agreements and local regulations. Officers, directors and employees of Scotiabank and its affiliates may serve as directors of corporations.
Any securities discussed in this report may not be suitable for all investors. Scotiabank recommends that investors independently evaluate any issuer and security discussed in this report, and consult with any advisors they deem necessary prior to making any investment.
This report and all information, opinions and conclusions contained in it are protected by copyright. This information may not be reproduced without the prior express written consent of Scotiabank.
™ Trademark of The Bank of Nova Scotia. Used under license, where applicable.
Scotiabank, together with “Global Banking and Markets”, is a marketing name for the global corporate and investment banking and capital markets businesses of The Bank of Nova Scotia and certain of its affiliates in the countries where they operate, including; Scotiabank Europe plc; Scotiabank (Ireland) Designated Activity Company; Scotiabank Inverlat S.A., Institución de Banca Múltiple, Grupo Financiero Scotiabank Inverlat, Scotia Inverlat Casa de Bolsa, S.A. de C.V., Grupo Financiero Scotiabank Inverlat, Scotia Inverlat Derivados S.A. de C.V. – all members of the Scotiabank group and authorized users of the Scotiabank mark. The Bank of Nova Scotia is incorporated in Canada with limited liability and is authorised and regulated by the Office of the Superintendent of Financial Institutions Canada. The Bank of Nova Scotia is authorized by the UK Prudential Regulation Authority and is subject to regulation by the UK Financial Conduct Authority and limited regulation by the UK Prudential Regulation Authority. Details about the extent of The Bank of Nova Scotia's regulation by the UK Prudential Regulation Authority are available from us on request. Scotiabank Europe plc is authorized by the UK Prudential Regulation Authority and regulated by the UK Financial Conduct Authority and the UK Prudential Regulation Authority.
Scotiabank Inverlat, S.A., Scotia Inverlat Casa de Bolsa, S.A. de C.V, Grupo Financiero Scotiabank Inverlat, and Scotia Inverlat Derivados, S.A. de C.V., are each authorized and regulated by the Mexican financial authorities.
Not all products and services are offered in all jurisdictions. Services described are available in jurisdictions where permitted by law.