CANADA: VEHICLE DEMAND SLOWS IN Q3-2024
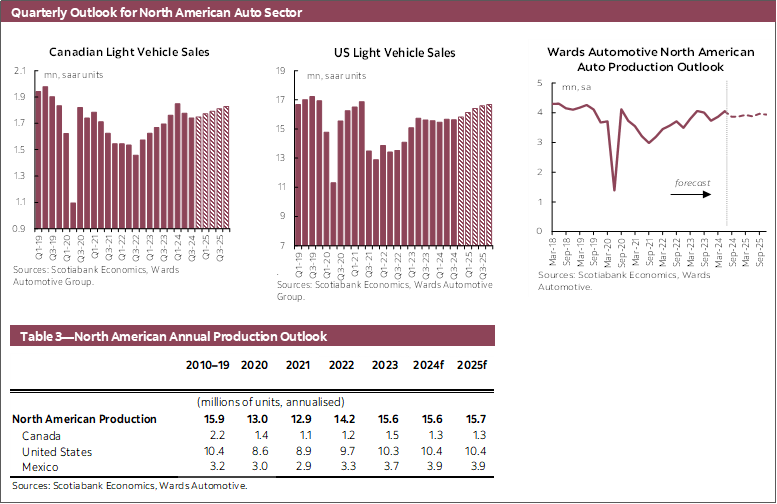
Canadian auto sales fell -1.3% month-over-month (m/m) to 1.72 mn units at a seasonally adjusted annualized rate (SAAR) in September, declining in four of the last five months according to Wards Automotive (chart 1).

While light vehicle sales through the first nine months of the year are up 7.1% year-to-date (ytd), momentum continues to slow in the second half of the year. Third quarter sales in seasonally adjusted terms averaged 1.74 mn (SAAR) units, down -2.0% from Q2-2024. Meanwhile, Q3 non-seasonally adjusted sales were up 2% compared to same quarter a year ago, however sales in September were down -2.7% y/y—contracting in year-over-year terms for the first time since December 2022. As the tightening effect from previous interest rate hikes continued to weigh on household consumption of goods into the summer, so too has it weighed on demand for automotives and new vehicle sales.
Annual headline inflation fell to 2% y/y in August, the mid-point of the Bank of Canada’s 1% to 3% target range, reinforcing calls for further cuts to the policy rate which has been lowered to 4.25% as of September from the recent peak of 5% at the beginning of June. Should inflation sustainably remain below the 3% upper threshold, we expect more cuts to the policy rate at the two remaining BoC policy rate meetings in 2024 and into mid-2025. It remains to be seen how quickly easing in monetary policy conditions will reduce affordability constraints and pass through to vehicle sales.
Our outlook for Canadian new light vehicle sales is 1.78 mn in 2024, and 1.8 mn in 2025 as interest rate headwinds ease.
UNITED STATES: SALES TRENDING SIDEWAYS DESPITE REVISIONS TO SEASONALITY
US auto sales increased 3.3% month-over-month to 15.8 mn (SAAR) units in September (chart 2). The seasonal adjustment factors for auto and light truck sales, which are produced by the Federal Reserve Board, were recalculated as far back as January 2019 and out through August 2025.

Despite the recalculated factors having reduced some of the volatility in seasonally adjusted data, the general trend remains the same with US light vehicle sales fluctuating around 15.7 mn (SAAR) units since the spring of 2023. Light vehicle sales were roughly unchanged in Q3, averaging 15.6 mn (SAAR) units, down -0.2% from Q2-2024.
While the sales rate is generally holding steady, growth in US light vehicle inventories is starting to show signs of slowing. US light vehicle production slowed to 10 mn (SAAR) units for the three months ending August, which is the lowest seasonally adjusted three month pace since February 2023 aside from October through December when production was impacted by the UAW strike.
The Federal Reserve cut the policy rate by 50 basis points to a 5% upper-bound at the September meeting, with the risks to the dual mandate of price stability and maximum sustainable employment coming better into balance. The unemployment rate had increased to 4.2% by August before falling back to 4.1% in September, adding uncertainty to the size and pace of expected future policy rate cuts. Interest rates will likely need to ease further in order to have a meaningful impact on vehicle demand.
Our outlook for US new light vehicle sales is 15.6 mn in 2024, and increasing to 16.5 mn in 2025 as interest rate headwinds ease.
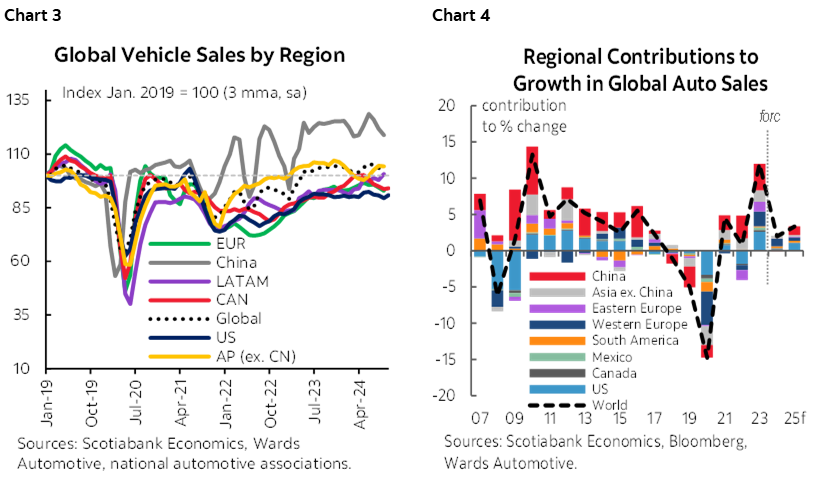
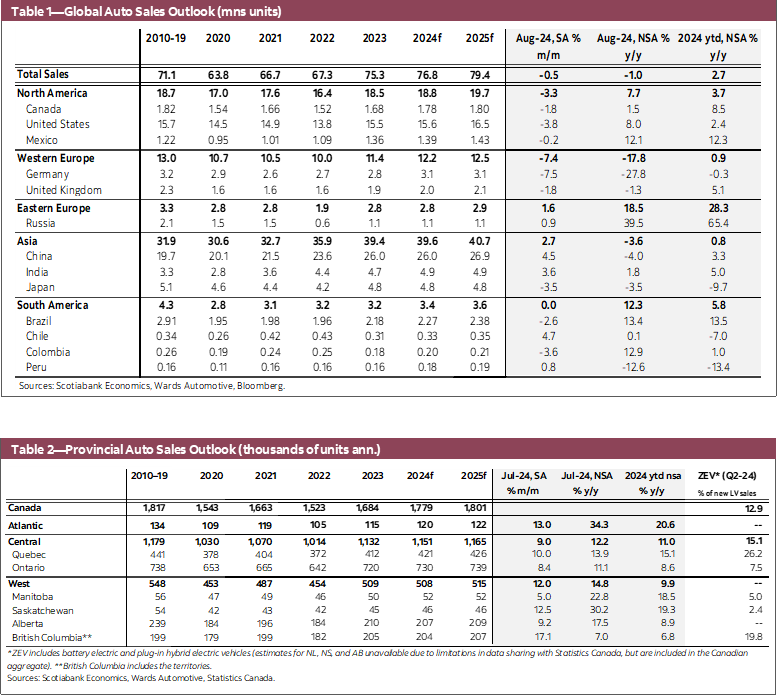
GLOBAL AUTO SALES: SALES RATE STEADY WITH SOME REGIONAL SOFTNESS
Global auto sales fell -0.5% m/m (SA) in August, as the sales rate holds relatively steady in seasonally adjusted terms since June (chart 3). Western European auto sales fell -7.4% m/m, declining in 11 of the 15 countries covered, continuing a downward trend since Q1-2024 and to the lowest seasonally adjusted level since October 2022. Meanwhile eastern European auto sales increased 1.6% m/m (SA). Asia Pacific auto sales rebounded 2.7% m/m (SA) after having declined the two months prior, as growth in China (4.5%), India (3.6%), and South Korea (4.2%) more than offset declines in the three remaining markets covered. Auto sales in Latin America held steady in August (0% m/m, SA), as the sales rate was relatively unchanged in Mexico (-0.2%) and Peru (0.8%), and higher sales in Argentina (13.5%) and Chile (4.7%) were offset by lower sales in Brazil (-2.6%) and Colombia (-3.6%). Our outlook for global vehicle sales is 2.0% in 2024 and 3.3% in 2025 (chart 4).
DISCLAIMER
This report has been prepared by Scotiabank Economics as a resource for the clients of Scotiabank. Opinions, estimates and projections contained herein are our own as of the date hereof and are subject to change without notice. The information and opinions contained herein have been compiled or arrived at from sources believed reliable but no representation or warranty, express or implied, is made as to their accuracy or completeness. Neither Scotiabank nor any of its officers, directors, partners, employees or affiliates accepts any liability whatsoever for any direct or consequential loss arising from any use of this report or its contents.
These reports are provided to you for informational purposes only. This report is not, and is not constructed as, an offer to sell or solicitation of any offer to buy any financial instrument, nor shall this report be construed as an opinion as to whether you should enter into any swap or trading strategy involving a swap or any other transaction. The information contained in this report is not intended to be, and does not constitute, a recommendation of a swap or trading strategy involving a swap within the meaning of U.S. Commodity Futures Trading Commission Regulation 23.434 and Appendix A thereto. This material is not intended to be individually tailored to your needs or characteristics and should not be viewed as a “call to action” or suggestion that you enter into a swap or trading strategy involving a swap or any other transaction. Scotiabank may engage in transactions in a manner inconsistent with the views discussed this report and may have positions, or be in the process of acquiring or disposing of positions, referred to in this report.
Scotiabank, its affiliates and any of their respective officers, directors and employees may from time to time take positions in currencies, act as managers, co-managers or underwriters of a public offering or act as principals or agents, deal in, own or act as market makers or advisors, brokers or commercial and/or investment bankers in relation to securities or related derivatives. As a result of these actions, Scotiabank may receive remuneration. All Scotiabank products and services are subject to the terms of applicable agreements and local regulations. Officers, directors and employees of Scotiabank and its affiliates may serve as directors of corporations.
Any securities discussed in this report may not be suitable for all investors. Scotiabank recommends that investors independently evaluate any issuer and security discussed in this report, and consult with any advisors they deem necessary prior to making any investment.
This report and all information, opinions and conclusions contained in it are protected by copyright. This information may not be reproduced without the prior express written consent of Scotiabank.
™ Trademark of The Bank of Nova Scotia. Used under license, where applicable.
Scotiabank, together with “Global Banking and Markets”, is a marketing name for the global corporate and investment banking and capital markets businesses of The Bank of Nova Scotia and certain of its affiliates in the countries where they operate, including; Scotiabank Europe plc; Scotiabank (Ireland) Designated Activity Company; Scotiabank Inverlat S.A., Institución de Banca Múltiple, Grupo Financiero Scotiabank Inverlat, Scotia Inverlat Casa de Bolsa, S.A. de C.V., Grupo Financiero Scotiabank Inverlat, Scotia Inverlat Derivados S.A. de C.V. – all members of the Scotiabank group and authorized users of the Scotiabank mark. The Bank of Nova Scotia is incorporated in Canada with limited liability and is authorised and regulated by the Office of the Superintendent of Financial Institutions Canada. The Bank of Nova Scotia is authorized by the UK Prudential Regulation Authority and is subject to regulation by the UK Financial Conduct Authority and limited regulation by the UK Prudential Regulation Authority. Details about the extent of The Bank of Nova Scotia's regulation by the UK Prudential Regulation Authority are available from us on request. Scotiabank Europe plc is authorized by the UK Prudential Regulation Authority and regulated by the UK Financial Conduct Authority and the UK Prudential Regulation Authority.
Scotiabank Inverlat, S.A., Scotia Inverlat Casa de Bolsa, S.A. de C.V, Grupo Financiero Scotiabank Inverlat, and Scotia Inverlat Derivados, S.A. de C.V., are each authorized and regulated by the Mexican financial authorities.
Not all products and services are offered in all jurisdictions. Services described are available in jurisdictions where permitted by law.