CANADA: MOMENTUM FALTERING THROUGH THE SUMMER
Canadian auto sales were up marginally by 0.9% m/m (sa) in August, to 1.59 mn (saar) units, below 1.6 mn for the second consecutive month this year. Momentum in vehicle sales has slowed throughout the summer, with the three month moving average (3mma) falling to 1.59 mn (saar), down from the recent peak of 1.69 mn reached in May, though remains above the low of 1.44 mn from fall 2022. Rising vehicle prices, elevated financing rates, and still low inventory levels are likely weighing on pent-up demand. Labour market data has shown the pace of new jobs added has slowed in recent months relative to late 2022. Nevertheless, average hourly wage gains in July and August were above 10% m/m (saar) for permanent employees 15 years & over, outpacing monthly core inflation which was 4.2% m/m (saar) in July. Strong wage gains along with increased total hours worked provides support to domestic demand. At the Bank of Canada’s policy rate meeting September 6th, the BoC held the Overnight rate unchanged at 5.00%, though stated that they are prepared to increase the policy rate further if needed to achieve their 2% inflation target. With the BoC unlikely to cut the policy rate until some time in 2024, financing rates are expected to remain elevated in the near term. Our outlook for Canadian vehicle sales is revised down to 1.64 mn in 2023 owing to slowing momentum in vehicle sales amid rising prices, elevated financing rates, and weak sentiment. We are then forecasting auto sales to pick up to 1.72 mn in 2024 as headwinds ease, underpinned by pent up demand against an aging vehicle stock and population growth.
UNITED STATES: OUTLOOK CLOUDED BY UNCERTAINTY TOWARDS SUPPLY
US auto sales fell 4.5% m/m (sa) in July, to 15.0 mn (saar) units, but held steady on a three month moving average (3mma) basis at 15.5 mn (saar). Auto sales have improved from the recent troughs of late-2021 and mid-2022, when sales were as low as 12.9 mn and 13.0 mn (saar, 3mma) which was the result of production and supply constraints, however progress returning towards the pre-pandemic pace of 17 mn (saar) light vehicle sales has stalled this summer. The average 48-month new car loan rate was 7.31% in August, posting the first month-over-month decline since January 2022, up nearly 4 percentage points over that time frame. Throughout the past year and a half, the Federal Reserve has raised the upper bound of their policy rate to 5.50% in effort to bring inflation back down towards their 2% target. As cuts to the Fed’s policy rate are not expected until some time in 2024, on top of facing upside risk to inflation, financing rates will likely remain elevated for some time. Supply-side pressures continue to ease as North American light vehicle production was 16.4 mn (saar) in July, the fourth consecutive month at or above the 2019 average of 16.2 mn vehicles manufactured. While inventories are being built up from their low levels, new vehicles continue to be absorbed by pent up demand. Ongoing negotiations between the United Auto Workers (UAW) union and the Detroit Three (GM, Ford, and Stellantis) pose a risk to production disruptions, as UAW members have voted to strike if no new deal is reached before the existing one expires on September 14th. A halt to production while inventory levels are still low will further exacerbate the supply-demand imbalance and will likely add upward pressure to vehicle prices. In an environment of elevated financing rates, additional inflation to vehicle prices poses further headwinds to vehicle affordability and therefore vehicle sales. Our outlook for US vehicle sales is 15.4 mn in 2023, underpinned by improving vehicle availability which faces uncertainty, and picks up to 16.5 mn in 2024 as inflation and rates pressures ease.
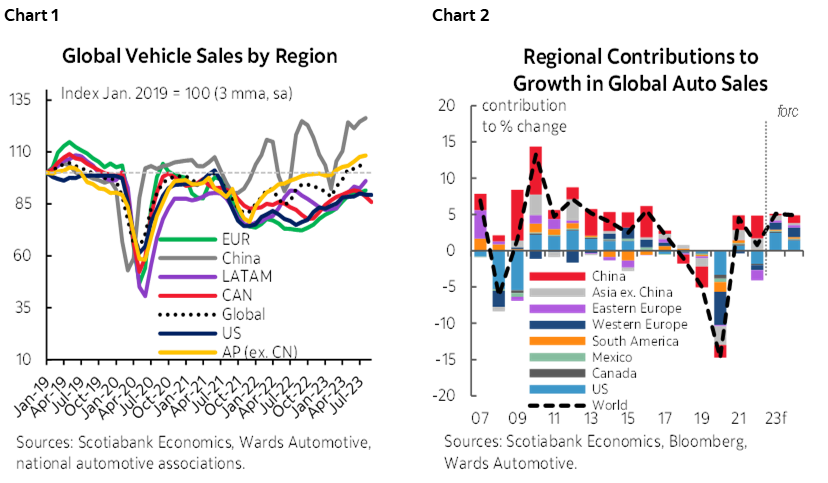
GLOBAL AUTO SALES: AP AND EURO SALES SLOW, LATAM CONTINUES TO GROW
The pace of global auto sales continued to slow into the second half of the year, down 0.9% m/m (sa) in July, for a second consecutive seasonally adjusted monthly contraction (chart 1). Global figures were largely weighed down by lower sales in the Asia Pacific region which contracted for a second month, down 2.8% (sa). July’s lower sales were broad, contracting in 4 of the 6 countries covered. In China, the region’s largest market, sales fell continued to slow (-3.2%, sa). The People’s Bank of China (PBoC) cut their policy rates along with local regulators easing lending requirements in efforts to stimulate economic activity. Slowing auto sales in Indonesia (-2.9%, sa), Japan (-7.2%), and South Korea (-8.5%) were partially offset by further growth in Australia (3.3%) and volatile improve in India’s auto sales (4.2%). Auto sales also continued to slow in Western Europe (-1.4%, sa), only increasing in France (4.5%, sa), Italy (1.0%), and the UK (6.9%), and contracting in Germany (-4.3%) among other European countries. The European Central Bank (ECB) and Bank of England both hiked their policy rates another 25bps in their July and August meetings respectively amid further efforts to tame inflation. Latam auto sales grew for the third consecutive month at the regional level (4.3%, sa), albeit with improving sales from Brazil (12.4%), Mexico (2.4%), and Peru (0.9%) being weighed down by sales in Argentina (-12.8%), Chile (-6.7%), and Colombia (-14.8%). With inflation coming down from recent highs in the region, Latam central banks have begun to consider how much longer to hold the policy rates, with both Chile and Brazil’s central banks starting to cut their policy rates. Our outlook for global auto sales forecasts vehicle sales increasing 5.1% in 2023 and 4.9% in 2024 (chart 2).


DISCLAIMER
This report has been prepared by Scotiabank Economics as a resource for the clients of Scotiabank. Opinions, estimates and projections contained herein are our own as of the date hereof and are subject to change without notice. The information and opinions contained herein have been compiled or arrived at from sources believed reliable but no representation or warranty, express or implied, is made as to their accuracy or completeness. Neither Scotiabank nor any of its officers, directors, partners, employees or affiliates accepts any liability whatsoever for any direct or consequential loss arising from any use of this report or its contents.
These reports are provided to you for informational purposes only. This report is not, and is not constructed as, an offer to sell or solicitation of any offer to buy any financial instrument, nor shall this report be construed as an opinion as to whether you should enter into any swap or trading strategy involving a swap or any other transaction. The information contained in this report is not intended to be, and does not constitute, a recommendation of a swap or trading strategy involving a swap within the meaning of U.S. Commodity Futures Trading Commission Regulation 23.434 and Appendix A thereto. This material is not intended to be individually tailored to your needs or characteristics and should not be viewed as a “call to action” or suggestion that you enter into a swap or trading strategy involving a swap or any other transaction. Scotiabank may engage in transactions in a manner inconsistent with the views discussed this report and may have positions, or be in the process of acquiring or disposing of positions, referred to in this report.
Scotiabank, its affiliates and any of their respective officers, directors and employees may from time to time take positions in currencies, act as managers, co-managers or underwriters of a public offering or act as principals or agents, deal in, own or act as market makers or advisors, brokers or commercial and/or investment bankers in relation to securities or related derivatives. As a result of these actions, Scotiabank may receive remuneration. All Scotiabank products and services are subject to the terms of applicable agreements and local regulations. Officers, directors and employees of Scotiabank and its affiliates may serve as directors of corporations.
Any securities discussed in this report may not be suitable for all investors. Scotiabank recommends that investors independently evaluate any issuer and security discussed in this report, and consult with any advisors they deem necessary prior to making any investment.
This report and all information, opinions and conclusions contained in it are protected by copyright. This information may not be reproduced without the prior express written consent of Scotiabank.
™ Trademark of The Bank of Nova Scotia. Used under license, where applicable.
Scotiabank, together with “Global Banking and Markets”, is a marketing name for the global corporate and investment banking and capital markets businesses of The Bank of Nova Scotia and certain of its affiliates in the countries where they operate, including; Scotiabank Europe plc; Scotiabank (Ireland) Designated Activity Company; Scotiabank Inverlat S.A., Institución de Banca Múltiple, Grupo Financiero Scotiabank Inverlat, Scotia Inverlat Casa de Bolsa, S.A. de C.V., Grupo Financiero Scotiabank Inverlat, Scotia Inverlat Derivados S.A. de C.V. – all members of the Scotiabank group and authorized users of the Scotiabank mark. The Bank of Nova Scotia is incorporated in Canada with limited liability and is authorised and regulated by the Office of the Superintendent of Financial Institutions Canada. The Bank of Nova Scotia is authorized by the UK Prudential Regulation Authority and is subject to regulation by the UK Financial Conduct Authority and limited regulation by the UK Prudential Regulation Authority. Details about the extent of The Bank of Nova Scotia's regulation by the UK Prudential Regulation Authority are available from us on request. Scotiabank Europe plc is authorized by the UK Prudential Regulation Authority and regulated by the UK Financial Conduct Authority and the UK Prudential Regulation Authority.
Scotiabank Inverlat, S.A., Scotia Inverlat Casa de Bolsa, S.A. de C.V, Grupo Financiero Scotiabank Inverlat, and Scotia Inverlat Derivados, S.A. de C.V., are each authorized and regulated by the Mexican financial authorities.
Not all products and services are offered in all jurisdictions. Services described are available in jurisdictions where permitted by law.