- BoC’s preferred core inflation measures softened…
- ...against a still-hot trend
- The end of the GST/HST cut lifted CPI…
- ...but this was offset by possibly tighter margins, and weaker travel prices
- The BoC’s move tomorrow is unlikely to over react to one print…
- … as the focus remains on forward-looking risks to inflation
- Canada CPI m/m %, March, NSA:
- Actual: 0.3 / 2.3
- Scotia: 0.7 / 2.7
- Consensus: 0.7 / 2.7
- Prior: 1.1/ 2.6
- Core inflation, March, m/m % SAAR:
- Trimmed mean CPI: 1.7
- Weighted median CPI: 1.7
Canadian core inflation slowed in March. For a change, that is. I don’t think the reading will impact the BoC’s stance tomorrow for reasons offered below. Markets kind of leaned that way as well with pricing for the decision little changed and at just over a one-in-three chance of a cut. I argued both cases for a cut and a hold in my Global Week Ahead and we ever so slightly lean to a hold.
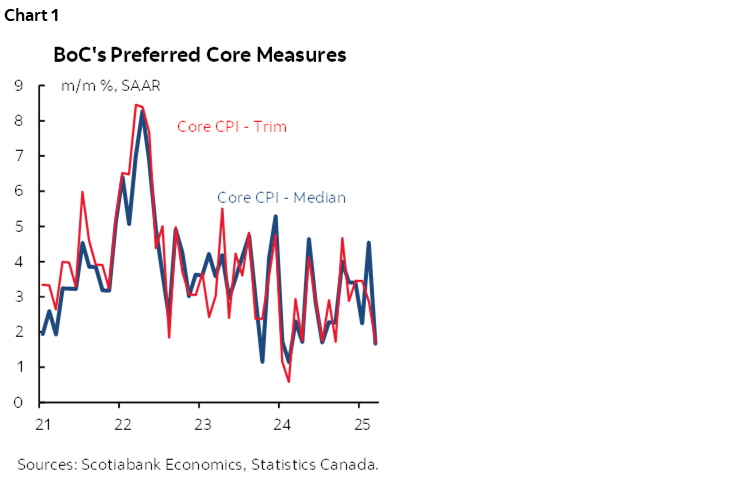
Key is that the BoC’s two preferred measures of core inflation slowed to 1.7% m/m at a seasonally adjusted and annualized pace (SAAR). Chart 1. Traditional core CPI (ie: ex-food and energy) fell by -0.8% m/m SAAR.
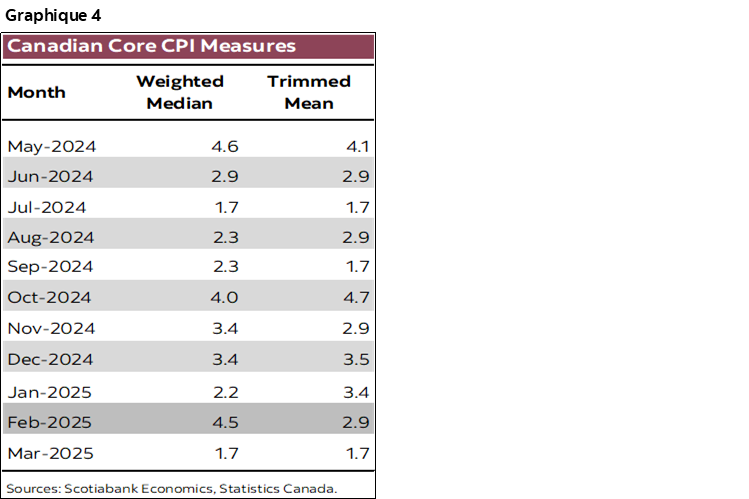
That’s the main reason why headline fell shy of everyone’s expectations at 0.3% m/m NSA. The effects of the end of the GST/HST cut worked as expected by lifting CPI by 0.4% m/m NSA as shown by the spread between CPI and CPI excluding the effects of changes in indirect taxes (chart 2). But this was an unusually light month of March for seasonally unadjusted CPI (chart 3).
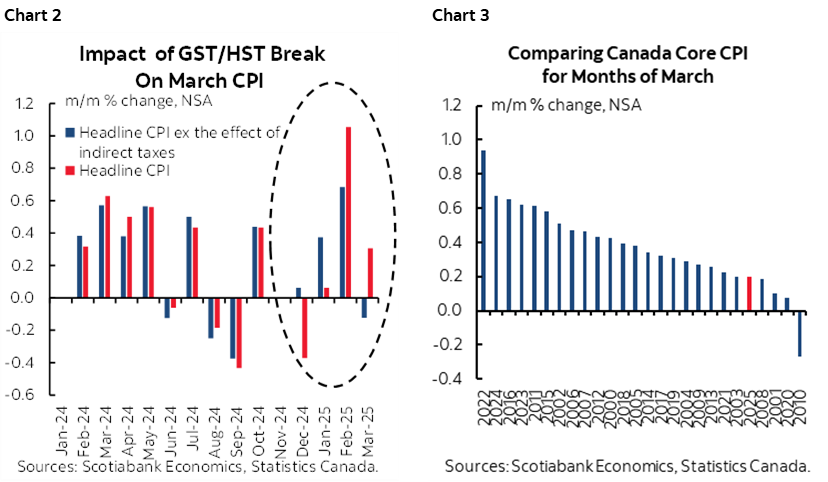
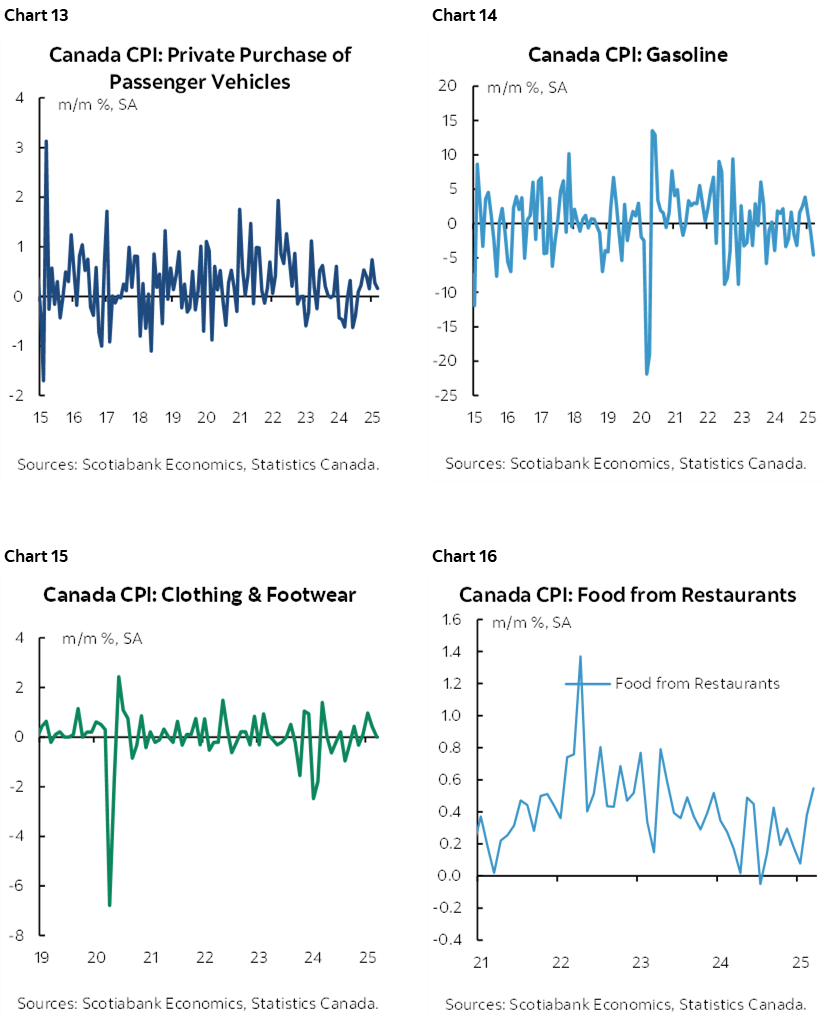
Why? Well, that’s inherently speculative, but I think what may have happened is that retailers swung from crowding in some of the space vacated by the GST/HST cut when prices firmed excluding tax cut effects, to reducing margins when the tax hike kicked in last month. That may have been part of why clothing and footwear prices were flat in seasonally adjusted terms, but restaurant prices continued to rise.
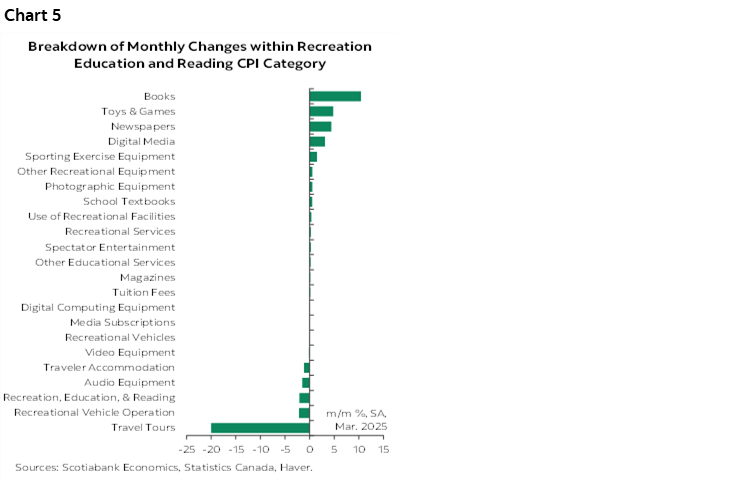
Ergo, we should look at trends. Enter chart 4. The BoC’s preferred core readings have been rather warm throughout the past year with last month being a rare exception. It would be laughable if the BoC seized on one report.
Another big reason for fading this is that the first round effects of trade wars was disinflationary as Canadians aborted travel plans particularly to the US. That’s why the 10% weight on the recreation, reading and education category and its –2.1% m/m SA drop shaved about 0.2ppts off of total SA CPI. Chart 5 shows why; travel tour prices plunged by about 20% as Canadians boycotted travel due to a weak currency and as a protest against the Trump administration’s slanderous treatment of Canada.
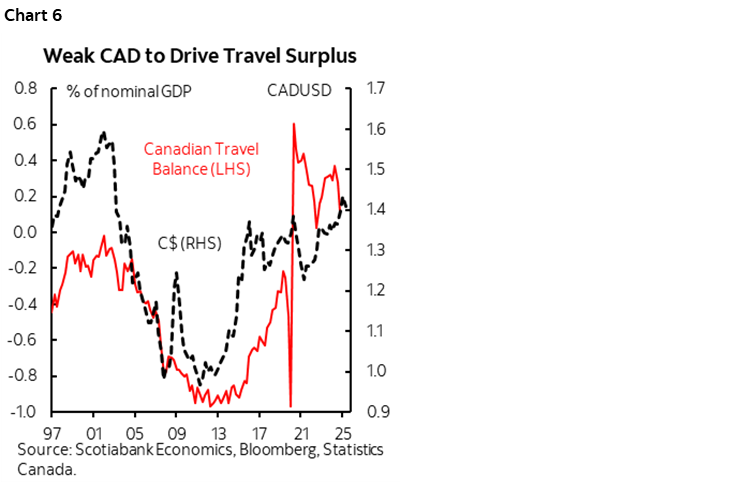
Expect more of this going forward. Chart 6 shows the tight correlation between the two-way travel spending balance and USDCAD movements over time. Canada was running a travel spending deficit of about 1% of nominal GDP about a decade ago (ie: spending more abroad than foreigners were spending in Canada) but this has since swung to a surplus of about 0.2% at the end of 2024 and with probably a bigger surplus when we get Q1 numbers.
And yet going forward, the BoC will be more concerned about trade war effects that could add to inflation risk such as tariffs on imports and supply chain effects relative to how trade wars create more disinflationary spare capacity. That uncertainty will continue to dominate the narrative.
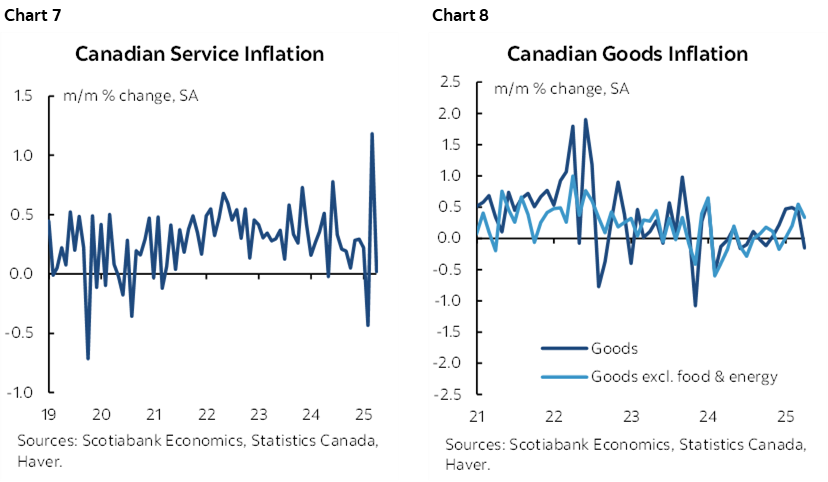
Across other details, note the wild volatility in services inflation (chart 7) and the firm price inflation for goods ex-food and energy (chart 8). These categories include tax changes.
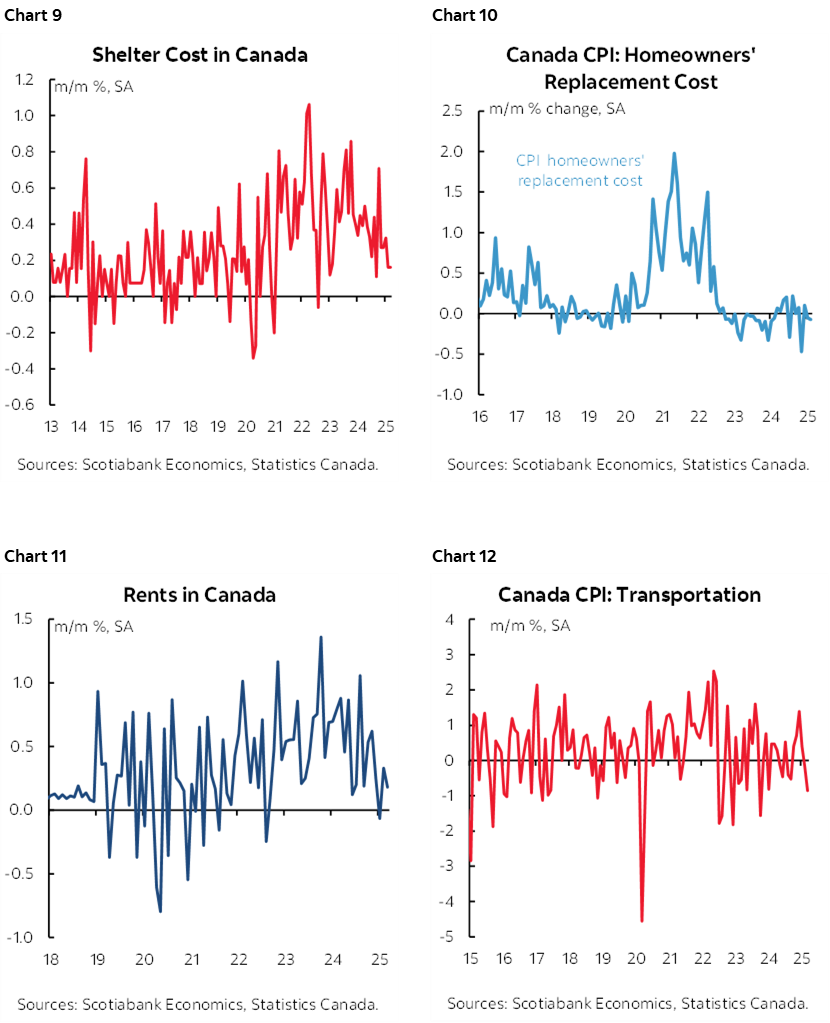
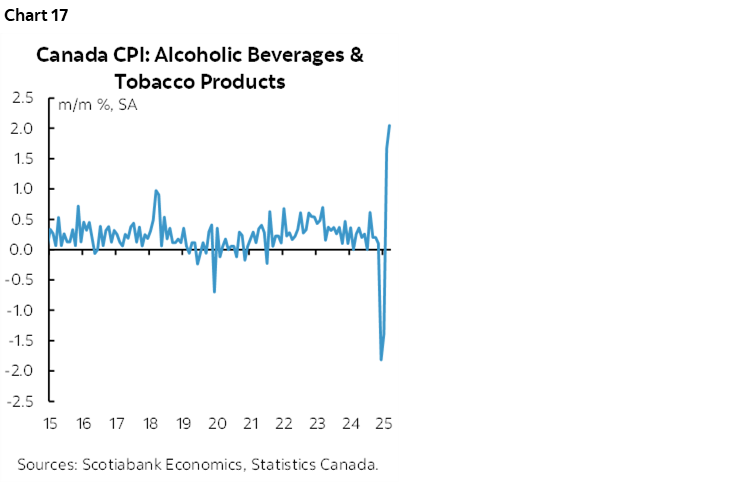
Please see charts 9–17 for other components.
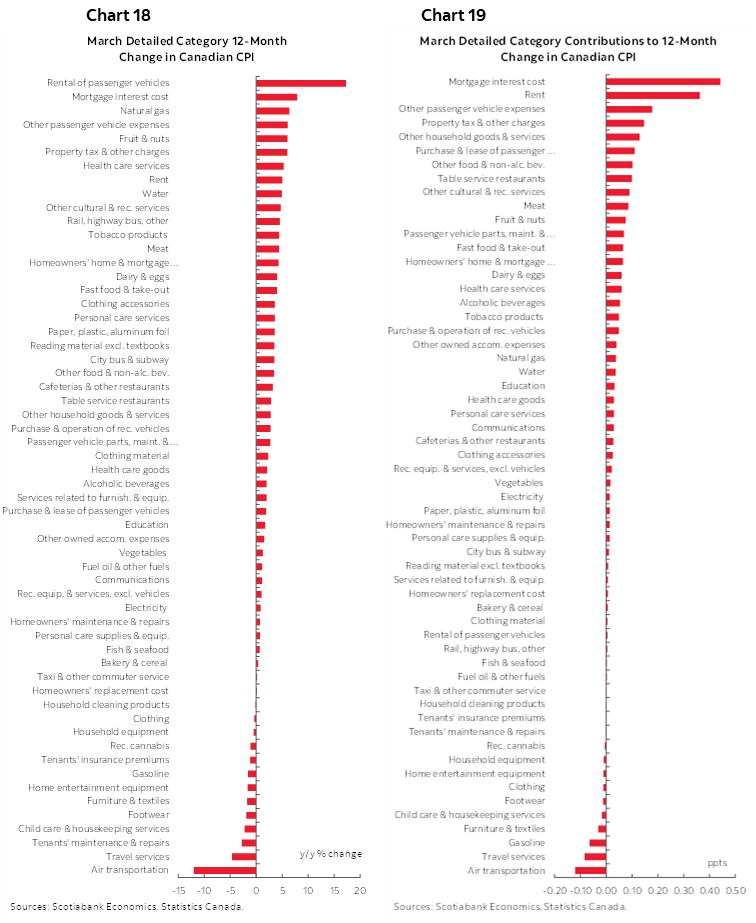
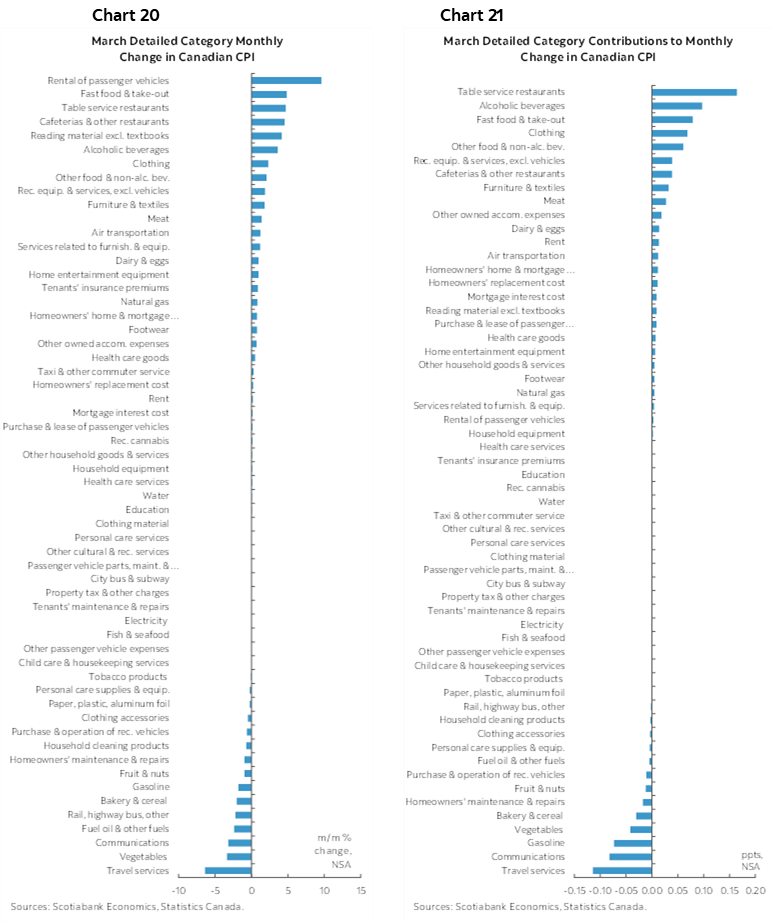
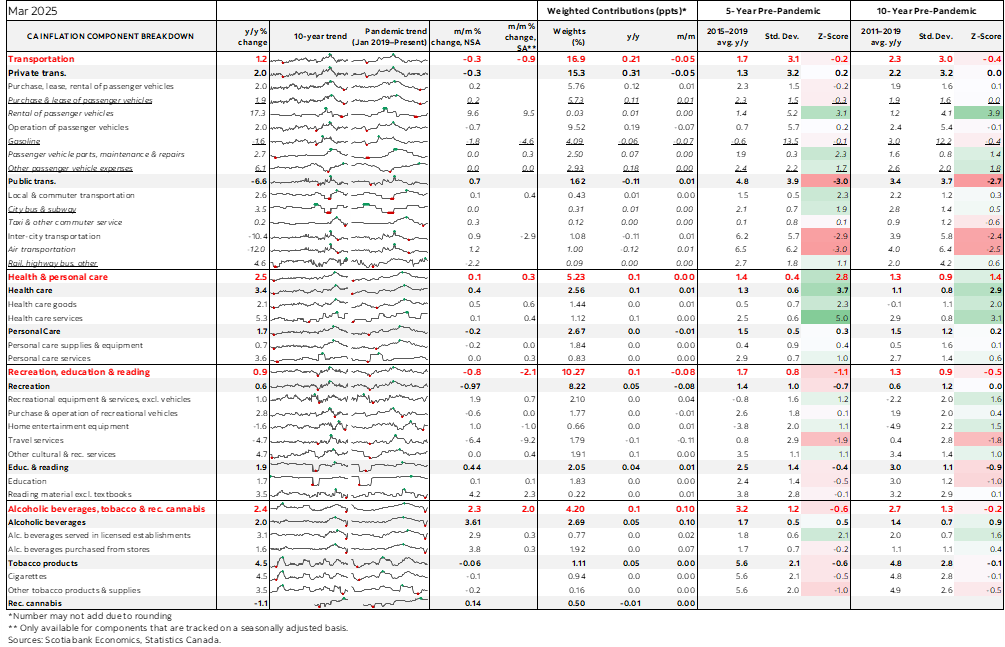
Charts 18–19 break down the CPI basket in y/y terms and in weighted contributions to the y/y change in CPI by component. Charts 20–21 do likewise for month-over-month prices.
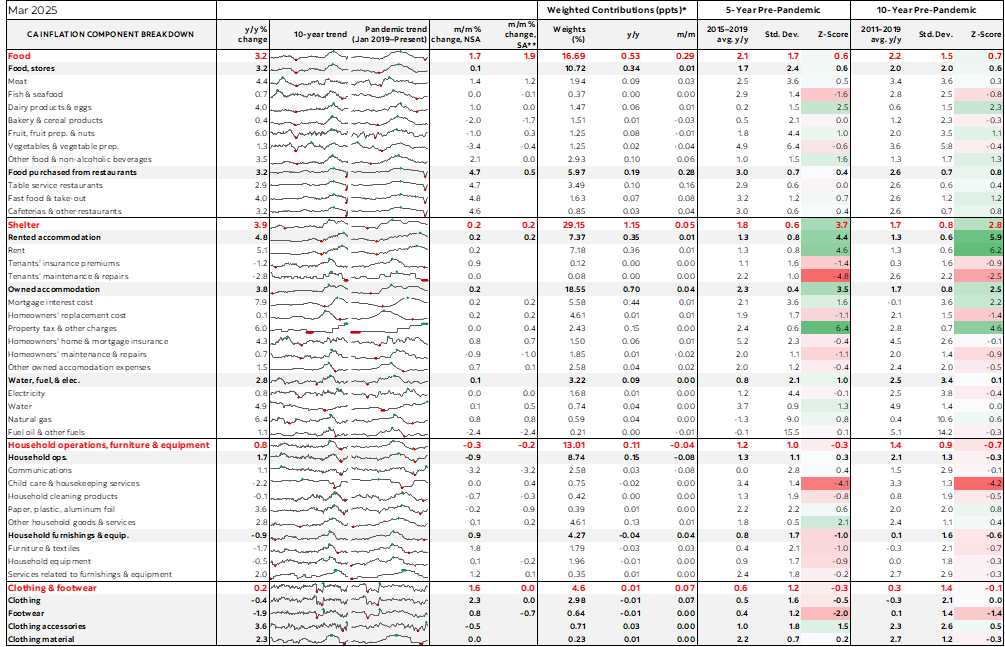
Lastly, the accompanying table provides more details and micro charts.
DISCLAIMER
This report has been prepared by Scotiabank Economics as a resource for the clients of Scotiabank. Opinions, estimates and projections contained herein are our own as of the date hereof and are subject to change without notice. The information and opinions contained herein have been compiled or arrived at from sources believed reliable but no representation or warranty, express or implied, is made as to their accuracy or completeness. Neither Scotiabank nor any of its officers, directors, partners, employees or affiliates accepts any liability whatsoever for any direct or consequential loss arising from any use of this report or its contents.
These reports are provided to you for informational purposes only. This report is not, and is not constructed as, an offer to sell or solicitation of any offer to buy any financial instrument, nor shall this report be construed as an opinion as to whether you should enter into any swap or trading strategy involving a swap or any other transaction. The information contained in this report is not intended to be, and does not constitute, a recommendation of a swap or trading strategy involving a swap within the meaning of U.S. Commodity Futures Trading Commission Regulation 23.434 and Appendix A thereto. This material is not intended to be individually tailored to your needs or characteristics and should not be viewed as a “call to action” or suggestion that you enter into a swap or trading strategy involving a swap or any other transaction. Scotiabank may engage in transactions in a manner inconsistent with the views discussed this report and may have positions, or be in the process of acquiring or disposing of positions, referred to in this report.
Scotiabank, its affiliates and any of their respective officers, directors and employees may from time to time take positions in currencies, act as managers, co-managers or underwriters of a public offering or act as principals or agents, deal in, own or act as market makers or advisors, brokers or commercial and/or investment bankers in relation to securities or related derivatives. As a result of these actions, Scotiabank may receive remuneration. All Scotiabank products and services are subject to the terms of applicable agreements and local regulations. Officers, directors and employees of Scotiabank and its affiliates may serve as directors of corporations.
Any securities discussed in this report may not be suitable for all investors. Scotiabank recommends that investors independently evaluate any issuer and security discussed in this report, and consult with any advisors they deem necessary prior to making any investment.
This report and all information, opinions and conclusions contained in it are protected by copyright. This information may not be reproduced without the prior express written consent of Scotiabank.
™ Trademark of The Bank of Nova Scotia. Used under license, where applicable.
Scotiabank, together with “Global Banking and Markets”, is a marketing name for the global corporate and investment banking and capital markets businesses of The Bank of Nova Scotia and certain of its affiliates in the countries where they operate, including; Scotiabank Europe plc; Scotiabank (Ireland) Designated Activity Company; Scotiabank Inverlat S.A., Institución de Banca Múltiple, Grupo Financiero Scotiabank Inverlat, Scotia Inverlat Casa de Bolsa, S.A. de C.V., Grupo Financiero Scotiabank Inverlat, Scotia Inverlat Derivados S.A. de C.V. – all members of the Scotiabank group and authorized users of the Scotiabank mark. The Bank of Nova Scotia is incorporated in Canada with limited liability and is authorised and regulated by the Office of the Superintendent of Financial Institutions Canada. The Bank of Nova Scotia is authorized by the UK Prudential Regulation Authority and is subject to regulation by the UK Financial Conduct Authority and limited regulation by the UK Prudential Regulation Authority. Details about the extent of The Bank of Nova Scotia's regulation by the UK Prudential Regulation Authority are available from us on request. Scotiabank Europe plc is authorized by the UK Prudential Regulation Authority and regulated by the UK Financial Conduct Authority and the UK Prudential Regulation Authority.
Scotiabank Inverlat, S.A., Scotia Inverlat Casa de Bolsa, S.A. de C.V, Grupo Financiero Scotiabank Inverlat, and Scotia Inverlat Derivados, S.A. de C.V., are each authorized and regulated by the Mexican financial authorities.
Not all products and services are offered in all jurisdictions. Services described are available in jurisdictions where permitted by law.