- The BoC’s preferred core gauges fell back to one-handled m/m annualized gains
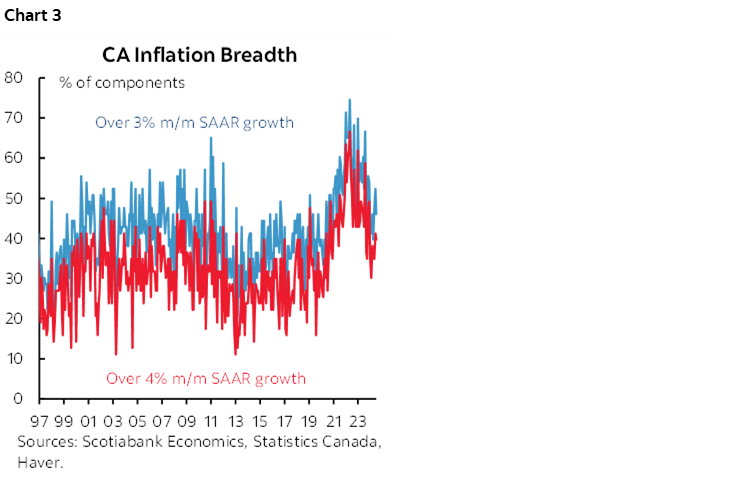
- Breadth of price pressures remains significant
- The assumed bounce back in recreation prices didn’t happen…
- ...as steep travel discounting weighed on the category
- Rail strikes and methodological changes to cellular services lie ahead
- Markets barely reacted to a largely priced outcome
- Canadian CPI m/m // y/y %, NSA, July:
- Actual: 0.4 / 2.5
- Scotia: 0.5 / 2.6
- Consensus: 0.4 / 2.5
- Prior: -0.1 / 2.7
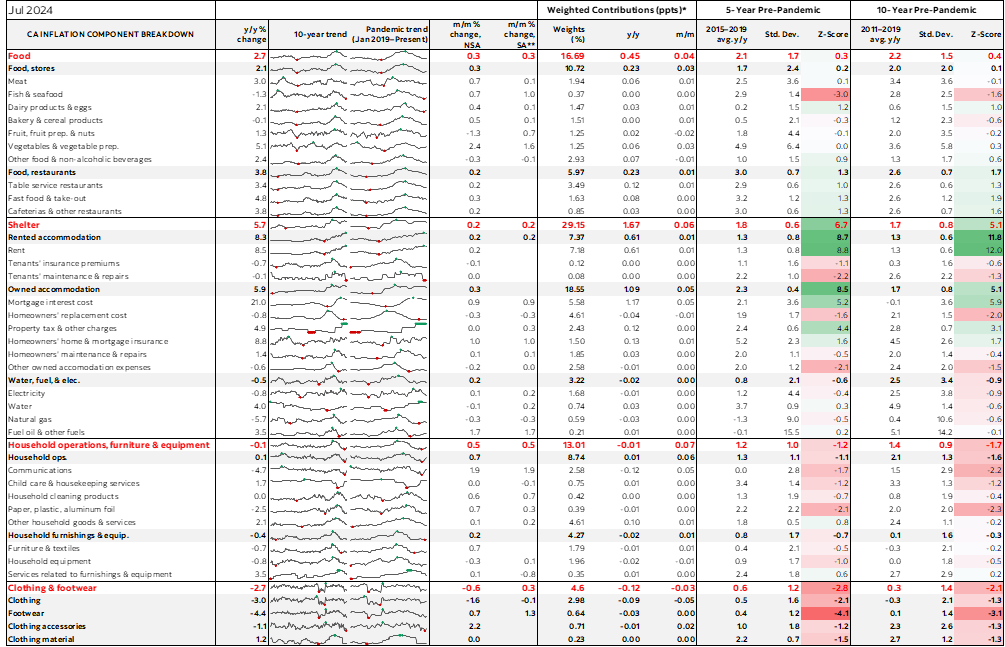
- Trimmed mean CPI: 2.7% y/y (2.8% prior revised from 2.9%); m/m SAAR 1.7% (2.9% prior)
- Weighted median CPI: 2.4% y/y (2.6% prior); 1.1% m/m SAAR (3.5% prior revised from 2.9%)
Canadian core inflation ebbed in July using the proper measure calculated as the month-over-month percentage changes in seasonally adjusted trimmed mean and weighted median CPI at an annualized rate (chart 1). They landed at 1.1% m/m SAAR for weighted median and 1.7% for trimmed mean. Traditional core CPI ex-food and energy was also soft but a touch firmer at 2.4% m/m SAAR (chart 2).
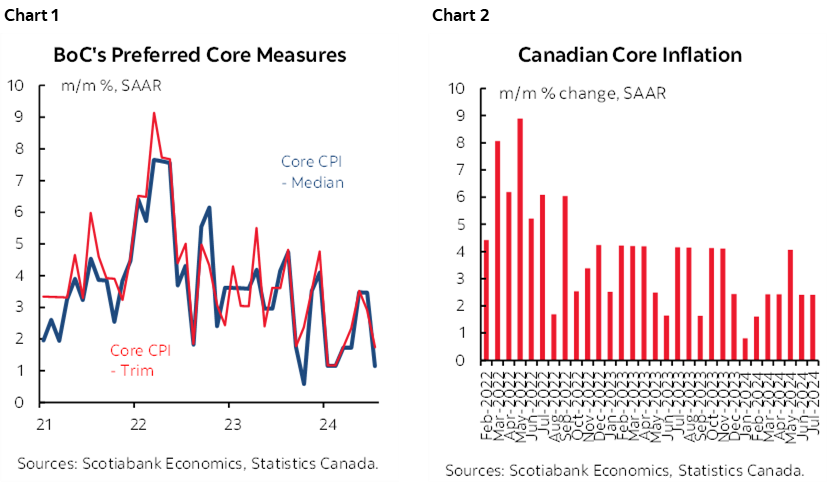
The figures are volatile. Both of the BoC’s preferred core readings were soft from January through to April before they accelerated to revised averages of 3.5% in May and 3.2% in June. Falling back to an average of 1.4% in July is welcome relief but continues to merit caution along a volatile path.
There was no market effect on September rate cut expectations or the market’s view that 75bps of cuts will be delivered over the three meetings in September, October and December. Our forecast is for two more cuts this year including September, ending the year at 4%. We tentatively assume a skip in December partly based on uncertainty in the aftermath of the US election, domestic data uncertainty, and the potential contents of a Fall fiscal update into an election year.
Details
Headline CPI m/m SA was 0.3%, meaning that most of the 0.4% m/m seasonally unadjusted rise in prices was seasonally unusual.
Breadth is shown in chart 3. While off from the peaks, a still considerable portion of the basket is showing price gains over 3% m/m SAAR and over 4% m/m SAAR.
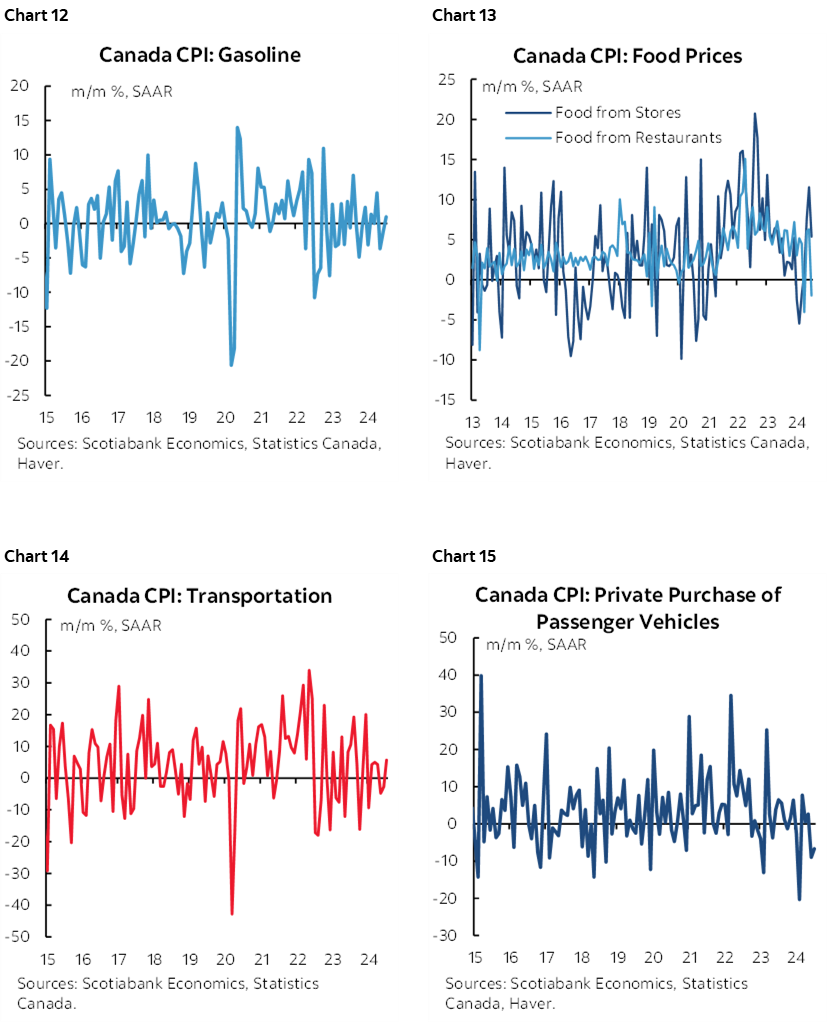
Transportation prices including vehicles and gas were up 0.5% m/m SA. Household ops/furnishings were up 0.5%. Food was up 0.3%. Clothing increased by 0.3%.
There was a mild pick-up in goods inflation but it was small effect (chart 4), and this was offset by less services inflation (chart 5).
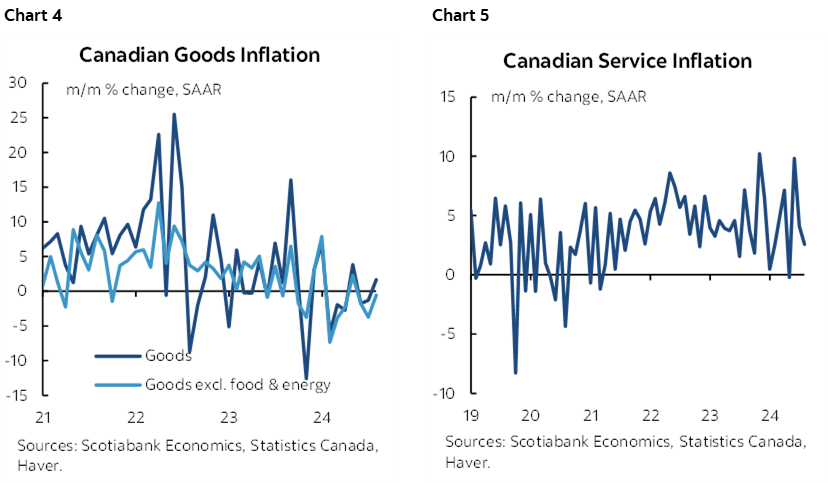
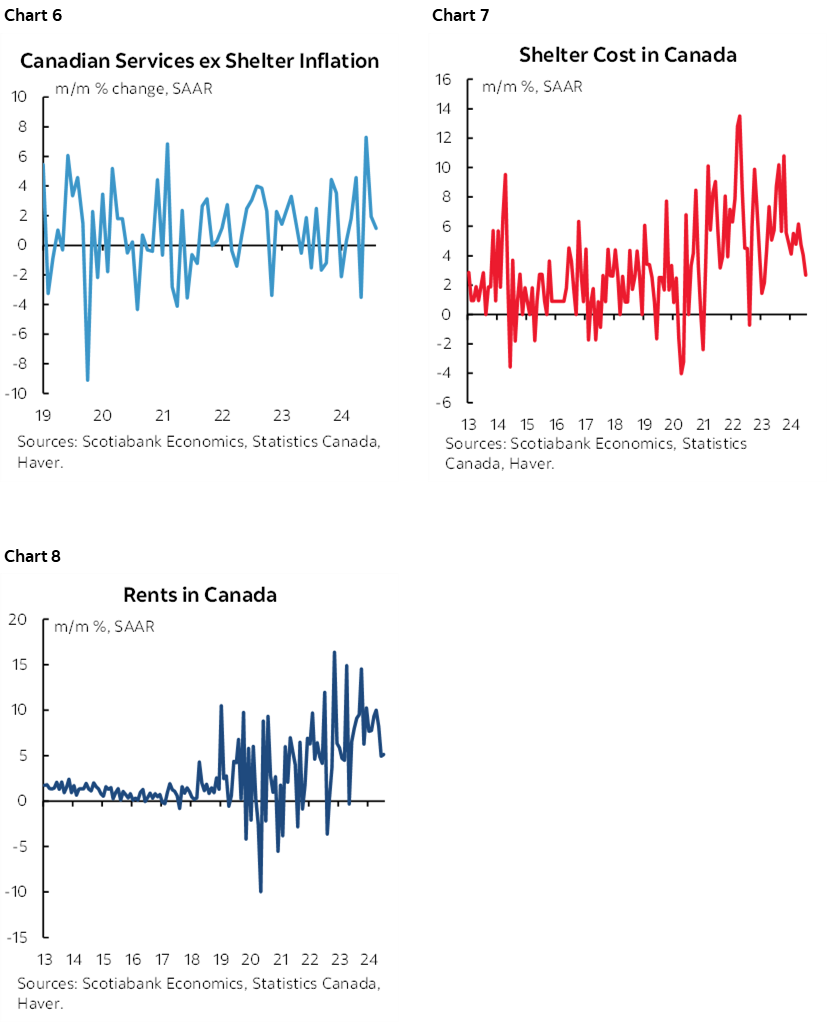
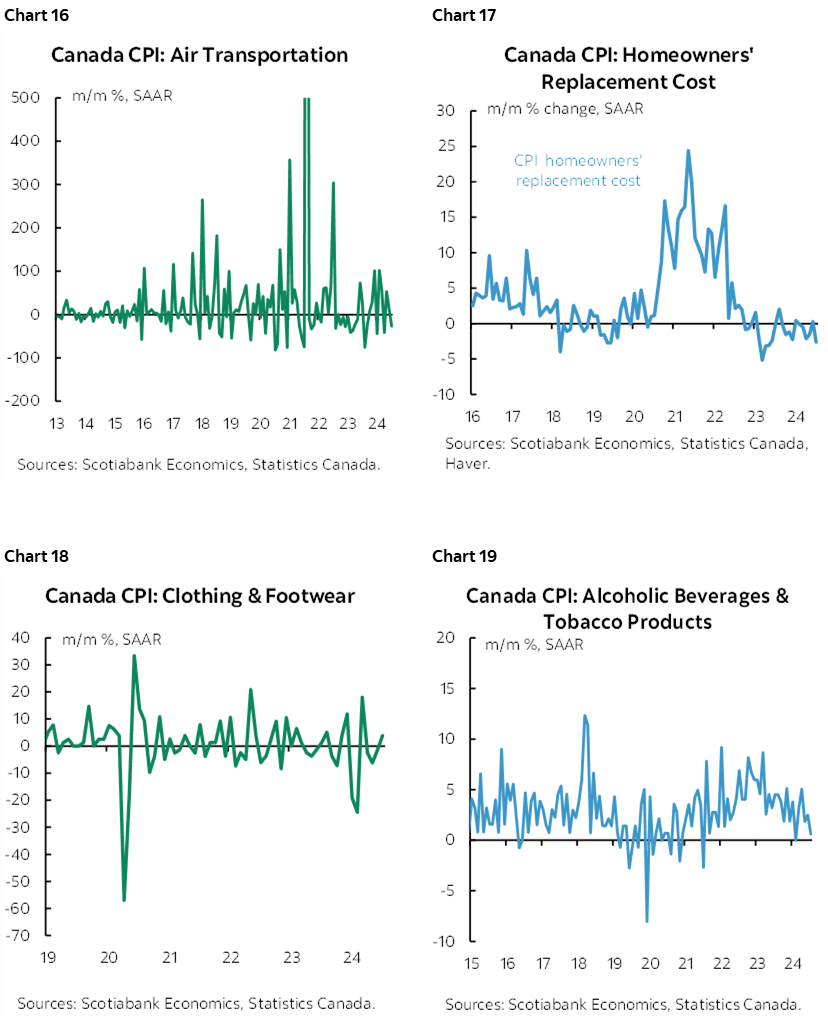
On the services side, there were softer pressures in core services (chart 6) and also somewhat less pressure on shelter costs including rent (charts 7, 8).
A small part of the reason for the weak m/m weighted median was due to an upward revision to June's m/m SAAR WM rate to 3.5% from 2.9% previously.
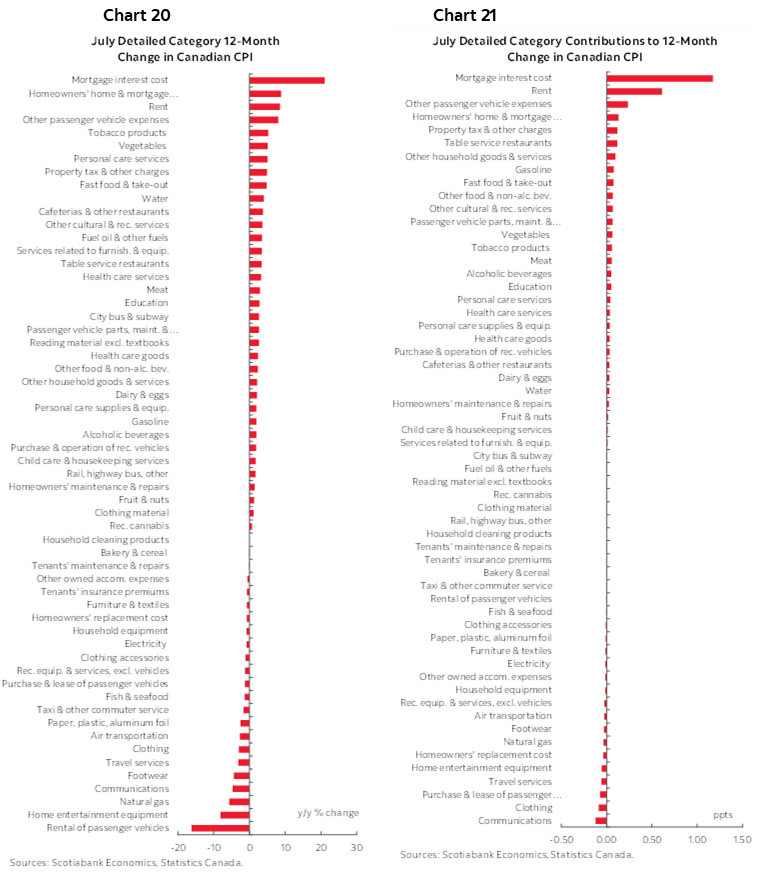
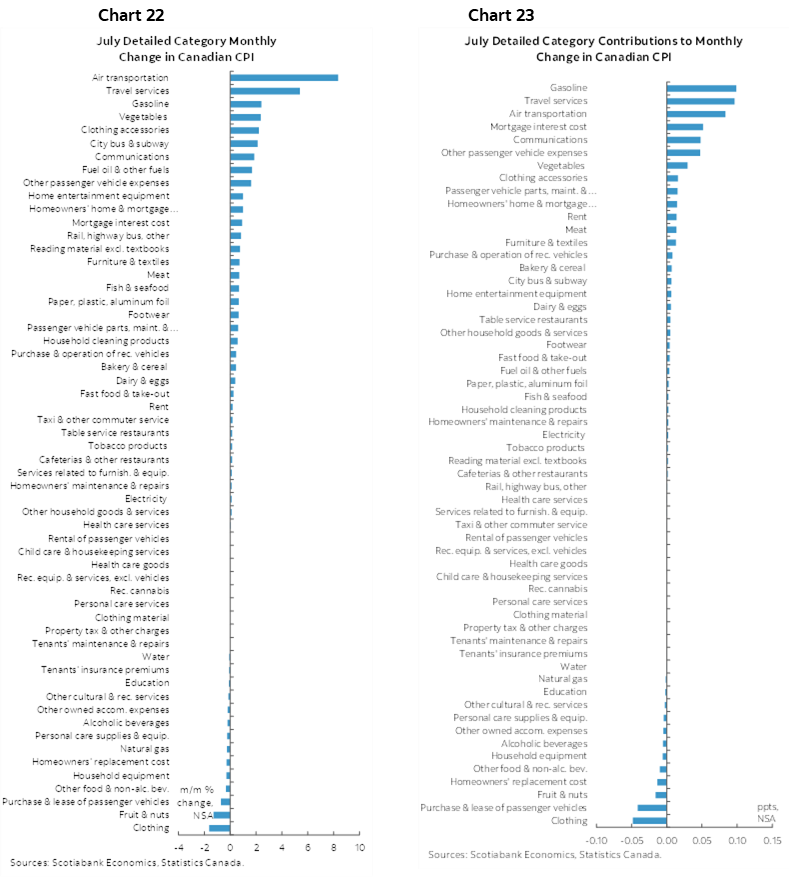
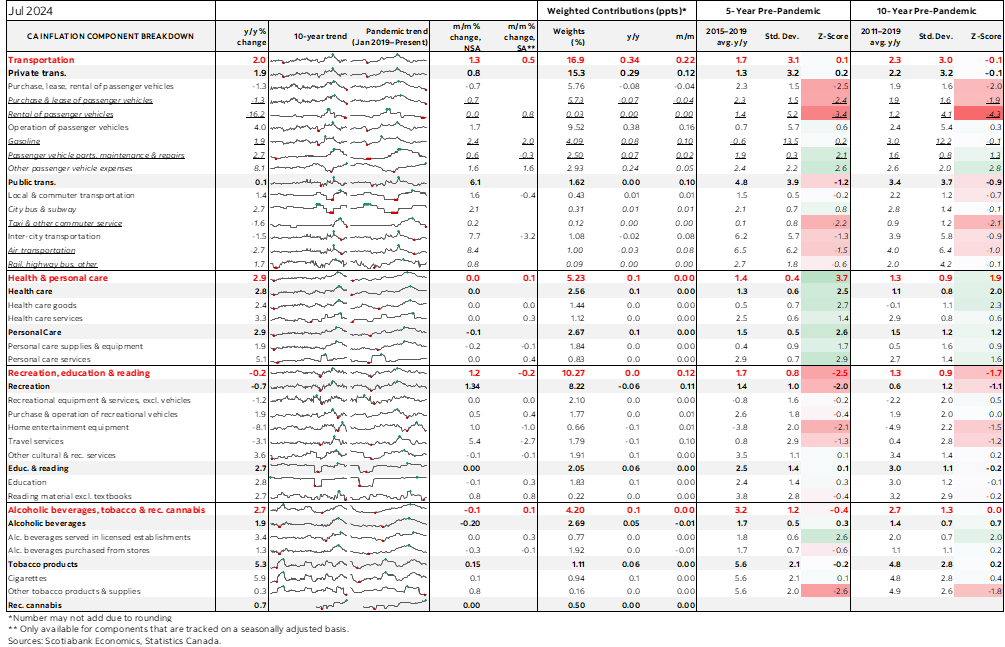
Apparently we're not having much fun this summer. Or at least not in terms of travel related activities. We got 0.4 m/m headline CPI instead of my 0.5 estimate in part because I had factored in an assumed rebound in the recreation/education/reading category that carries about a 10% weight in CPI. That didn't happen. We're getting seasonally unusual weakness in that leisure category that fell -0.7% m/m SA in June and then another 0.2% in July. Falling prices for travel tours are a key part of it in the breakdown (chart 9).
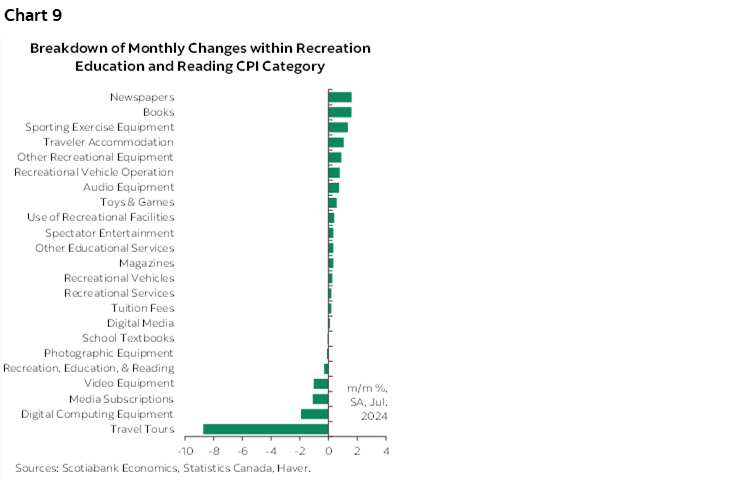
It's easy to imagine a bunch of potential factors behind this category's softness but I'm still a bit surprised. CAD makes travel abroad more expensive but should incite more foreign travel to Canada especially from the US given Canada is a very price sensitive travel destination. Pressures on the finances of some households are not helping, but other households like the two-thirds of households without a mortgage are in better shape. Airfare is expensive in Canada as a perennial factor. Maybe weather also contributed to price discounting as it has been a stinkin' hot summer (with quite a lot of rain) in big parts of the country.
COMING RISKS
Figures for August and September may be interesting on three counts. One is regular data uncertainty in the context of ongoing upside risks to inflation (see morning note), but the other two are unusual.
Near-term price pressures partly depend on how long the likely rail strike lasts and how pervasive its effects may be. What has me worried about the duration is that both sides are saying they remain far apart and that the labour regs have changed given the left wing Federal government’s pro-union policies that are against intervention. This raises the risk of supply shocks at a key time for retailers that are ordering their goods for the holiday season. A short strike is no big deal. A prolonged one could be quite disruptive to stocking and prices. Ditto for some key commodities like potash, wheat, etc. Oil by rail is less susceptible with those flows roughly tied with the lows of the past decade in part due to TransMountain.
Of much lesser concern is that Statcan has stated there will be methodological changes to how it captures cellular services prices in next month's CPI for August (here). Charts 10–11 when combined with a 1.5% weight on cellular services in CPI show why it may matter somewhat. For example, when the category was down by about -25% y/y earlier this year it was contributing -0.3% to -0.4% to the deceleration in y/y inflation. My eyes started to glaze over while reading their methodological update but I'm unsure what effect the changes may have on this category and its weight in CPI.
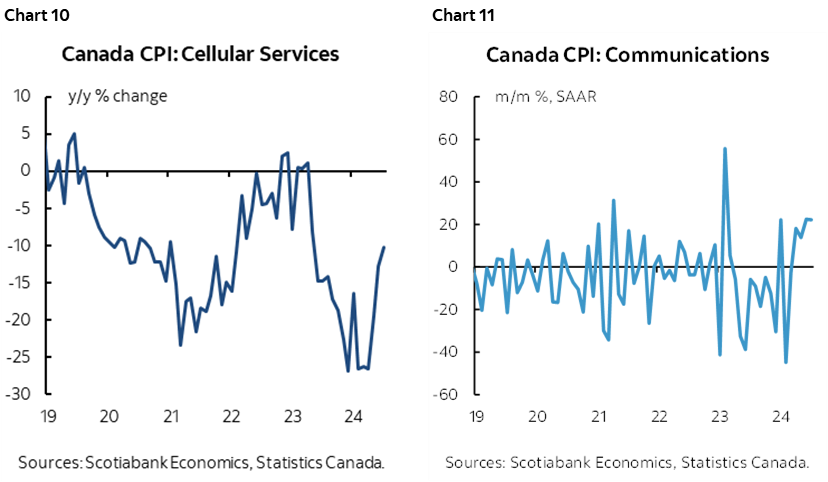
The cellular category is a great example of the difficulties associated with measuring inflation. Recall it's not just about measuring prices, but also quality changes that get factored into CPI. What you've observed on your bills is only part of the issue. More data, broader networks, faster speeds, etc also factor into inflation stats through hedonic adjustments.
Please also see the collection of charts on the following pages and the detailed table at the back of this publication.
Markets Barely Flinched
There were relatively modest market moves in the aftermath of the release. USDCAD moved up (ie: CAD depreciated) by about a third of a cent. The 2-year GoC moved down by 4–5bps and is matching the performance of US 2s this morning. The September BoC meeting was priced for -25bps and remains as such. Only 2–3bps was added onto market pricing for -75bps more to year-end.
Now onto things that matter more, like Jackson Hole...
DISCLAIMER
This report has been prepared by Scotiabank Economics as a resource for the clients of Scotiabank. Opinions, estimates and projections contained herein are our own as of the date hereof and are subject to change without notice. The information and opinions contained herein have been compiled or arrived at from sources believed reliable but no representation or warranty, express or implied, is made as to their accuracy or completeness. Neither Scotiabank nor any of its officers, directors, partners, employees or affiliates accepts any liability whatsoever for any direct or consequential loss arising from any use of this report or its contents.
These reports are provided to you for informational purposes only. This report is not, and is not constructed as, an offer to sell or solicitation of any offer to buy any financial instrument, nor shall this report be construed as an opinion as to whether you should enter into any swap or trading strategy involving a swap or any other transaction. The information contained in this report is not intended to be, and does not constitute, a recommendation of a swap or trading strategy involving a swap within the meaning of U.S. Commodity Futures Trading Commission Regulation 23.434 and Appendix A thereto. This material is not intended to be individually tailored to your needs or characteristics and should not be viewed as a “call to action” or suggestion that you enter into a swap or trading strategy involving a swap or any other transaction. Scotiabank may engage in transactions in a manner inconsistent with the views discussed this report and may have positions, or be in the process of acquiring or disposing of positions, referred to in this report.
Scotiabank, its affiliates and any of their respective officers, directors and employees may from time to time take positions in currencies, act as managers, co-managers or underwriters of a public offering or act as principals or agents, deal in, own or act as market makers or advisors, brokers or commercial and/or investment bankers in relation to securities or related derivatives. As a result of these actions, Scotiabank may receive remuneration. All Scotiabank products and services are subject to the terms of applicable agreements and local regulations. Officers, directors and employees of Scotiabank and its affiliates may serve as directors of corporations.
Any securities discussed in this report may not be suitable for all investors. Scotiabank recommends that investors independently evaluate any issuer and security discussed in this report, and consult with any advisors they deem necessary prior to making any investment.
This report and all information, opinions and conclusions contained in it are protected by copyright. This information may not be reproduced without the prior express written consent of Scotiabank.
™ Trademark of The Bank of Nova Scotia. Used under license, where applicable.
Scotiabank, together with “Global Banking and Markets”, is a marketing name for the global corporate and investment banking and capital markets businesses of The Bank of Nova Scotia and certain of its affiliates in the countries where they operate, including; Scotiabank Europe plc; Scotiabank (Ireland) Designated Activity Company; Scotiabank Inverlat S.A., Institución de Banca Múltiple, Grupo Financiero Scotiabank Inverlat, Scotia Inverlat Casa de Bolsa, S.A. de C.V., Grupo Financiero Scotiabank Inverlat, Scotia Inverlat Derivados S.A. de C.V. – all members of the Scotiabank group and authorized users of the Scotiabank mark. The Bank of Nova Scotia is incorporated in Canada with limited liability and is authorised and regulated by the Office of the Superintendent of Financial Institutions Canada. The Bank of Nova Scotia is authorized by the UK Prudential Regulation Authority and is subject to regulation by the UK Financial Conduct Authority and limited regulation by the UK Prudential Regulation Authority. Details about the extent of The Bank of Nova Scotia's regulation by the UK Prudential Regulation Authority are available from us on request. Scotiabank Europe plc is authorized by the UK Prudential Regulation Authority and regulated by the UK Financial Conduct Authority and the UK Prudential Regulation Authority.
Scotiabank Inverlat, S.A., Scotia Inverlat Casa de Bolsa, S.A. de C.V, Grupo Financiero Scotiabank Inverlat, and Scotia Inverlat Derivados, S.A. de C.V., are each authorized and regulated by the Mexican financial authorities.
Not all products and services are offered in all jurisdictions. Services described are available in jurisdictions where permitted by law.