- Canada’s job market put in another strong performance
- Wage growth is on a tear...
- ...with powerful gains being baked in for years to come
- Hours worked continue to pay the price for strikes
- Canada’s job market is much tighter than the US
- Why dissing per capita GDP is going too far
- Structural and cyclical Inflation risks remain alive and well in Canada
- Canada employment m/m 000s / UR %, SA, November:
- Actual: 24.9 / 5.8
- Scotia: 15 / 5.9
- Consensus: 14 / 5.8
- Prior: 17.5 / 5.7
This country sure has a lot of negative nellies considering it has created 430,000 jobs so far and the year isn’t even over yet. Canada’s job market remains resilient, is tighter than the US job market, and continues to drive runaway wage pressures while productivity stinks. The crowded consensus that posits inflation risk has magically disappeared and the BoC should get on with cutting is behaving very prematurely in my view. Markets more so.
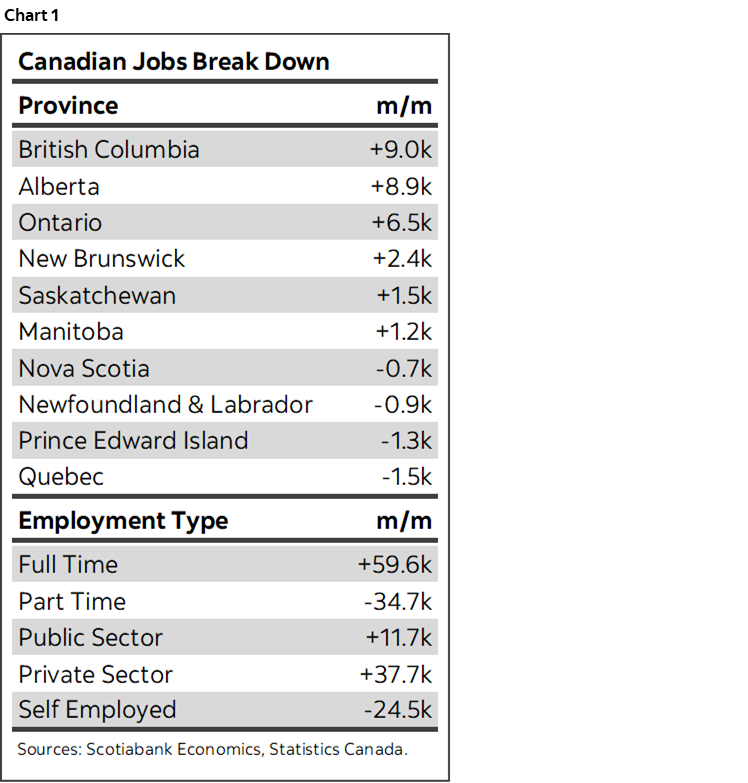
I’ll present the details and observations first and then follow with my takeaways. Chart 1 provides some highlights to go with the table above.
STRONG DETAILS BEHIND THE JOB GAIN
Canada generated 25k jobs last month. That’s above the long-run average monthly gain. The 95% confidence interval would be between roughly –30k and +80k. I’ll take it.
All of that was in full-time jobs that were up by 60k as part-time jobs were down 35k. I’ll take that too.
All of the gain was in payroll positions (+49k). Self-employed fell 25k and is the softest of the soft data universe. Great.
Within payroll employment, the gain was mostly in the private sector (+38k) as the public sector added 12k. There are lots of good public sector jobs, but they’ve gone off the charts for years and so I like to see growth skewed toward the wealth creating part of the economy. Tick that box too.
By sector, this time it was all goods +38k, as services employment fell 13k. I’m mixed on that one. Chart 2 shows the breakdown by sector which showed enough breadth to be ok.

By age, youths aged 15–24 lost 13k jobs. The 25–54 age bracket was up 20k and 55+ gained 18k.
By province, Ontario was up 6.5k, Quebec was stable (-1.5k), Alberta added +9k and BC added +9k. The rest of the provinces were little changed.
WAGES ARE SOARING
If you only look at the year-over-year wage figure for permanent employees then you’ll miss the inflection points time and again. That y/y figure was stable at 5% which was stronger than what would have happened if base effects had dominated in which case the reading would have pulled back to 4.4% y/y.
Base effects did not dominate. Wages were up by 6.9% m/m at a seasonally adjusted and annualized rate (chart 3). The three-month moving average of this figure is 6.1% m/m SAAR. The six-month moving average is 7% m/m SAAR. When Governor Macklem quotes wage gains trending in the 4–5% ballpark he is quoting the trend in the year-over-year rate and that measure is understating wage growth at the margin. The BoC needs to embrace the more recent evidence that is even hotter than they are saying.

Wages are strongly outpacing prices (chart 4).

The thing about wages is that the collective bargaining effects on wages are still ongoing and the outcomes to date are not yet fully showing in the lagging data. We’ll get hot trend wage growth for quite a while yet—perhaps years—as the settlements get factored into pay and more settlements and yet more strikes are ahead. Behaviour has changed by pivoting toward demand strong wage gains—and getting them—while productivity tumbles and that should concern the BoC very much so.
Witness the latest monthly evidence from Statcan that showed 8 agreements in Canada with an average contract period of 37 months, so three years, and a first year wage hike of 6.3% and an annual average of 4% per year over the 3 year contract period (chart 5).

One-in-three Canadian workers are unionized versus 10% in the US. Collective bargaining makes Canada's labour market very different from stateside and more like the European model and even at that toward the extremes of the European model (looking at you Italy and Belgium).
The point is that while unions are doing what is expected of them by their members and striking while the iron is hot, collective bargaining is cementing wage gains at a pace far above the BoC’s 2% inflation target for years to come. There are and will be spillover effects into nonunionized sectors as per IMF research that shows countries with high unionization and tight job markets are more likely to see spillover effects.
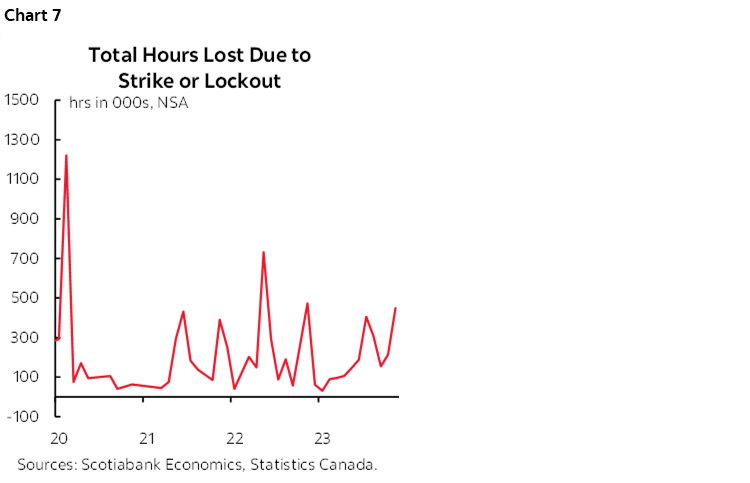
HOURS WORKED A VICTIM OF STRIKES
Hours worked fell 0.7% m/m SA and they are tracking a drop of 1.8% q/q SAAR in Q4 as a reversal of the 1.4% gain in Q3 (chart 6). Even that Q3 gain was only due to earlier months before hours began weakening from September onward. That’s bad for GDP, but we have to ask why it’s happening which is very important.

Why is it bad for GDP? Because GDP is an identity defined as hours worked times labour productivity with the latter defined as real GDP divided by hours worked in aggregate. Folks standing around on picket lines are not producing goods and services. If hours worked are falling, then Canada would need either a big pick-up in hours in December or a Q4 surge in labour productivity to keep GDP growth in the black and in line with our present tracking of around 1% q/q SAAR growth using activity readings. We’ll see as we get more data.
Why is it happening? It’s partly because strikes continue to dent the figures (chart 7).
THE EXAGGGERATED PER CAPITA CHALLENGE
As for the whole per capita thing, I think the debate has gotten too politicized.
While I do think looking at numbers in per capita terms is important, too many of the comments on falling per capita GDP and rising unemployment as job growth is outpaced by population and labour force expansion are exaggerated.
There are at least two reasons why I’ve been saying this:
- First, if you're going to do per capita GDP, perhaps take out the temps. They may or may not stay. Many go home eventually. The temps that stay are typically young, such as international students, with their fastest rates of productivity growth ahead of them. Temps make up a big share of our population growth. Chart 8 shows the difference between real per capita GDP using total population 15+ and then stripping out the temps. Pretty different, huh? That’s the point. The truth may be somewhere in the middle, but the folks who use the red line are exaggerating things. In any event, the screws are tightening somewhat on the temps category into the year ahead.

- Second, as I've previously argued, the analog to immigration's effects could be the Alberta oil sands development. For years, a lot was going into the oilsands (cap-ex) and nothing was coming out. It was a big gooey capital and productivity sink hole as the projects were being built. Then the projects came on line and output climbed. Immigration could be a similar story. The first round effect is population surge and depressed per capita GDP etc. The second round effect assimilates the arrivals into the job market, consumption, housing, businesses and that's when we see the lift effect. That can take years in a multi-stage shock-versus-control sense. It doesn't happen overnight and certainly not in a country like Canada that has well documented problems with respect to integrating new arrivals to their optimal levels of employment and inclusion. In some cases it can take a whole generation to sacrifice itself for the next ones at the extreme. In many others cases it's a shorter window especially with different forms of immigration.
So while I do think we've overshot on immigration because we didn't plan for it (housing, infrastructure etc), I do find that the per capita hypsters are going too far.
WHY THE UNEMPLOYMENT RATE TICKED UP
Why did the UR tick up to 5.8%? It was actually less of an increase than I was guessing. It was because the labour force in search of employment grew by 58k versus the 25k rise in employment. More people were looking for jobs than getting them. That's because the working age population 15+ increased by another 78k in a single month. The country’s population is up by 914k y/y which is huge given the working age population is now only about 33 million.
WHO IS GETTING THE JOBS?
There has been significant change in who is filling the jobs this year versus the last two years combined when the surge in immigration began. At first it was mostly BICs (born in Canada), and now it's more temps that may or may not be on the path to permanent residency, and perm residents who have been here for only a few years versus the 10+ years category that previously drove most gains in the immigration categories (chart 9).

CANADA’S TIGHTER JOB MARKET
Canada’s labour market remains tighter than the US (chart 10). The unemployment rate is far below guesstimates about where the equilibrium unemployment rate resides in Canada versus the US where the two measures are closer to one another. There is uncertainty around the so-called ‘NAIRU’ or equilibrium level of the unemployment rate, but a cross check is to just look at wages (soaring) and productivity (tumbling). Why are so many striking? Why are they getting great wage gains? Why are they producing less per hour worked? Because they can!!

OVERALL TAKEAWAYS—INFLATION RISK HAS NOT JUST GONE AWAY
Perhaps stubbornly so, I just don’t think it’s prudent to wave the all clear on inflation risk and get on with cutting.
Soaring wages, tumbling productivity. Nah, can't possibly be any inflation risk in that.
Unmoored inflation expectations for years to come in the BoC’s own surveys that are changing behaviour? Silly talk, right?
Nor in excess immigration, that’s just a myth.
Tight home inventories and inadequate expansion of the housing stock? Oh go on, surely you jest. Fool.
The weak loonie? Adjust your screens. Weaker yet if we plow ahead with cuts? Quite possibly.
Fiscal policy stimulus? Nah, don't be silly now, it's prudent. That’s what they say, so it must be so.
Terms of trade effects? What's that again??!
What about long tailed adjustments across supply chains? Oh no, it's all over, back to business as usual. The rise in border frictions after the 2016 US election and Brexit outcome, the tariff wars, the pandemic, Ukraine War and tensions over Taiwan plus potential tensions after the US election next year have all been magically settled. No more nearshoring at higher costs, that's over. C-suites can relax, there is no longer a need to embrace higher operational expenses in order to reduce border frictions and financial distress costs. That’s in the past.
As for GDP and spare/excess demand, if we’ve learned one thing about the pandemic, it’s that output gaps barely explained any of the inflation we got.
All summed up, there are downside risks to the economy and job growth ahead, but those downside risks keep getting pushed out b the bears. Throughout it all, wage gains are being institutionalized for years to come at rates that will persistently pressure inflation along with other drivers. I’m more worried about inflation risk having become a more permanent feature than I am about damaging growth in terms of longer run risks to the economy. I’m especially worried if the transitory camp that misjudged everything throughout all of this gets its way with early and aggressive rate cuts in which case we’ll never beat inflation.
DISCLAIMER
This report has been prepared by Scotiabank Economics as a resource for the clients of Scotiabank. Opinions, estimates and projections contained herein are our own as of the date hereof and are subject to change without notice. The information and opinions contained herein have been compiled or arrived at from sources believed reliable but no representation or warranty, express or implied, is made as to their accuracy or completeness. Neither Scotiabank nor any of its officers, directors, partners, employees or affiliates accepts any liability whatsoever for any direct or consequential loss arising from any use of this report or its contents.
These reports are provided to you for informational purposes only. This report is not, and is not constructed as, an offer to sell or solicitation of any offer to buy any financial instrument, nor shall this report be construed as an opinion as to whether you should enter into any swap or trading strategy involving a swap or any other transaction. The information contained in this report is not intended to be, and does not constitute, a recommendation of a swap or trading strategy involving a swap within the meaning of U.S. Commodity Futures Trading Commission Regulation 23.434 and Appendix A thereto. This material is not intended to be individually tailored to your needs or characteristics and should not be viewed as a “call to action” or suggestion that you enter into a swap or trading strategy involving a swap or any other transaction. Scotiabank may engage in transactions in a manner inconsistent with the views discussed this report and may have positions, or be in the process of acquiring or disposing of positions, referred to in this report.
Scotiabank, its affiliates and any of their respective officers, directors and employees may from time to time take positions in currencies, act as managers, co-managers or underwriters of a public offering or act as principals or agents, deal in, own or act as market makers or advisors, brokers or commercial and/or investment bankers in relation to securities or related derivatives. As a result of these actions, Scotiabank may receive remuneration. All Scotiabank products and services are subject to the terms of applicable agreements and local regulations. Officers, directors and employees of Scotiabank and its affiliates may serve as directors of corporations.
Any securities discussed in this report may not be suitable for all investors. Scotiabank recommends that investors independently evaluate any issuer and security discussed in this report, and consult with any advisors they deem necessary prior to making any investment.
This report and all information, opinions and conclusions contained in it are protected by copyright. This information may not be reproduced without the prior express written consent of Scotiabank.
™ Trademark of The Bank of Nova Scotia. Used under license, where applicable.
Scotiabank, together with “Global Banking and Markets”, is a marketing name for the global corporate and investment banking and capital markets businesses of The Bank of Nova Scotia and certain of its affiliates in the countries where they operate, including; Scotiabank Europe plc; Scotiabank (Ireland) Designated Activity Company; Scotiabank Inverlat S.A., Institución de Banca Múltiple, Grupo Financiero Scotiabank Inverlat, Scotia Inverlat Casa de Bolsa, S.A. de C.V., Grupo Financiero Scotiabank Inverlat, Scotia Inverlat Derivados S.A. de C.V. – all members of the Scotiabank group and authorized users of the Scotiabank mark. The Bank of Nova Scotia is incorporated in Canada with limited liability and is authorised and regulated by the Office of the Superintendent of Financial Institutions Canada. The Bank of Nova Scotia is authorized by the UK Prudential Regulation Authority and is subject to regulation by the UK Financial Conduct Authority and limited regulation by the UK Prudential Regulation Authority. Details about the extent of The Bank of Nova Scotia's regulation by the UK Prudential Regulation Authority are available from us on request. Scotiabank Europe plc is authorized by the UK Prudential Regulation Authority and regulated by the UK Financial Conduct Authority and the UK Prudential Regulation Authority.
Scotiabank Inverlat, S.A., Scotia Inverlat Casa de Bolsa, S.A. de C.V, Grupo Financiero Scotiabank Inverlat, and Scotia Inverlat Derivados, S.A. de C.V., are each authorized and regulated by the Mexican financial authorities.
Not all products and services are offered in all jurisdictions. Services described are available in jurisdictions where permitted by law.