- US GDP growth vastly exceeded everyone’s forecasts...
- ...extending the outperformance to six consecutive quarters
- The Fed is likely to celebrate strong growth...
- ...with dampened confidence it can durably hit its dual mandate
- Rates dubiously rallied post-data perhaps because of other data
- The BoC is underestimating how the US economy has Canada’s back...
- ...while Canadian rates rallied post-data without understanding strike effects
- US Q4 GDP, q/q SAAR, %:
- Actual: 3.3
- Scotia: 2.2
- Consensus: 2.0
- Prior: 4.9
The US economy shamed the bears yet again. It grew by 3.3% q/q at a seasonally adjusted and annualized rate (SAAR) which was above all estimates in consensus that were between about 1½% and 2½%.
The outperformance is especially large in relation to the expectations coming into the quarter. For the sixth consecutive quarter, consensus came in expecting dire conditions and got blown away by remarkable growth (chart 1).
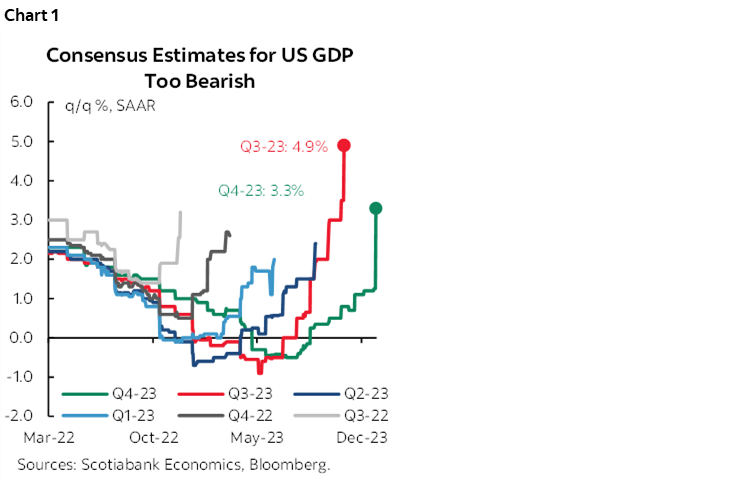
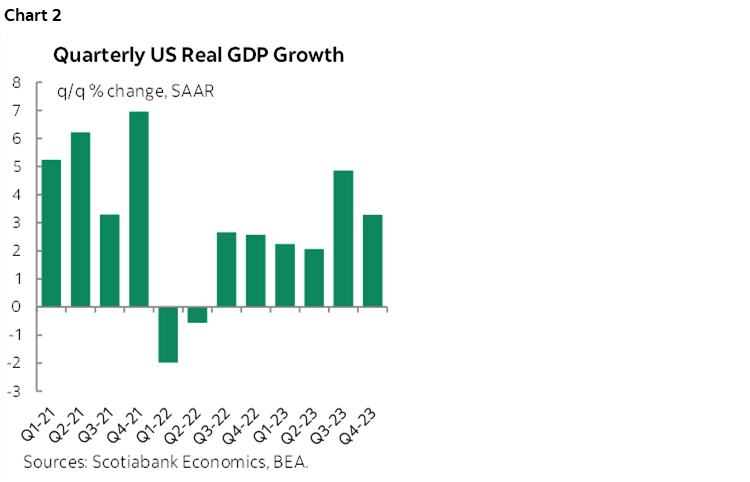
Chart 2 shows this is not a slowing economy by any means. Trend growth has remained very hot throughout the past six quarters.
SOLID DETAILS
The details were generally solid in terms of weighted contributions to growth (chart 3). Consumption added 1.9 ppts to the 3.3 GDP growth headline. That was roughly evenly split between services and goods spending.
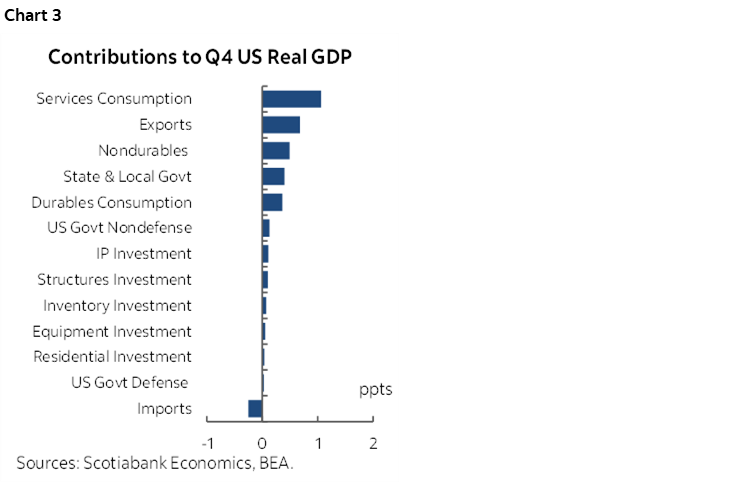
Investment added 0.4 ppts. Nonresidential investment added 0.3 ppts. Inventories only added 0.1 ppts and were not a factor. Residential investment contributed nothing. Exports add 0.7 ppts, but imports subtracted 0.25 ppts through a bigger leakage effect out of GDP in an accounting sense (higher imports). Higher imports are not necessarily a bad thing but they leak out of GDP. Government spending added another 0.56 ppts led by state and local governments.
Chart 4 shows that the evolution of the contributions to growth has been generally robust over time.
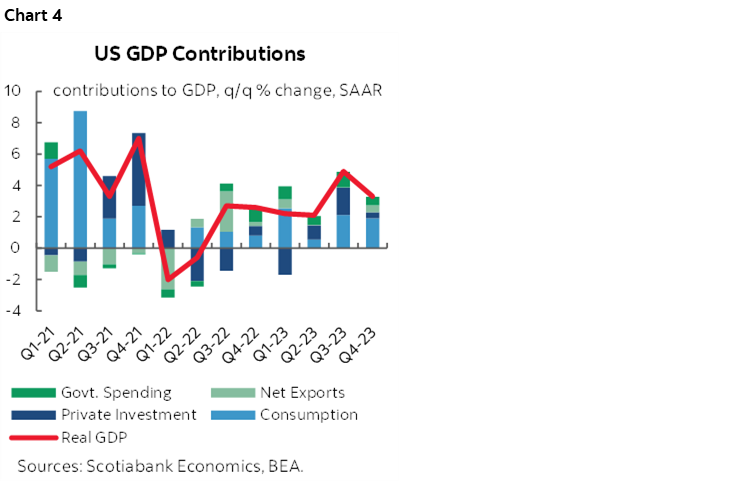
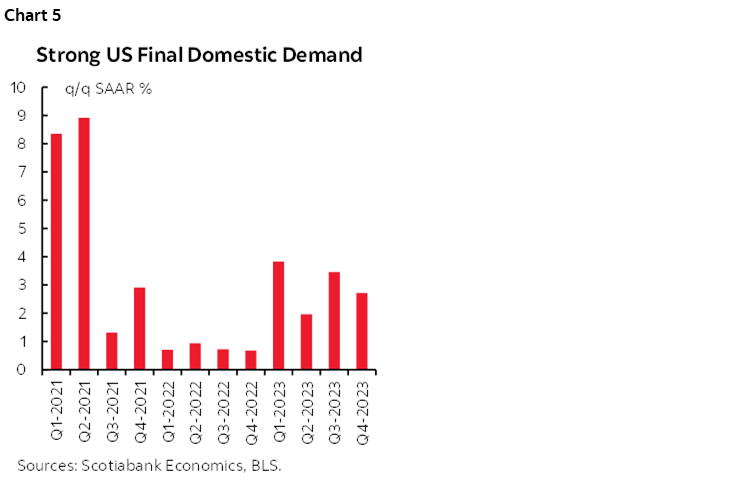
Chart 5 shows that final domestic demand also continues to grow at a hefty pace. This is arguably the better measure of underlying momentum in the domestic economy that excludes inventory and net trade swings. It’s a purer consumption plus investment plus government spending measure. FDD grew solidly in every quarter of 2023.
MARKET REACTION
US Treasuries rallied and markets added a few basis points to rate cut pricing through nearer term contracts. Why? And does it make sense?
One narrative is that it adds to evidence of a soft landing as recent inflation has been softer and growth is strong and the Fed will celebrate. I think that’s misplaced.
I don’t think that’s how the Fed will view it next week. I wouldn’t be surprised if former St. Louis Fed President Bullard choked on his cheerios when he saw this morning’s GDP numbers after saying the other day he thought a cut in March was feasible.
Inflation has many complicated drivers especially in the pandemic era, but one of the ones central banks speak to is the output gap framework. The US economy is growing by almost double the Fed's estimates of potential GDP. There is no evidence of slack emerging. In fact, the US economy is pushing further into excess aggregate demand.
This harkens back to Chair Powell’s earlier press conference in which he said that while they have their dual mandate, if GDP keeps surprising it would frustrate hopes to durably bring down inflation. In next week’s press conference, Powell will likely flag inflation progress, but sound careful and circumspect toward whether this progress is durable as growth continues to be strong while warning signs emerge on wage gains and shipping costs due to geopolitical turmoil.
I think the market reaction was more about other data recapped below.
OTHER DATA
Markets might have also put more stock in other data even if I disagree with doing so.
Core PCE landed on the screws at 2% q/q SAAR ahead of tomorrow’s December data and so there was no surprise there.
The GDP price deflator softened to 1.5% q/q SAAR. That’s the economy-wide measure of overall prices, but it’s not the PCE measure the Fed follows.
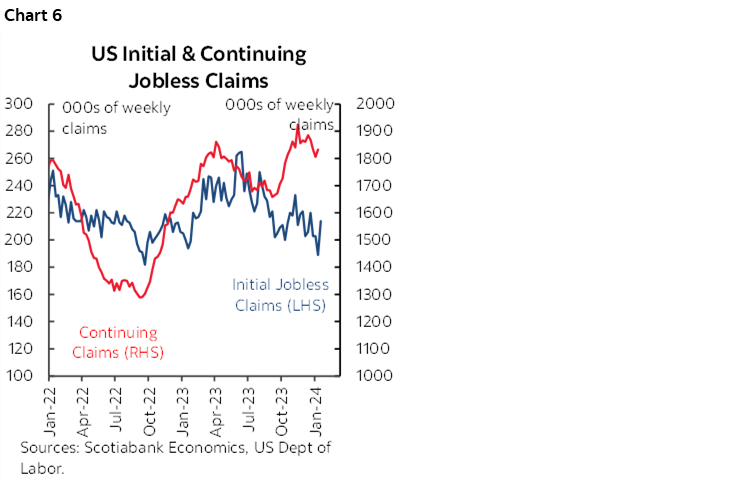
Jobless claims increased (chart 6). Initial filings moved up to 214k from the 189k drop the week before with no states estimated which validates data reliability. That’s still low, but it indicates the prior drop was temporary. Continuing claims also increased to 1.833 million from 1.806 million.
Durable goods orders disappointed at 0% m/m in December (consensus 1.5%), but core capital goods orders that exclude defence and aircraft which serves as a better gauge of underlying investment were up 0.3% m/m (0.1% consensus).
The Chicago Fed’s national activity index fell to –0.15 in December and has been weakening since August.
US new home sales beat expectations. They were up 8% m/m in December (10% consensus) but the level was higher than expected because the prior month was revised up to post a smaller drop of 9% instead of the –12.2% original estimate.
CANADIAN IMPLICATIONS
I think Governor Macklem blew it when asked during yesterday’s press conference about whether US economic strength matters to Canada. His answer was that Canadian GDP is what matters and Canadian consumers.
Both would be correct. As long as the US economy keeps vastly outpacing everyone’s expectations including the BoC’s, it will support Canada’s economy through trade linkages and by extension it will support Canadian jobs, investment and spending. If the Fed pushes back against nearer term rate cuts because of this strength, then there are limits to the ability of the BoC to ignore that especially given my ongoing narrative that Canada faces greater inflation risk going forward than the United States.
Now if markets this morning are driving the rally at the Canadian front-end because SEPH payrolls posted a drop of 88k in November then I give up hope for markets to apply any effort toward understanding data. SEPH fell because of 66k striking education workers in Quebec and other striking public sector workers in that province. SEPH treats striking workers as lost jobs off payroll if they are on strike for the entire reference week as they were. But they are not lost jobs and the Labour Force Survey does not treat striking workers the same way. In other words, SEPH was data noise.
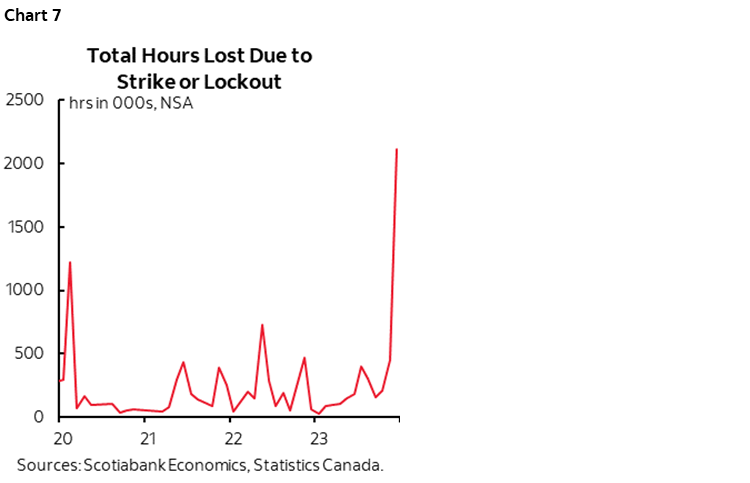
What’s not data noise, however, is that Canada is losing more hours due to striking workers than it was losing to pandemic lockdowns (chart 7). That’s just stunning. Striking workers are denting GDP growth on tap of the other serial shocks to growth since last Spring that go well beyond the effects of tighter monetary policy that Governor Macklem overemphasizes.
DISCLAIMER
This report has been prepared by Scotiabank Economics as a resource for the clients of Scotiabank. Opinions, estimates and projections contained herein are our own as of the date hereof and are subject to change without notice. The information and opinions contained herein have been compiled or arrived at from sources believed reliable but no representation or warranty, express or implied, is made as to their accuracy or completeness. Neither Scotiabank nor any of its officers, directors, partners, employees or affiliates accepts any liability whatsoever for any direct or consequential loss arising from any use of this report or its contents.
These reports are provided to you for informational purposes only. This report is not, and is not constructed as, an offer to sell or solicitation of any offer to buy any financial instrument, nor shall this report be construed as an opinion as to whether you should enter into any swap or trading strategy involving a swap or any other transaction. The information contained in this report is not intended to be, and does not constitute, a recommendation of a swap or trading strategy involving a swap within the meaning of U.S. Commodity Futures Trading Commission Regulation 23.434 and Appendix A thereto. This material is not intended to be individually tailored to your needs or characteristics and should not be viewed as a “call to action” or suggestion that you enter into a swap or trading strategy involving a swap or any other transaction. Scotiabank may engage in transactions in a manner inconsistent with the views discussed this report and may have positions, or be in the process of acquiring or disposing of positions, referred to in this report.
Scotiabank, its affiliates and any of their respective officers, directors and employees may from time to time take positions in currencies, act as managers, co-managers or underwriters of a public offering or act as principals or agents, deal in, own or act as market makers or advisors, brokers or commercial and/or investment bankers in relation to securities or related derivatives. As a result of these actions, Scotiabank may receive remuneration. All Scotiabank products and services are subject to the terms of applicable agreements and local regulations. Officers, directors and employees of Scotiabank and its affiliates may serve as directors of corporations.
Any securities discussed in this report may not be suitable for all investors. Scotiabank recommends that investors independently evaluate any issuer and security discussed in this report, and consult with any advisors they deem necessary prior to making any investment.
This report and all information, opinions and conclusions contained in it are protected by copyright. This information may not be reproduced without the prior express written consent of Scotiabank.
™ Trademark of The Bank of Nova Scotia. Used under license, where applicable.
Scotiabank, together with “Global Banking and Markets”, is a marketing name for the global corporate and investment banking and capital markets businesses of The Bank of Nova Scotia and certain of its affiliates in the countries where they operate, including; Scotiabank Europe plc; Scotiabank (Ireland) Designated Activity Company; Scotiabank Inverlat S.A., Institución de Banca Múltiple, Grupo Financiero Scotiabank Inverlat, Scotia Inverlat Casa de Bolsa, S.A. de C.V., Grupo Financiero Scotiabank Inverlat, Scotia Inverlat Derivados S.A. de C.V. – all members of the Scotiabank group and authorized users of the Scotiabank mark. The Bank of Nova Scotia is incorporated in Canada with limited liability and is authorised and regulated by the Office of the Superintendent of Financial Institutions Canada. The Bank of Nova Scotia is authorized by the UK Prudential Regulation Authority and is subject to regulation by the UK Financial Conduct Authority and limited regulation by the UK Prudential Regulation Authority. Details about the extent of The Bank of Nova Scotia's regulation by the UK Prudential Regulation Authority are available from us on request. Scotiabank Europe plc is authorized by the UK Prudential Regulation Authority and regulated by the UK Financial Conduct Authority and the UK Prudential Regulation Authority.
Scotiabank Inverlat, S.A., Scotia Inverlat Casa de Bolsa, S.A. de C.V, Grupo Financiero Scotiabank Inverlat, and Scotia Inverlat Derivados, S.A. de C.V., are each authorized and regulated by the Mexican financial authorities.
Not all products and services are offered in all jurisdictions. Services described are available in jurisdictions where permitted by law.

