- While the headline CPI and y/y core measures were softer…
- ...the BoC’s preferred core gauges were hot at the margin for a second straight month
- The BoC is on a pre-committed path toward further easing next week…
- ...despite renewed core inflationary pressures after the earlier soft patch
- Canadian CPI m/m // y/y %, NSA, June:
- Actual: -0.1 / 2.7
- Scotia: 0.1 / 2.8
- Consensus: 0.1 / 2.8
- Prior: 0.6 / 2.9
- Trimmed mean CPI: 2.9% y/y (2.9% prior); 2.9% m/m SAAR (4.1% prior)
- Weighted median CPI: 2.6% y/y (2.7% prior, revised 2.8%); 2.9% m/m SAAR (4.1% prior)
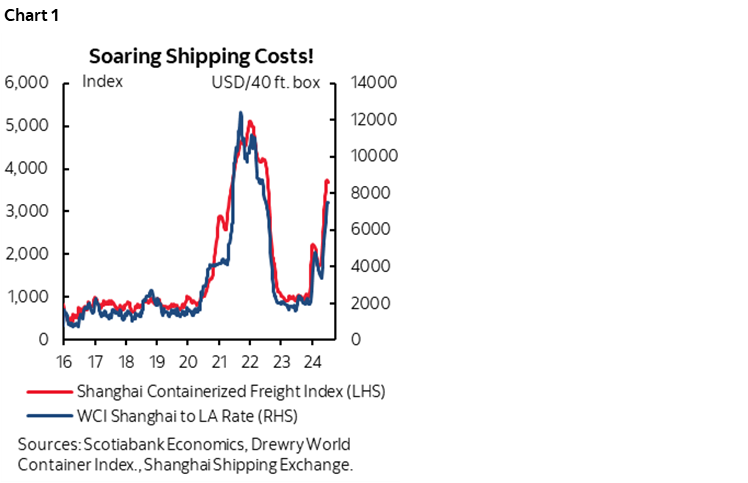
The Bank of Canada’s core inflation gauges were hot again in high frequency m/m terms last month. Two back-to-back months of hot core gauges support my thesis that the first four-month period this year was a transitory soft patch for inflation and now we’re bouncing back from it. The BoC is still likely to cut next week, but choosing to do so would put full faith in the BoC’s sketchy forecasting abilities while casting aside data dependency and fresher information on the evolving shock to global supply chains that may matter to a trade dependent country like Canada (chart 1). It’s also probably true that had the BoC not cut in June and pre-committed to “several” more cuts, then it might have been optically harder to do so now.
Markets Quickly Shook Off the Initial Reaction
Financial markets initially put a bid to the front-end of the Canadian rates curve when the two-year yield fell by about 2bps out of the gates. It has since reversed that on a second trade that looked at the details that were not well covered in the financial news services. The moves are nevertheless small on net.
OIS markets added 1–2 basis points to pricing for next week’s BoC decision that now stands at about 22–23bps, or almost all of a quarter point cut. That part was a curious reaction following the hot core gauges and may have been because the media’s coverage emphasized the lower headline readings and ignored the important details.
The Canadian dollar initially depreciated by about a third of a cent to the USD but that had more to do with the strong US retail sales report with the key control group that factors into the BEA’s consumption estimates landing at 0.9% m/m, or almost a full percentage point higher in June. Much of that initially CAD depreciation has since reversed as the market parsed through the CPI details. The USD is broadly stronger against major crosses but CAD is outperforming most of the rest of them.
What Didn’t Matter….
Headline CPI was soft. It was down –0.1% m/m NSA and up by only 0.1% m/m SA in June. That dragged the year-over-year rate lower to 2.7% from 2.9%.
The year-over-year weighted median ((2.6% from 2.7% revised down from 2.8%) moved lower but the trimmed mean measure was unchanged at 2.9% y/y. Recall that these are not spot y/y measures. They are rolling weighted averages of m/m SAAR changes that exclude the top and bottom 20% of the basket each month (trimmed mean) or take the 50th percentile weighted inflation rate each month and compounded the m/m readings to get to a y/y calculation. Thus, they can change for three reasons. One is when the first month drops out. Two is the addition of the latest month. And three is revisions.
...Versus What Does
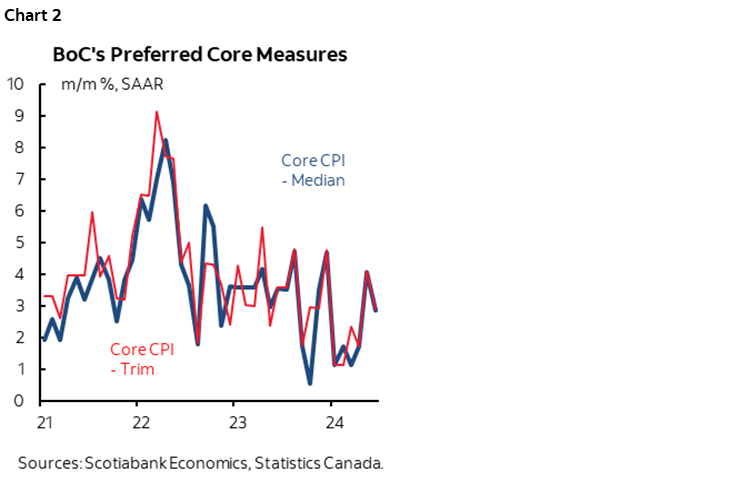
The proper way to look at the core gauges is to consider the m/m SAAR readings. They were hot again. Both trimmed mean and weighted median CPI were up by 2.9% m/m SAAR following the prior month’s 4.1% readings for both. Chart 2 shows the recent pattern versus the softer patch earlier this year. Underlying inflation has pivoted higher again over the past two months. It’s not screaming hot like it was earlier in the post-pandemic period, but it’s hot enough to merit concern that inflation risk remains alive and kicking in Canada.
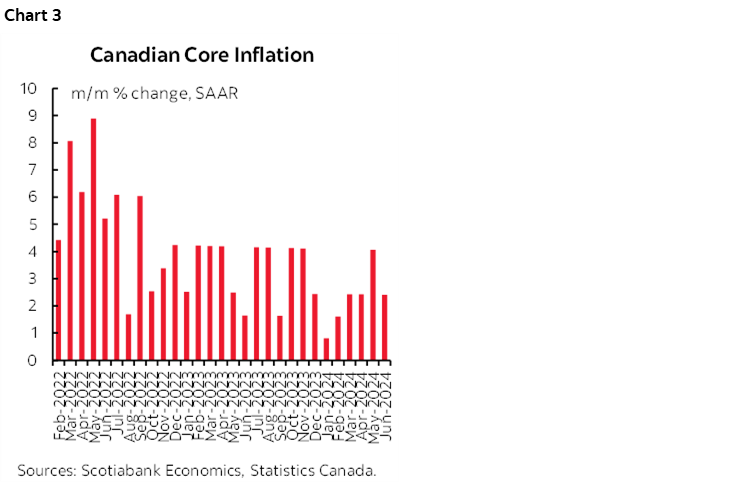
The same is generally true of the BoC’s previously preferred core inflation gauge but to a lesser extent (chart 3).
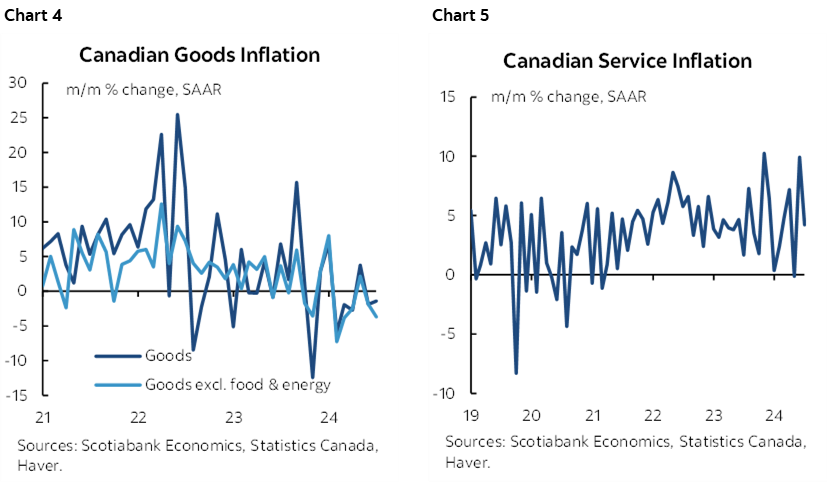
Goods and core goods inflation weighed down the headline CPI reading (chart 4). Services inflation was hot again and drove the strong trimmed mean and weighted median CPI readings (chart 5).
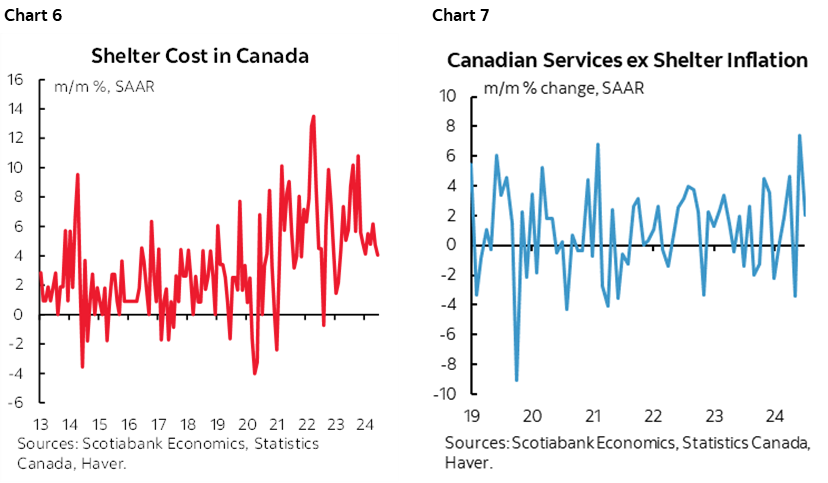
Even though shelter inflation was hot again (chart 6), so was core services inflation (ex-shelter) as shown in chart 7 using our own calculations. I had cautioned against the consensus view that there was no inflation outside of shelter and clearly there is. Besides, it was always a fallacy that the BoC could ignore shelter’s one-quarter weight in CPI.
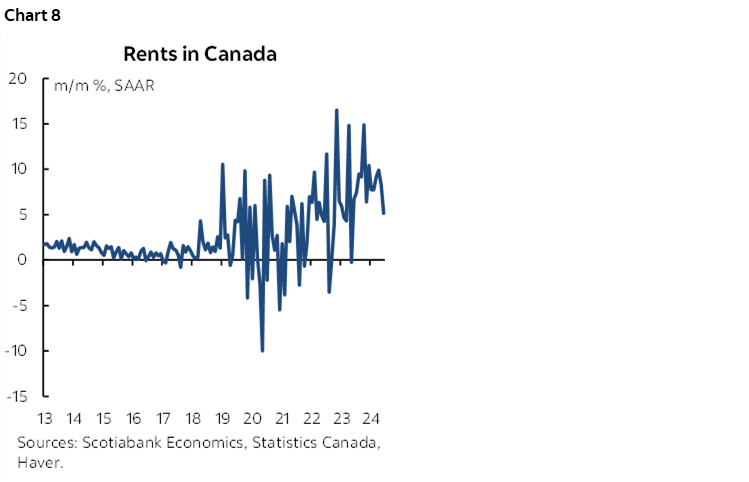
Rents continue to explode in Canada (chart 8).
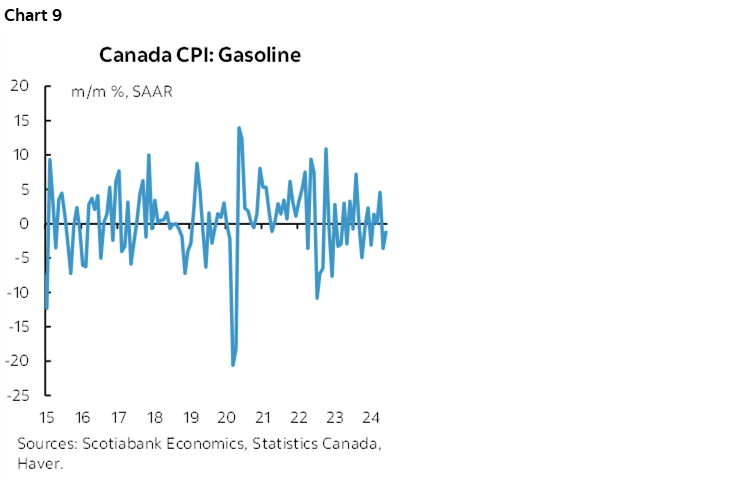
Gas prices weighted down headline inflation (chart 9).
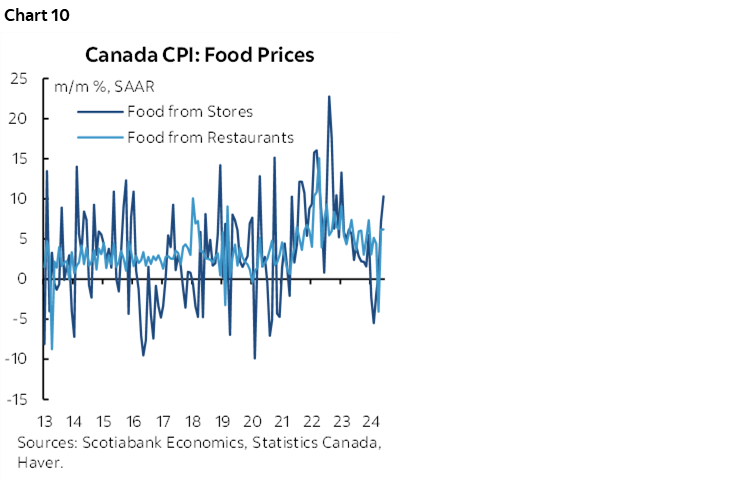
Food prices, however, shot higher by 0.5% m/m NSA and 0.6% m/m SA. Grocery prices shot higher (chart 10). Grocery prices were soft earlier in the year when grocers were in the political spotlight but I had warned this would likely prove to be temporary. It has.
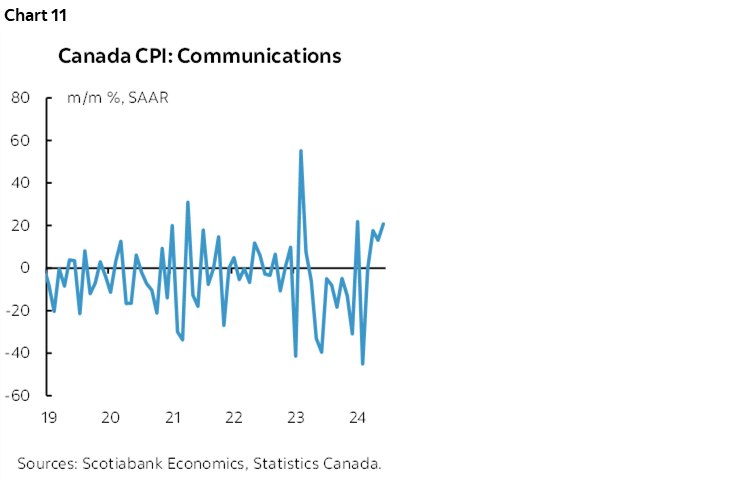
The same argument holds for communications prices (internet, cell phones etc) as shown in chart 11. That inflation has bounced back now that they are no longer being hauled before industry committees and threatened—along with grocers etc—with the risk of industry specific levies.
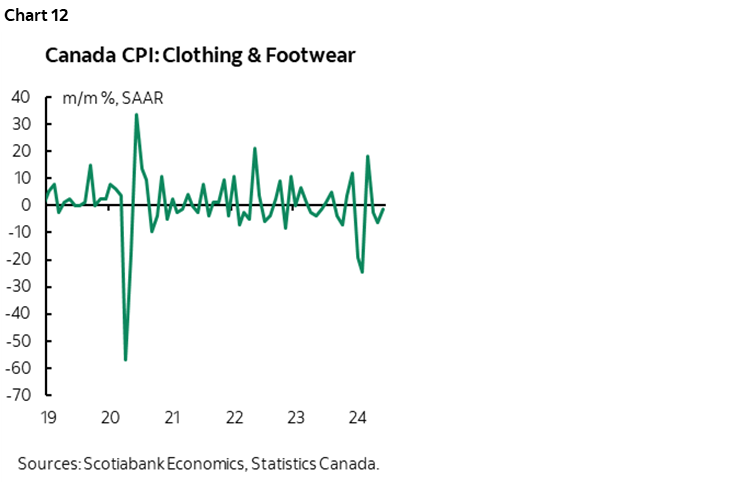
Clothing prices are proving to be extremely volatile over the past 6+ months and edged a bit lower in June (chart 12).
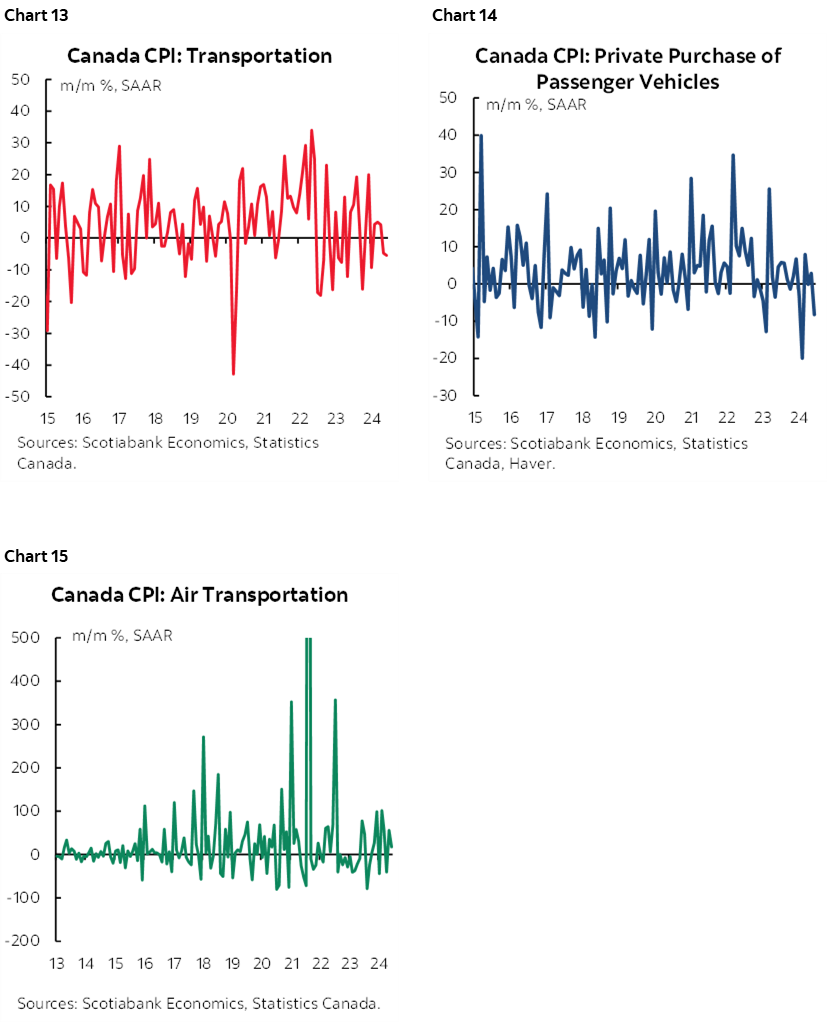
Transportation prices were soft again, down –0.5% m/m SA (chart 13). That was driven by gasoline but also lower vehicle prices (chart 14). Airfare was up again along a volatile pattern (chart 15).
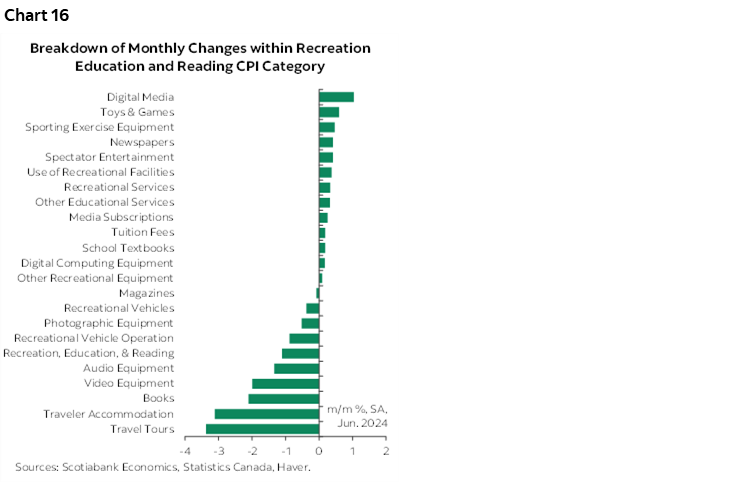
The broad recreation/reading/education category that includes most of the leisure categories fell –0.5% m/m SA after a 0.4% prior gain. The travel categories posted the biggest declines in prices (chart 16).
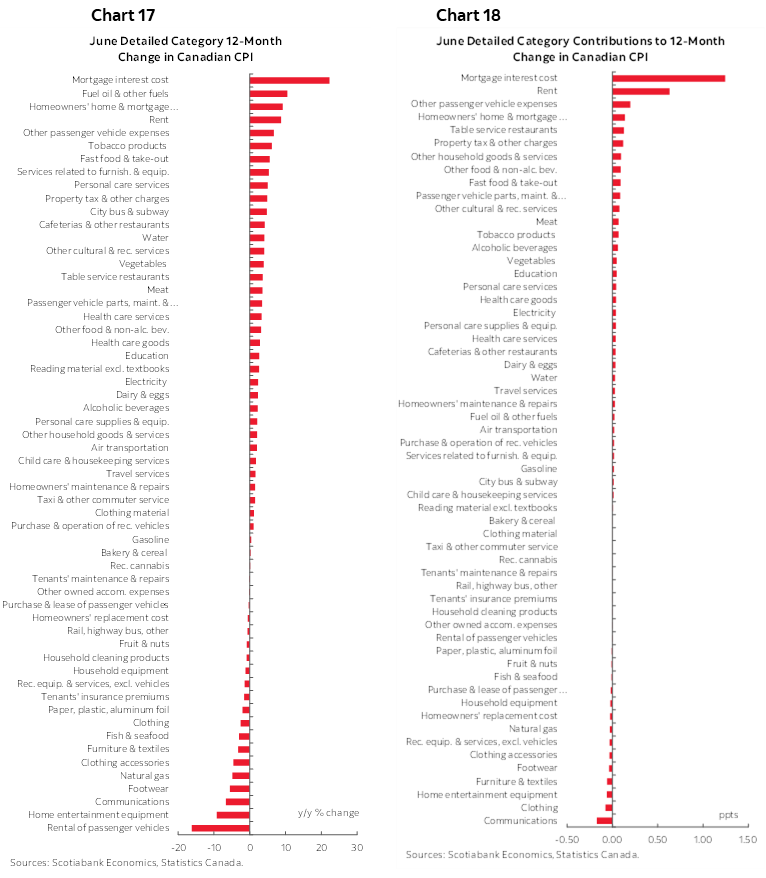
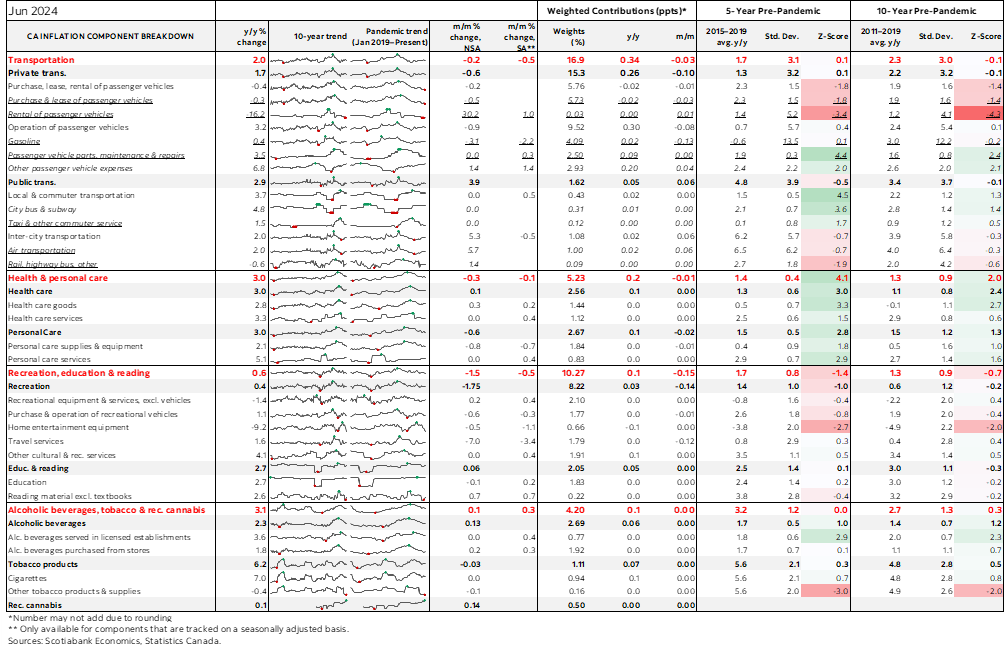
Charts 17and 18 provide the customary breakdown of the CPI basket in y/y terms both in raw unweighted terms and in terms of their weighted contributions to y/y total CPI inflation.
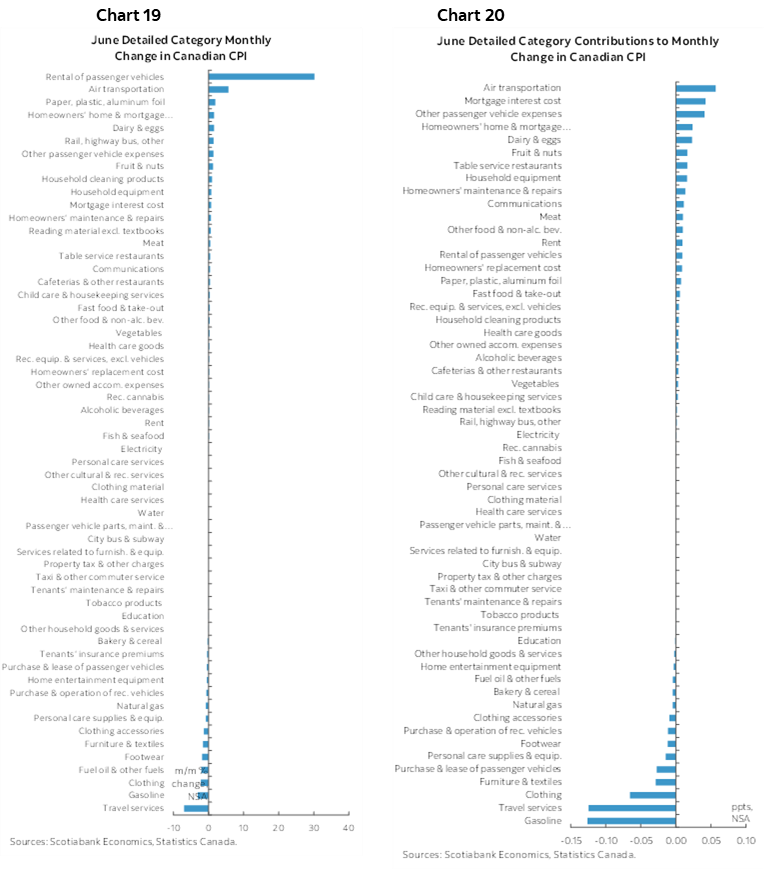
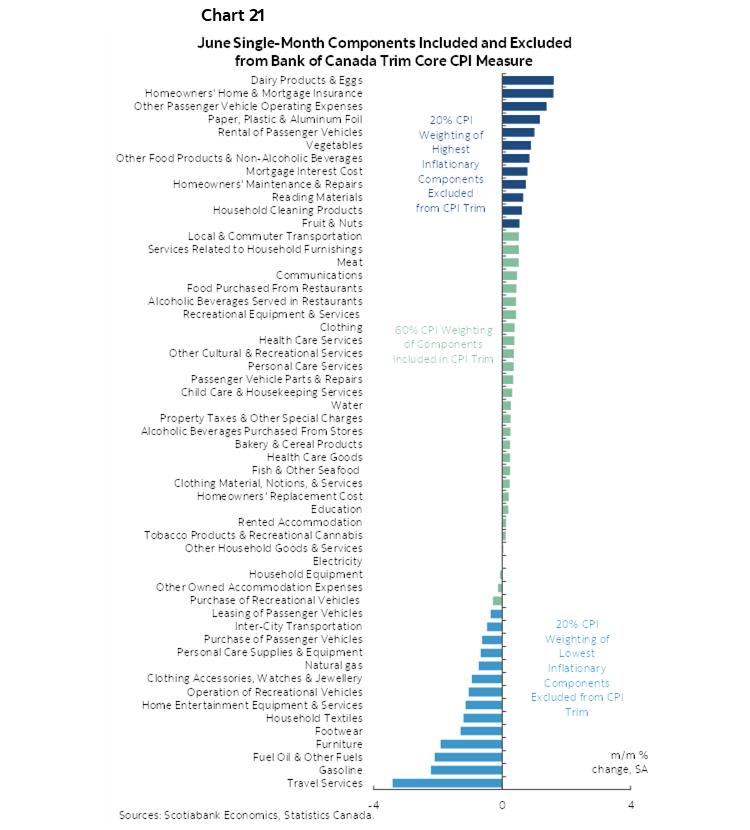
Charts 19 and 20 do likewise for m/m measures. Chart 21 shows what was in and out of the this month’s m/m trimmed mean CPI calculation.
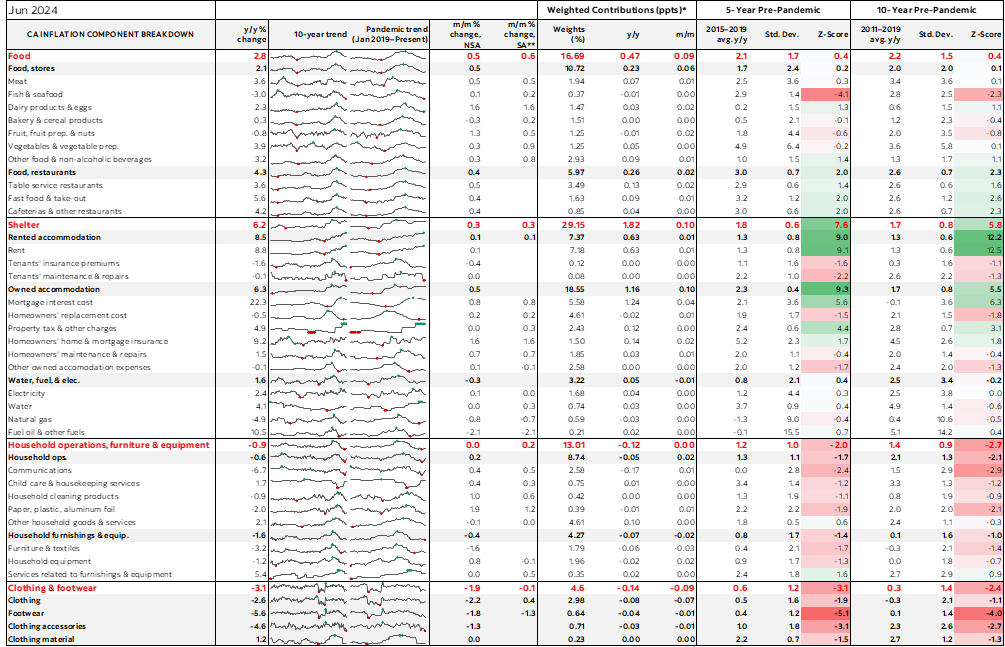
Please also see the appendix for a more detailed breakdown of the CPI basket including micro charts for components and z-scores.
Bank of Canada Implications
The BoC delivers its next policy decision one week from tomorrow along with a full forecast update.
Are two hot back-to-back readings for the BoC’s preferred core gauges enough to derail another cut? I don't think so. It makes it a little more awkward for the BoC to cut in terms of data dependency. I maintain that the reason the BoC cut in June against Macklem’s advance guidance that he wanted “months” of additional evidence was a) to be the first of the G7 central banks to cut for bragging rights, and b) because they feared that if they didn’t cut then, they might not be able to if core inflation gauges snapped back as they have since the cut.
Several arguments work in favour of continued easing.
1. The BoC has relatively shifted toward its confidence that macroeconomic rebalancing will sustainably achieve 2% inflation into next year. We'll see, but that's their bias.
2. Macklem has sounded extremely dovish. Not close to the limit of undershooting the Fed and doesn't care about the currency while guiding that expecting "several" rate cuts is reasonable. I doubt he would have said that in reference to next year since we'll deal with that when we get there.
3. The BoC delivers fresh forecasts next week. After jumping the gun on a cut in June against his own guidance, to whiff when they present an updated forecast that targets achieving 2% would be pretty bizarre in terms of the lagging effects.
DISCLAIMER
This report has been prepared by Scotiabank Economics as a resource for the clients of Scotiabank. Opinions, estimates and projections contained herein are our own as of the date hereof and are subject to change without notice. The information and opinions contained herein have been compiled or arrived at from sources believed reliable but no representation or warranty, express or implied, is made as to their accuracy or completeness. Neither Scotiabank nor any of its officers, directors, partners, employees or affiliates accepts any liability whatsoever for any direct or consequential loss arising from any use of this report or its contents.
These reports are provided to you for informational purposes only. This report is not, and is not constructed as, an offer to sell or solicitation of any offer to buy any financial instrument, nor shall this report be construed as an opinion as to whether you should enter into any swap or trading strategy involving a swap or any other transaction. The information contained in this report is not intended to be, and does not constitute, a recommendation of a swap or trading strategy involving a swap within the meaning of U.S. Commodity Futures Trading Commission Regulation 23.434 and Appendix A thereto. This material is not intended to be individually tailored to your needs or characteristics and should not be viewed as a “call to action” or suggestion that you enter into a swap or trading strategy involving a swap or any other transaction. Scotiabank may engage in transactions in a manner inconsistent with the views discussed this report and may have positions, or be in the process of acquiring or disposing of positions, referred to in this report.
Scotiabank, its affiliates and any of their respective officers, directors and employees may from time to time take positions in currencies, act as managers, co-managers or underwriters of a public offering or act as principals or agents, deal in, own or act as market makers or advisors, brokers or commercial and/or investment bankers in relation to securities or related derivatives. As a result of these actions, Scotiabank may receive remuneration. All Scotiabank products and services are subject to the terms of applicable agreements and local regulations. Officers, directors and employees of Scotiabank and its affiliates may serve as directors of corporations.
Any securities discussed in this report may not be suitable for all investors. Scotiabank recommends that investors independently evaluate any issuer and security discussed in this report, and consult with any advisors they deem necessary prior to making any investment.
This report and all information, opinions and conclusions contained in it are protected by copyright. This information may not be reproduced without the prior express written consent of Scotiabank.
™ Trademark of The Bank of Nova Scotia. Used under license, where applicable.
Scotiabank, together with “Global Banking and Markets”, is a marketing name for the global corporate and investment banking and capital markets businesses of The Bank of Nova Scotia and certain of its affiliates in the countries where they operate, including; Scotiabank Europe plc; Scotiabank (Ireland) Designated Activity Company; Scotiabank Inverlat S.A., Institución de Banca Múltiple, Grupo Financiero Scotiabank Inverlat, Scotia Inverlat Casa de Bolsa, S.A. de C.V., Grupo Financiero Scotiabank Inverlat, Scotia Inverlat Derivados S.A. de C.V. – all members of the Scotiabank group and authorized users of the Scotiabank mark. The Bank of Nova Scotia is incorporated in Canada with limited liability and is authorised and regulated by the Office of the Superintendent of Financial Institutions Canada. The Bank of Nova Scotia is authorized by the UK Prudential Regulation Authority and is subject to regulation by the UK Financial Conduct Authority and limited regulation by the UK Prudential Regulation Authority. Details about the extent of The Bank of Nova Scotia's regulation by the UK Prudential Regulation Authority are available from us on request. Scotiabank Europe plc is authorized by the UK Prudential Regulation Authority and regulated by the UK Financial Conduct Authority and the UK Prudential Regulation Authority.
Scotiabank Inverlat, S.A., Scotia Inverlat Casa de Bolsa, S.A. de C.V, Grupo Financiero Scotiabank Inverlat, and Scotia Inverlat Derivados, S.A. de C.V., are each authorized and regulated by the Mexican financial authorities.
Not all products and services are offered in all jurisdictions. Services described are available in jurisdictions where permitted by law.