- US Q2 GDP grew faster than expected…
- ...but details were mixed…
- The US economy is still slowing as potential growth picks up
- Q2 Core PCE surprised higher…
- ...but probably due to early Q2 monthly revisions that may not alter the soft patch
- Other US data was generally constructive
- US Q2 GDP / core PCE, q/q SAAR %, SA:
- Actual: 2.8 /2.9
- Scotia: 2.0/ 2.7
- Consensus: 2.0 / 2.7
- Prior:1.4 / 3.7 unchanged
Stronger than expected US GDP growth is welcome, but not narrative busting for the Fed’s path to easing. Nor is an upside surprise on Q2 core PCE. I’ll explain why along with the details.
Core PCE Surprises Higher
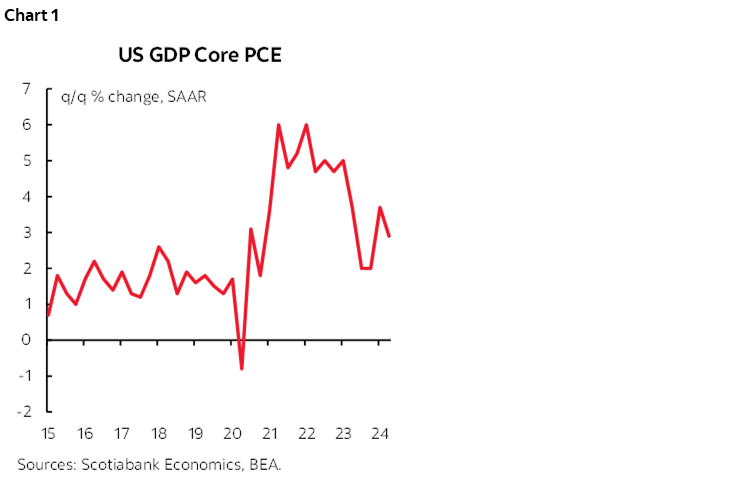
Q2 core PCE inflation was hotter than expected at 2.9% q/q SAAR (2.7% consensus and Scotia). This must be due to monthly revisions, but we’ll find out for sure tomorrow. If there were no revisions to available data up to May, then June core PCE would have to be up by about 0.35% m/m SA which seems implausible given what we know about core CPI that was only 0.06% m/m SA higher. Q1 core PCE was not revised at 3.7% and so it must be that we’ll find out that April and/or May were both firmer than the 0.26% m/m and 0.08% m/m reported readings respectively.
Depending upon the revisions and the exact June print, the soft patch for US core PCE inflation on a monthly basis may very well lie intact. Also, core PCE is well off the peak rates of increase (chart 1). Further, as excess demand conditions in the economy and labour market ebb, there is likely to be less core inflation pressure on a go-forward trend basis. That turns the focus to GDP as an input to assessing the evolution of excess demand conditions in the US economy.
US Q2 GDP Beats
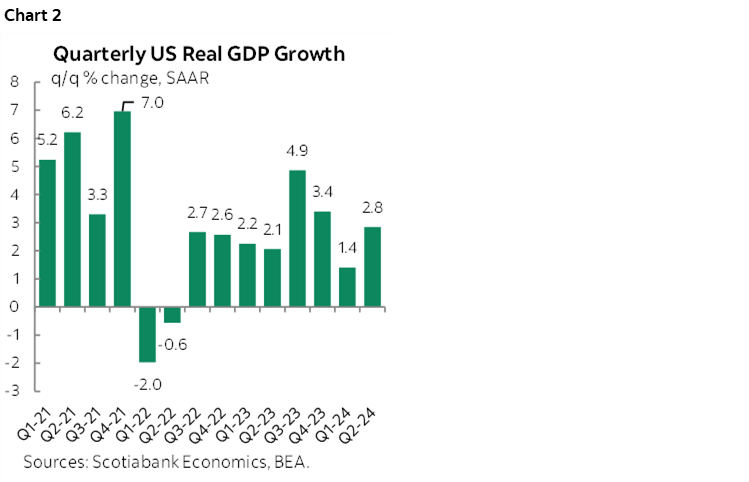
US Q2 GDP was stronger than expected at 2.8% q/q SAAR (consensus and Scotia 2.0%). That’s welcome from a growth standpoint (chart 2).
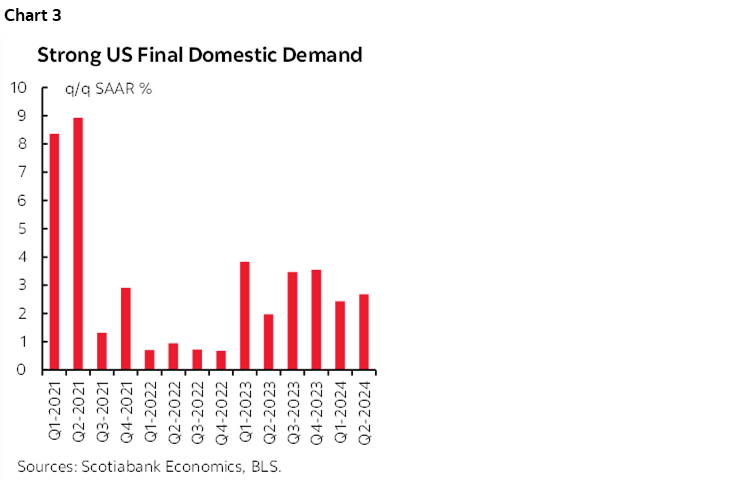
Final domestic demand also grew at a decent clip (chart 3).
Weighted contributions to growth are shown in chart 4. The details were not all rosy. Consumption added 1.6 percentage points to growth mostly due to services (1%) as goods spending added 0.55 ppts to GDP growth.
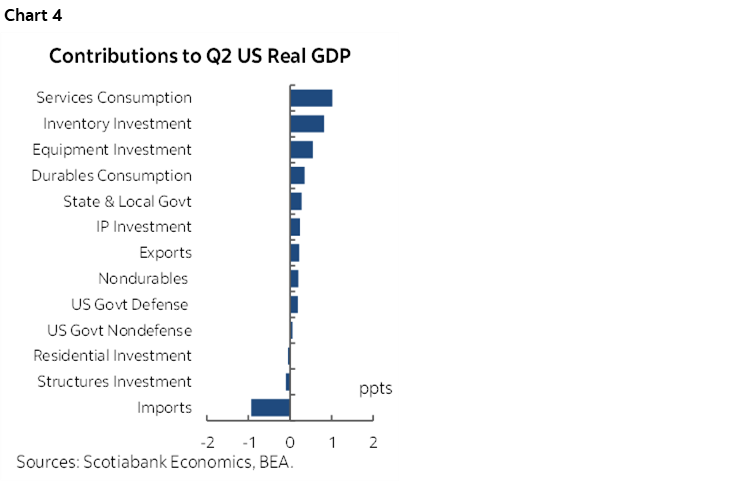
Inventories added 0.8 ppts to growth for the biggest addition since 2023Q3.
Government spending added 0.5 ppts split equally between federal versus state and local governments.
Net trade was a 0.7 ppts drag on GDP growth as exports only added 0.2 ppts and imports dragged 0.9 ppts off of GDP growth through more of an import leakage effect (higher imports, more of a pull effect from domestic demand partly dollar driven).
Investment added 1.5 ppts to growth entirely on the business side as residential investment was flat. Business investment came through a 0.55 ppt contribution to GDP growth due to higher equipment spending as spending on structures was a small drag that knocked 0.1 ppt off of GDP growth.
Other Data Was Constructive
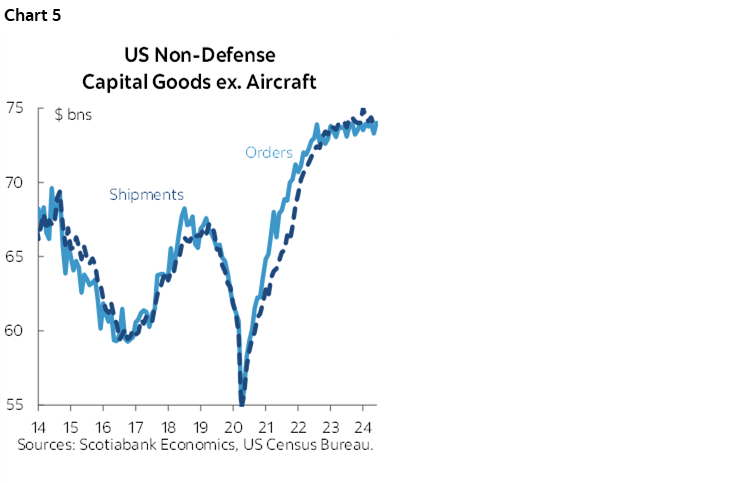
Durable goods orders fell –6.6% m/m SA but entirely due to transportation. Ex-transportation orders were up 0.5% m/m. Core capital goods orders excluding aircraft and defence—a proxy for underlying equipment investment—were up 1% m/m in June from a downwardly revised –0.9% dip in May (previously –0.6%). That leaves the trend in core capital goods orders still looking toppish at high levels (chart 5).
Weekly initial jobless claims pulled back a bit from the prior week’s jump. They were at 235k last week, down from 245k the prior week which was upu from 223k for the week including July 4th. The pattern marginally supports the notion that claims ebbed during the holiday week, then pent-up filings increased, and now we’re pulling back. The data is seasonally adjusted, but doesn’t necessarily compensate for the shifting timing of the July 4th holiday and its proximity to weekends from year to year.
All of Which May Change Nothing for the Fed
I don't think the GDP figures change anything for the Fed. It's still a marked slowdown from 4.9% in Q3 last year and 3.4% in Q4 to go to 1.4% in Q1 and 2.8% in Q2. Further, Chair Powell will repeat that the supply side has picked up with population growth of about 3.5 million in each of the past two years including undocumented workers and trend productivity.
At 1.6% q/q SAAR on average in H1, the US economy is probably growing below potential this year which is how Powell is likely to play it.
We’re therefore left no further ahead or behind on the path to the September meeting in my opinion. We need to see further reports on inflation and jobs in particular in order to more fully evaluate risks to the Fed’s dual mandate and hence the potential to deliver upon our September rate cut call.
DISCLAIMER
This report has been prepared by Scotiabank Economics as a resource for the clients of Scotiabank. Opinions, estimates and projections contained herein are our own as of the date hereof and are subject to change without notice. The information and opinions contained herein have been compiled or arrived at from sources believed reliable but no representation or warranty, express or implied, is made as to their accuracy or completeness. Neither Scotiabank nor any of its officers, directors, partners, employees or affiliates accepts any liability whatsoever for any direct or consequential loss arising from any use of this report or its contents.
These reports are provided to you for informational purposes only. This report is not, and is not constructed as, an offer to sell or solicitation of any offer to buy any financial instrument, nor shall this report be construed as an opinion as to whether you should enter into any swap or trading strategy involving a swap or any other transaction. The information contained in this report is not intended to be, and does not constitute, a recommendation of a swap or trading strategy involving a swap within the meaning of U.S. Commodity Futures Trading Commission Regulation 23.434 and Appendix A thereto. This material is not intended to be individually tailored to your needs or characteristics and should not be viewed as a “call to action” or suggestion that you enter into a swap or trading strategy involving a swap or any other transaction. Scotiabank may engage in transactions in a manner inconsistent with the views discussed this report and may have positions, or be in the process of acquiring or disposing of positions, referred to in this report.
Scotiabank, its affiliates and any of their respective officers, directors and employees may from time to time take positions in currencies, act as managers, co-managers or underwriters of a public offering or act as principals or agents, deal in, own or act as market makers or advisors, brokers or commercial and/or investment bankers in relation to securities or related derivatives. As a result of these actions, Scotiabank may receive remuneration. All Scotiabank products and services are subject to the terms of applicable agreements and local regulations. Officers, directors and employees of Scotiabank and its affiliates may serve as directors of corporations.
Any securities discussed in this report may not be suitable for all investors. Scotiabank recommends that investors independently evaluate any issuer and security discussed in this report, and consult with any advisors they deem necessary prior to making any investment.
This report and all information, opinions and conclusions contained in it are protected by copyright. This information may not be reproduced without the prior express written consent of Scotiabank.
™ Trademark of The Bank of Nova Scotia. Used under license, where applicable.
Scotiabank, together with “Global Banking and Markets”, is a marketing name for the global corporate and investment banking and capital markets businesses of The Bank of Nova Scotia and certain of its affiliates in the countries where they operate, including; Scotiabank Europe plc; Scotiabank (Ireland) Designated Activity Company; Scotiabank Inverlat S.A., Institución de Banca Múltiple, Grupo Financiero Scotiabank Inverlat, Scotia Inverlat Casa de Bolsa, S.A. de C.V., Grupo Financiero Scotiabank Inverlat, Scotia Inverlat Derivados S.A. de C.V. – all members of the Scotiabank group and authorized users of the Scotiabank mark. The Bank of Nova Scotia is incorporated in Canada with limited liability and is authorised and regulated by the Office of the Superintendent of Financial Institutions Canada. The Bank of Nova Scotia is authorized by the UK Prudential Regulation Authority and is subject to regulation by the UK Financial Conduct Authority and limited regulation by the UK Prudential Regulation Authority. Details about the extent of The Bank of Nova Scotia's regulation by the UK Prudential Regulation Authority are available from us on request. Scotiabank Europe plc is authorized by the UK Prudential Regulation Authority and regulated by the UK Financial Conduct Authority and the UK Prudential Regulation Authority.
Scotiabank Inverlat, S.A., Scotia Inverlat Casa de Bolsa, S.A. de C.V, Grupo Financiero Scotiabank Inverlat, and Scotia Inverlat Derivados, S.A. de C.V., are each authorized and regulated by the Mexican financial authorities.
Not all products and services are offered in all jurisdictions. Services described are available in jurisdictions where permitted by law.