- Fewer jobs for youths drove flat employment...
- ...as job growth was solid for 25+
- Wage growth is sharply accelerating against the BoC’s narrative
- Temps are driving unemployment higher and hitting youths the hardest…
- ...but Canada won’t be curtailing their numbers for at least a while yet
- July’s BoC decision is still open-ended
- Canadian jobs m/m 000s // UR %, June, SA:
- Actual: -1.4 / 6.4
- Scotia: +25 / 6.4
- Consensus: 25 / 6.3
- Prior: 26.7 / 6.2
Summary
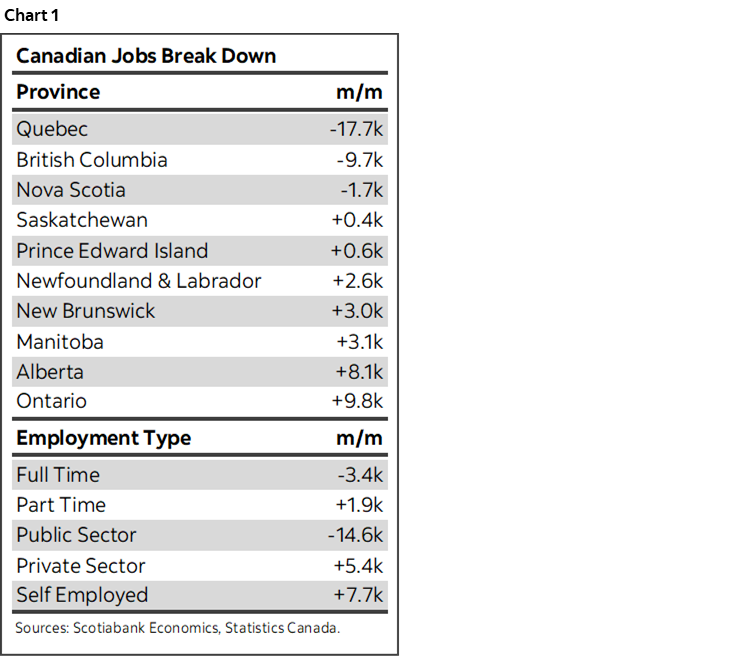
This was a better report than markets understood. Jobs were flat (-1.4k m/m) with a 95% confidence interval of anywhere between about –58k and +55k. Job growth slowed because the prior month’s surge of youth employment was reversed. All of us in consensus went too high on job growth estimates because we underestimated the volatility in that youth category. ‘Adult’ employment nevertheless posted a healthy gain alongside another very hot month for wage growth that challenges Governor Macklem’s contention that wage growth is slowing. Excessive population growth particularly in the temps category is responsible for a rising unemployment rate and it is of no service to anyone to candy coat this fact. Hours worked signal solid Q2 GDP growth but deliver a tentative early warning sign for the way the monthly GDP figures ended Q2 and transitioned to Q3. Chart 1 provides a few high level details.
Markets overreacted in my opinion. They saw the flat headline reading and asked no further questions while piling into the front-end in favour of easing bets. The 2-year Canada yield rallied by 5–6bps post data, 10s rallied by 3–4bps and the Canadian dollar slightly depreciated.
Pricing for the BoC’s July decision added an extra 2bps to now sit at about 14bps of a quarter point reduction.
Wage Growth is Accelerating
Average hourly wages of permanent employees were up by 6.6% m/m SAAR for another hot month after climbed by 8.5% the prior month (chart 2). The pressures at the margin were enough to pop the year-over-year pace of wage growth up to 5.6% from 5.2% the prior month.
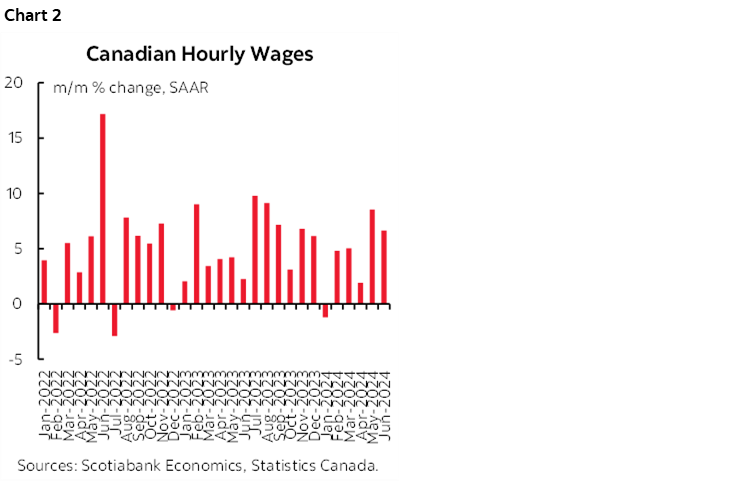
Governor Macklem’s recent speech claimed wage growth was slowing. Not so. I went into the various measures in last week’s Global Week Ahead to shed contrasting light on the issue, and this morning’s wage figures only add to my skepticism.
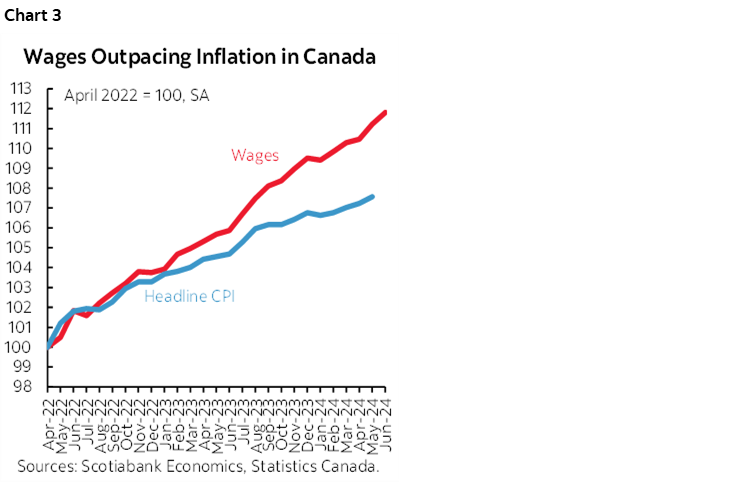
Some say wage growth is a lagging indicator in response to the surge of inflation during the pandemic. I say be careful. For one thing, wages have been outpacing inflation throughout the surge of inflation and not just in response (chart 3). Real wage growth is accelerating in Canada rather than an alternative narrative that would have you believe that wages are merely keeping pace with inflation or even falling behind. For another thing, the collective bargaining cycle still has a long way to go with many more workers facing negotiations over the next 2–3 years and the wage gains in their agreements to date are only just starting to trickle into the wage data. That’s the lag in a workforce that has triple the unionization rate of the US (about 30% versus 10%). For another, these are gains that are not deserved at least in terms of what is necessary to support them over time which is productivity growth. In Canada’s case, there isn’t any!
Youths Drove the Weakness As Youth Unemployment is a Serious Growing Problem
Blame the youths category. Or at least the way Statcan captures their employment situation. They were the culprits behind the headline employment weakness (chart 4). Youth employment (aged 15–24) fell by 24k.
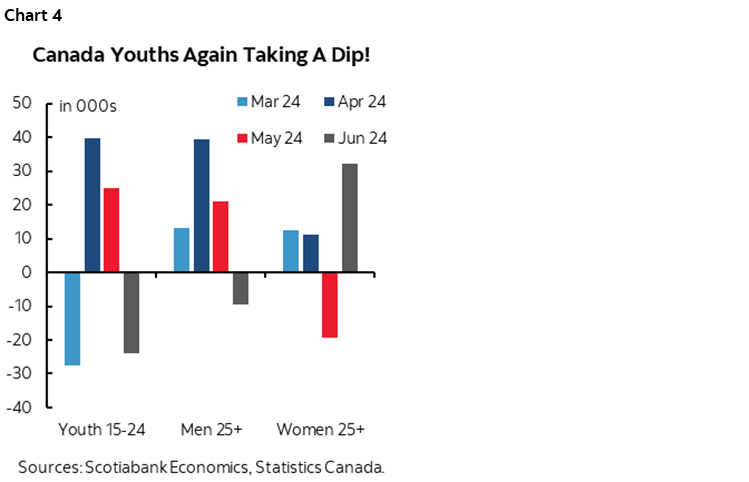
Statcan noted that the youth unemployment rate is up by 3.8 ppts over the past year and the employment rate for returning students aged 15–24 is 46.8% for the lowest rate in twenty-six years. Some believe that this challenge is at least partly driven by the surge of temporary residents that are more likely to compete for the types of jobs that youths would ordinarily target.
This concerns me a great deal. These are formative years during which early employment experiences can matter over the longer haul. Idle youth can be a big social challenge and I see signs of this rising tension. It’s an unfortunate own goal that I’ll come back to in the next section. Housing affordability pressures and a deteriorating job market for young people represent a political powder keg for political parties reliant upon their support.
By contrast, employment for those aged 25+ was up by 23k and led by women. Folks, youth employment is important, but it’s the 25+ category that pays most of the bills especially on key things like mortgages. That’s a strong silver lining to the overall report.
Temps Keep Driving Unemployment Higher
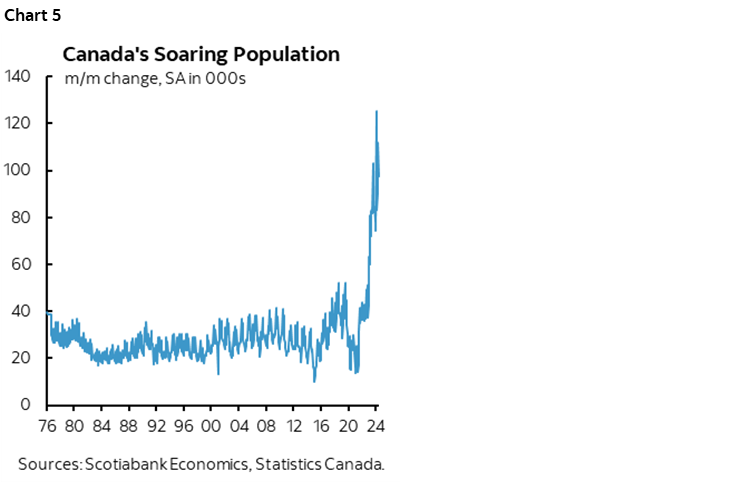
The unemployment rate increased to 6.4% from 6.2% because labour force expansion exceeded job growth as I had broadly expected. Population was up by another 99k in June over May and is just ridiculously off the charts (chart 5). Population is up by 1.1 million people year-over-year as housing affordability pressures mount, rent is soaring, classrooms are getting packed and ERs are clogged. A+ Canada... That drove a 40k rise in the size of the labour force that measures folks searching for work. Since few of them got it in aggregate given the flat headline job print, the UR edged up. Key is why.
On that note, Canada cannot curtail the temp or non-permanent resident category of immigration soon enough! They account for the biggest share of the run-up in the Canadian unemployment rate. Chart 6 shows the weighted contributions to the rise in the unemployment rate since the start of 2022 by category of resident. The born in Canada component has put mild downward pressure on the national unemployment rate in weighted terms, and so have landed/permanent residents. It’s the temps who are coming into Canada in excessive numbers that are driving the unemployment rate higher. The temps category is made up of international students, temporary foreign workers like in the agricultural sector etc, and asylum seekers mainly from Ukraine and Syria.
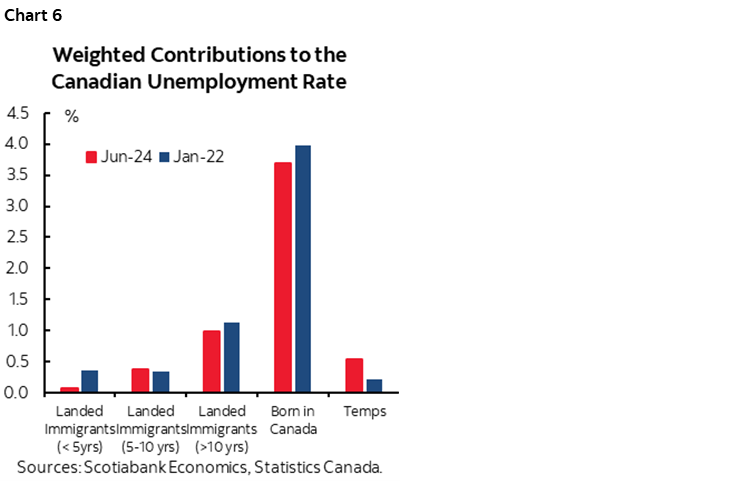
Canada is still taking on far too many people in this category and this will persist until at least later this year. If the Federal government and provinces do not reach agreement on curtailing this category as announced and do so soon then the unemployment rate is likely to keep rising.
Hours Worked Sending Mixed Signals
Total hours worked were down –0.4% m/m in June. This follows a flat reading in May and a strong 0.8% jump in April. Hours worked are providing a cautionary sign in terms of May and particularly June GDP growth given that GDP is an identity defined as hours times labour productivity which is hardly Canada’s strong suit.
And yet smoothing through the month-to-month job noise reveals that hours worked were up 2.2% q/q SAAR in Q2 (chart 7). That’s a decent signal for GDP growth.
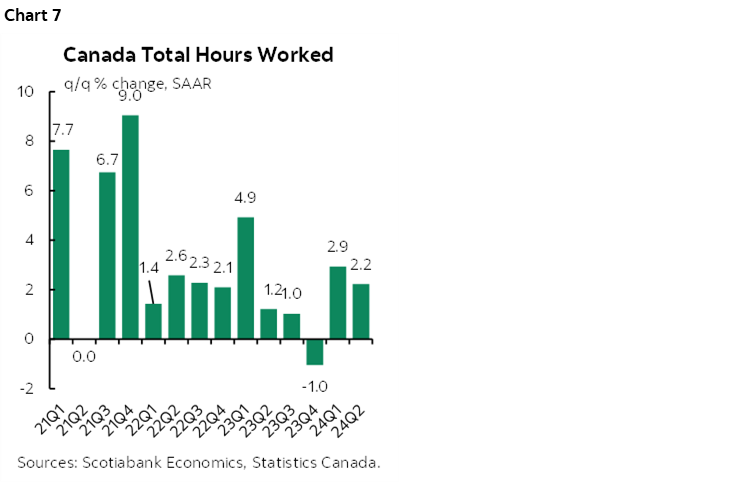
The rub lies in the fact that Q3 tracking is on its back foot before we get any Q3 data. Because of the drop in hours worked during June and the way the Q2 average evolved, Q3 hours worked have a baked in retreat of about 1.1% q/q SAAR. Obviously that’s extremely tentative until we get actual data for July through September, but Canada would need significant gains in hours worked over that stretch in order to stay in the black on hours and maybe GDP as well for the same reason as above.
Job Breadth Was Ok
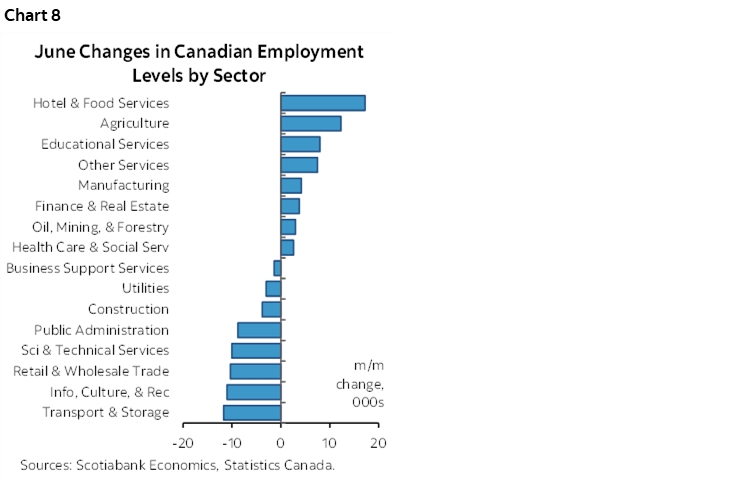
Ok. Not great. Chart 8 shows the break down of the change in employment by sector. It was a nearly evenly split between the ups and downs which is why the headline was roughly flat.
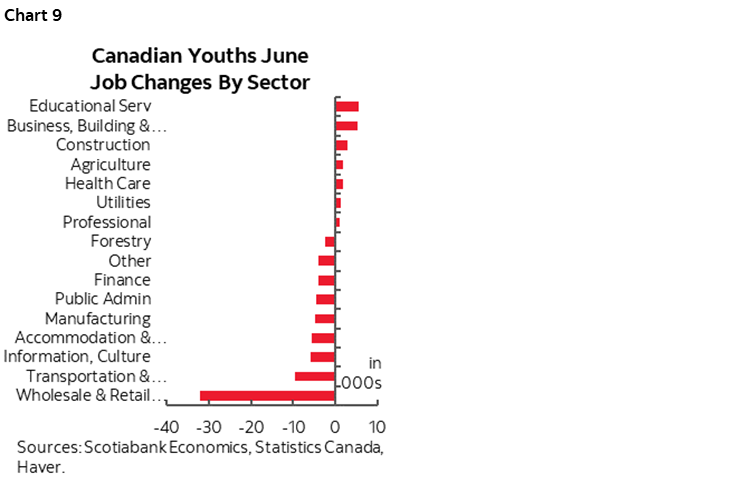
Here too, blame the youths category for the sector breadth. Chart 9 breaks down the change in employment across sectors for those aged <25. It was a more lopsided set of declines than the aggregate picture.
Bank of Canada Implications
So how do you play this into the BoC’s July 24th decision? I don’t think this report really affects much to be honest. What Macklem chooses to emphasize in its details is up to him and his staff who tend to cherry-pick in my opinion, but I think the details provide more cautions against easing rather than in favour.
And yet there are more important points to consider. One is other data that we’ll get before the next decision. Key is CPI for June the week after next. If it’s another hot one after the strong core gauges in May then maybe Governing Council holds off. If it’s not, then they could say core has been soft for most of the year in m/m SAAR terms except for May and carry on cutting. The BoC’s business and household surveys including measures of inflation expectations the day before CPI could also be important.
Further, the BoC is convinced that it’s models will work this time after failing miserably throughout the pandemic. They adamantly believe that inflation will durably land on 2% into 2025 and recall that this expectation embeds an unknown and unpublished internal estimate of how much cutting Governing Council could deliver in advance. I think they shouldn’t be so confident since models have failed to capture myriad out of sample experiences over the pandemic era and they are created to achieve magical balance with everything working out just tickety boo within about a two year horizon, but the BoC is extremely model dependent. It’s their reaction function we need to go with for the shorter-term and then see how it all plays out for them over time.
A bigger point is that notwithstanding data risk into the next decision, I still think there is a high bar set against clipping Macklem’s dovish wings. He’s a dove, get over it, it’s clear as day. He lagged on the way up in denial of inflationary pressures while giving speeches on fully inclusive maximum employment and he cut at the first four month whiff of softening core inflation following a multi-year period of inflation mismanagement. He said it’s reasonable to expect several cuts which he presumably said in reference to the remainder of this year since who knows what next year will bring. He threw caution to the wind on the currency and said the BoC isn’t close to the limit of undershooting the Fed’s policy rate. I don’t believe that and think they are closer than he lets on and that Macklem would be a gusher of a nose bleed if USDCAD climbed anywhere close to some of the most bearish CAD forecasts out there.
So watch data, but be prepared for what the BoC will show in updated MPR forecasts 19 days from now, and bear in mind their bias through it all. Today’s labour market readings are just a relatively tiny part of it all.
DISCLAIMER
This report has been prepared by Scotiabank Economics as a resource for the clients of Scotiabank. Opinions, estimates and projections contained herein are our own as of the date hereof and are subject to change without notice. The information and opinions contained herein have been compiled or arrived at from sources believed reliable but no representation or warranty, express or implied, is made as to their accuracy or completeness. Neither Scotiabank nor any of its officers, directors, partners, employees or affiliates accepts any liability whatsoever for any direct or consequential loss arising from any use of this report or its contents.
These reports are provided to you for informational purposes only. This report is not, and is not constructed as, an offer to sell or solicitation of any offer to buy any financial instrument, nor shall this report be construed as an opinion as to whether you should enter into any swap or trading strategy involving a swap or any other transaction. The information contained in this report is not intended to be, and does not constitute, a recommendation of a swap or trading strategy involving a swap within the meaning of U.S. Commodity Futures Trading Commission Regulation 23.434 and Appendix A thereto. This material is not intended to be individually tailored to your needs or characteristics and should not be viewed as a “call to action” or suggestion that you enter into a swap or trading strategy involving a swap or any other transaction. Scotiabank may engage in transactions in a manner inconsistent with the views discussed this report and may have positions, or be in the process of acquiring or disposing of positions, referred to in this report.
Scotiabank, its affiliates and any of their respective officers, directors and employees may from time to time take positions in currencies, act as managers, co-managers or underwriters of a public offering or act as principals or agents, deal in, own or act as market makers or advisors, brokers or commercial and/or investment bankers in relation to securities or related derivatives. As a result of these actions, Scotiabank may receive remuneration. All Scotiabank products and services are subject to the terms of applicable agreements and local regulations. Officers, directors and employees of Scotiabank and its affiliates may serve as directors of corporations.
Any securities discussed in this report may not be suitable for all investors. Scotiabank recommends that investors independently evaluate any issuer and security discussed in this report, and consult with any advisors they deem necessary prior to making any investment.
This report and all information, opinions and conclusions contained in it are protected by copyright. This information may not be reproduced without the prior express written consent of Scotiabank.
™ Trademark of The Bank of Nova Scotia. Used under license, where applicable.
Scotiabank, together with “Global Banking and Markets”, is a marketing name for the global corporate and investment banking and capital markets businesses of The Bank of Nova Scotia and certain of its affiliates in the countries where they operate, including; Scotiabank Europe plc; Scotiabank (Ireland) Designated Activity Company; Scotiabank Inverlat S.A., Institución de Banca Múltiple, Grupo Financiero Scotiabank Inverlat, Scotia Inverlat Casa de Bolsa, S.A. de C.V., Grupo Financiero Scotiabank Inverlat, Scotia Inverlat Derivados S.A. de C.V. – all members of the Scotiabank group and authorized users of the Scotiabank mark. The Bank of Nova Scotia is incorporated in Canada with limited liability and is authorised and regulated by the Office of the Superintendent of Financial Institutions Canada. The Bank of Nova Scotia is authorized by the UK Prudential Regulation Authority and is subject to regulation by the UK Financial Conduct Authority and limited regulation by the UK Prudential Regulation Authority. Details about the extent of The Bank of Nova Scotia's regulation by the UK Prudential Regulation Authority are available from us on request. Scotiabank Europe plc is authorized by the UK Prudential Regulation Authority and regulated by the UK Financial Conduct Authority and the UK Prudential Regulation Authority.
Scotiabank Inverlat, S.A., Scotia Inverlat Casa de Bolsa, S.A. de C.V, Grupo Financiero Scotiabank Inverlat, and Scotia Inverlat Derivados, S.A. de C.V., are each authorized and regulated by the Mexican financial authorities.
Not all products and services are offered in all jurisdictions. Services described are available in jurisdictions where permitted by law.