- Job growth was in line with expectations…
- ...as public sector payrolls exploded
- Hours worked continue to suffer, likely due to temporary COVID effects
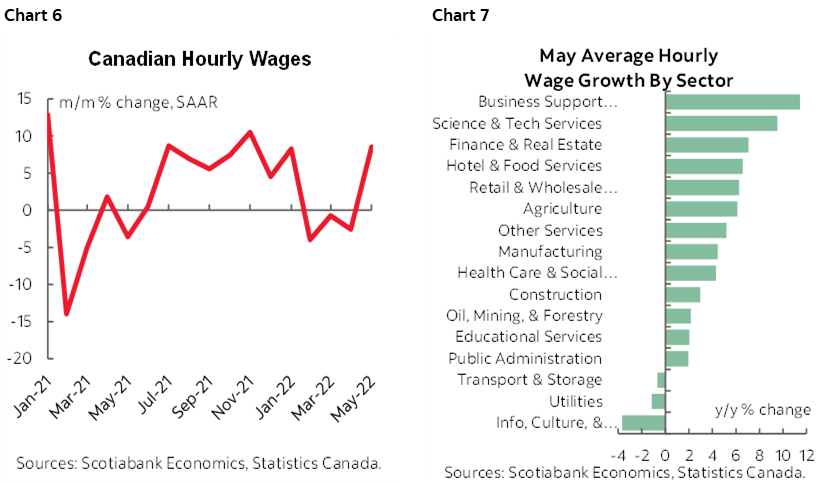
- Wage growth bounced back
- Reinforces hawkish BoC implications
CDN jobs / UR, m/m 000s // %, SA, May:
Actual: 39.8 / 5.1
Scotia: 50 / 5.1
Consensus: 27.5 / 5.2
Prior: 15.3 / 5.2
I’ll take a job gain that was close to my guesstimate especially given high sampling error around these figures, but it’s a dodgy achievement. The fact that private payroll employers hit the brakes on hiring last month is a significant dent to the quality of the overall employment gain but with uncertain drivers. Sickness continues to mess up hours worked, but the slide in reported wage growth halted in tightening labour markets which incrementally adds to the focus upon inflationary pressures. See the summary table.
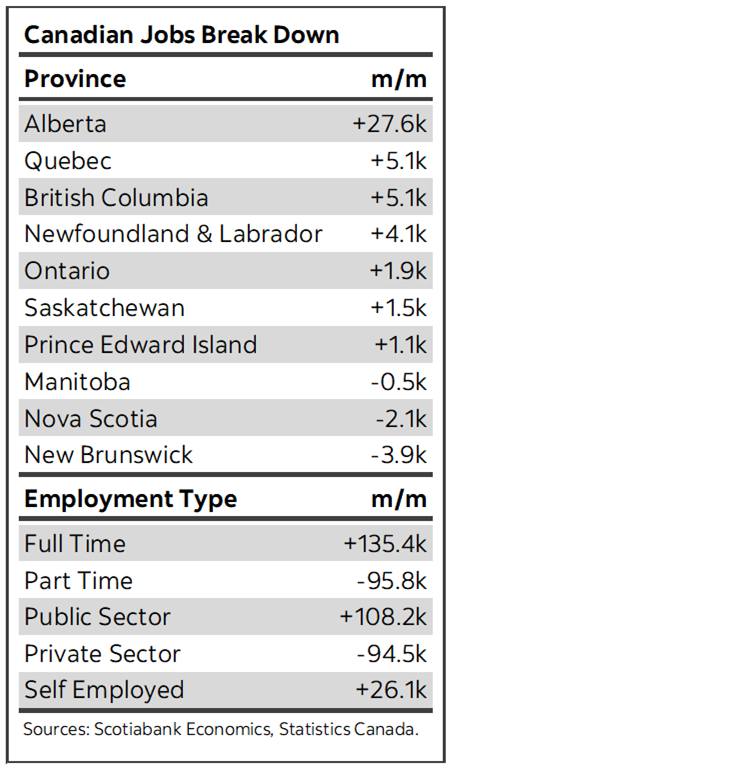
Total payroll jobs were up by only 13.6k but that was entirely due to a 108k gain in public sector payroll jobs. Private sector payroll employment fell by 94.5k. Public sector employment (+108k) was not driven by public administration (+4.5k) but at least some of it was driven by gains in education and health that must have nevertheless been held back by the private components to both of these sectors.
Self-employed jobs were also up by 26k. Many are valuable, highly productive forms of employment, but the self-reported aspect usually makes it soft data.
Total employment is now 497k higher than just before the pandemic struck. A half million more jobs than we had before all of this mess struck is further indication of labour market strengths in aggregate (chart 2). Chart 3 breaks down the cumulative changes in employment by sector to show where ongoing strengths and weaknesses persist.
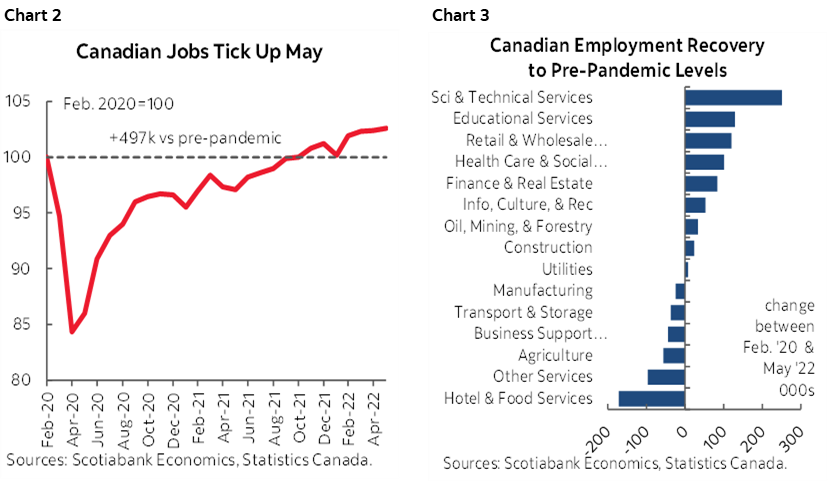
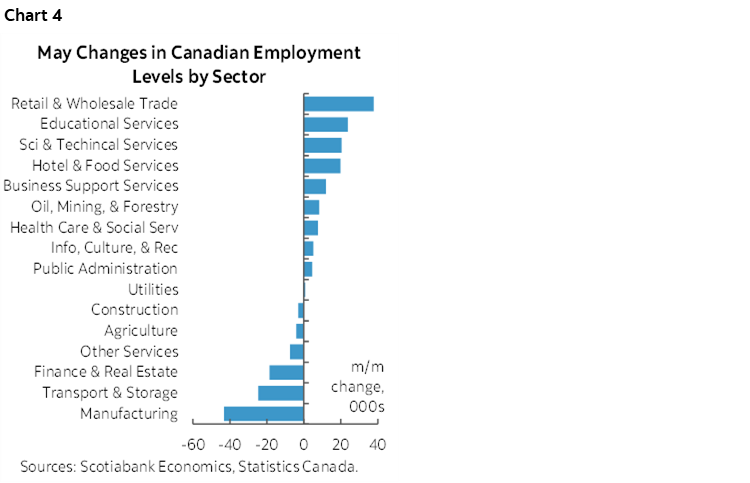
Chart 4 shows the breakdown of the change in jobs by sector. Here too the evidence was at best mixed. Goods sectors shed 41k jobs led by 43k fewer manufacturing jobs. Service jobs were up 81k led by sectors like wholesale/retail up 38k, education up 24k, health care up 24k, accommodation and food services up 20k and professional/scientific/technical up 21k. Down were jobs in transportation and warehousing (-25k), FIRE (-19k) and ‘other’ services (-7k). The aggregate gains in health and social services plus education don’t explain the big jump in public sector payrolls unless the private components of these sectors shed a fair number of jobs.
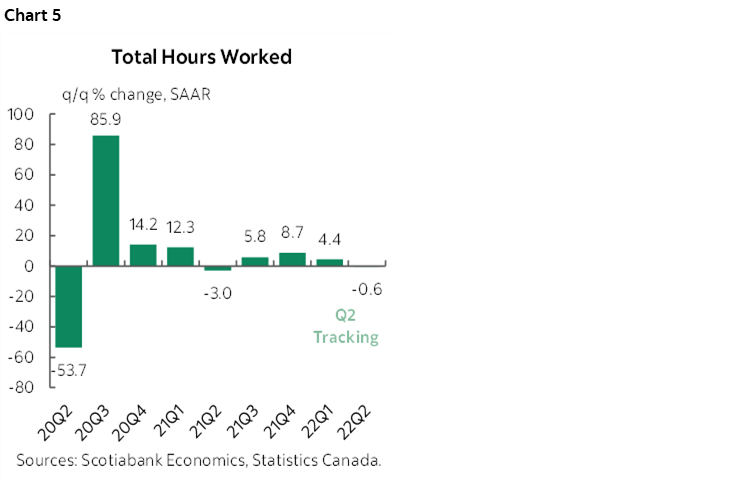
Hours worked were down 3.7% m/m SAAR which is more than Statcan’s “little changed” claim unless we’re looking at different data. This follows a 20.7% m/m annualized plunge the prior month versus massive gains of 16% in March and 52% in February. Sickness is likely the culprit here and so we should probably continue to treat it as transitory. Statcan reports that there was an 11.2% m/m NSA decline in hours lost during May that was attributable to ‘own illness or disability, away full week.”
Amid such noisy data, the smoothed pattern suggests growth in hours worked has stalled out; Q1 was up 4.4% q/q SAAR but Q2 is tracking 0.6% softer (chart 5). That, in turn, is a soft signal for GDP growth but could well be offset by activity readings that may buoy growth in labour productivity for a change. Still, if hours worked have been weak due to sickness and all of the evidence on COVID from hospitalizations through wastewater testing is pointing toward waning cases, then we may by corollary see hours worked rip higher in June-onward and take GDP up with it.
Wages accelerated (chart 6). They were up 4.9% m/m SAAR in May. That halts a three month skid that followed a string of powerful gains over the July to January period. I don’t think that can be attributable to announcements of one-off interim wage hikes by employers like banks because that did not take effect until this month (and just after the June reference week). Chart 7 shows the breakdown of wage growth in year-over-year terms by sector.
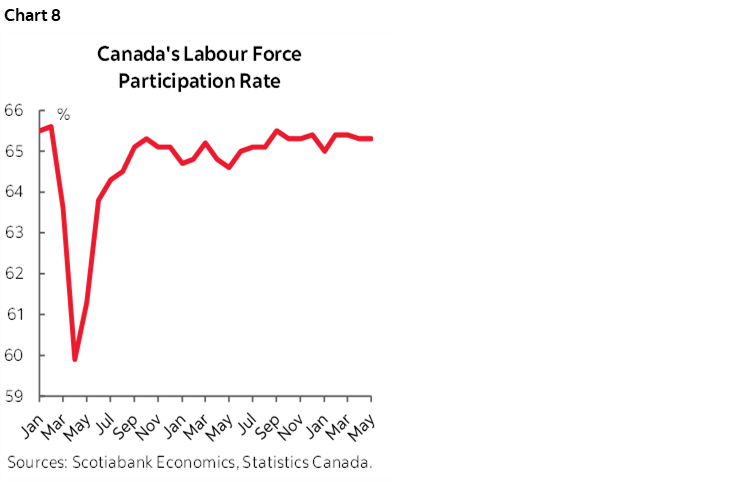
The unemployment rate edged a tenth lower to 5.1% because the job gain of about 40k was larger than the muted growth in the size of the labour force (~12k). That’s a new record low. The labour force participation rate stands at 65.3% which is unchanged and only three-tenths lower than before the pandemic.
As for Bank of Canada implications, I think they are scant to none by way of truly new information. They will be happy to see employment changes continuing to be on the plus side of the ledger albeit with some soft details, while probably looking through the sickness-driven hit on hours worked and GDP implications and they will probably also prefer to see further evidence on wage growth to inform their bias toward accelerating figures. Regardless, the BoC’s full focus is upon inflation. Full stop. In a Phillips curve sense, a future softening of labour market conditions through its effects on unemployment rates could assist the pursuit of lower and more stable inflation through monetary policy tightening, albeit that a pure Phillips curve approach is just one of many drivers of inflation these days. Canada’s overall job market remains in a state of full employment veering into excess demand.
DISCLAIMER
This report has been prepared by Scotiabank Economics as a resource for the clients of Scotiabank. Opinions, estimates and projections contained herein are our own as of the date hereof and are subject to change without notice. The information and opinions contained herein have been compiled or arrived at from sources believed reliable but no representation or warranty, express or implied, is made as to their accuracy or completeness. Neither Scotiabank nor any of its officers, directors, partners, employees or affiliates accepts any liability whatsoever for any direct or consequential loss arising from any use of this report or its contents.
These reports are provided to you for informational purposes only. This report is not, and is not constructed as, an offer to sell or solicitation of any offer to buy any financial instrument, nor shall this report be construed as an opinion as to whether you should enter into any swap or trading strategy involving a swap or any other transaction. The information contained in this report is not intended to be, and does not constitute, a recommendation of a swap or trading strategy involving a swap within the meaning of U.S. Commodity Futures Trading Commission Regulation 23.434 and Appendix A thereto. This material is not intended to be individually tailored to your needs or characteristics and should not be viewed as a “call to action” or suggestion that you enter into a swap or trading strategy involving a swap or any other transaction. Scotiabank may engage in transactions in a manner inconsistent with the views discussed this report and may have positions, or be in the process of acquiring or disposing of positions, referred to in this report.
Scotiabank, its affiliates and any of their respective officers, directors and employees may from time to time take positions in currencies, act as managers, co-managers or underwriters of a public offering or act as principals or agents, deal in, own or act as market makers or advisors, brokers or commercial and/or investment bankers in relation to securities or related derivatives. As a result of these actions, Scotiabank may receive remuneration. All Scotiabank products and services are subject to the terms of applicable agreements and local regulations. Officers, directors and employees of Scotiabank and its affiliates may serve as directors of corporations.
Any securities discussed in this report may not be suitable for all investors. Scotiabank recommends that investors independently evaluate any issuer and security discussed in this report, and consult with any advisors they deem necessary prior to making any investment.
This report and all information, opinions and conclusions contained in it are protected by copyright. This information may not be reproduced without the prior express written consent of Scotiabank.
™ Trademark of The Bank of Nova Scotia. Used under license, where applicable.
Scotiabank, together with “Global Banking and Markets”, is a marketing name for the global corporate and investment banking and capital markets businesses of The Bank of Nova Scotia and certain of its affiliates in the countries where they operate, including; Scotiabank Europe plc; Scotiabank (Ireland) Designated Activity Company; Scotiabank Inverlat S.A., Institución de Banca Múltiple, Grupo Financiero Scotiabank Inverlat, Scotia Inverlat Casa de Bolsa, S.A. de C.V., Grupo Financiero Scotiabank Inverlat, Scotia Inverlat Derivados S.A. de C.V. – all members of the Scotiabank group and authorized users of the Scotiabank mark. The Bank of Nova Scotia is incorporated in Canada with limited liability and is authorised and regulated by the Office of the Superintendent of Financial Institutions Canada. The Bank of Nova Scotia is authorized by the UK Prudential Regulation Authority and is subject to regulation by the UK Financial Conduct Authority and limited regulation by the UK Prudential Regulation Authority. Details about the extent of The Bank of Nova Scotia's regulation by the UK Prudential Regulation Authority are available from us on request. Scotiabank Europe plc is authorized by the UK Prudential Regulation Authority and regulated by the UK Financial Conduct Authority and the UK Prudential Regulation Authority.
Scotiabank Inverlat, S.A., Scotia Inverlat Casa de Bolsa, S.A. de C.V, Grupo Financiero Scotiabank Inverlat, and Scotia Inverlat Derivados, S.A. de C.V., are each authorized and regulated by the Mexican financial authorities.
Not all products and services are offered in all jurisdictions. Services described are available in jurisdictions where permitted by law.