- Markets react modestly to soft US core PCE inflation
- Markets largely ignored Canadian GDP
- Canadian GDP, m/m % change, April, SA:
- Actual: 0.3
- Scotia: 0.4
- Consensus: 0.3
- Prior: 0.0
- May GDP ‘flash’ guidance: 0.1
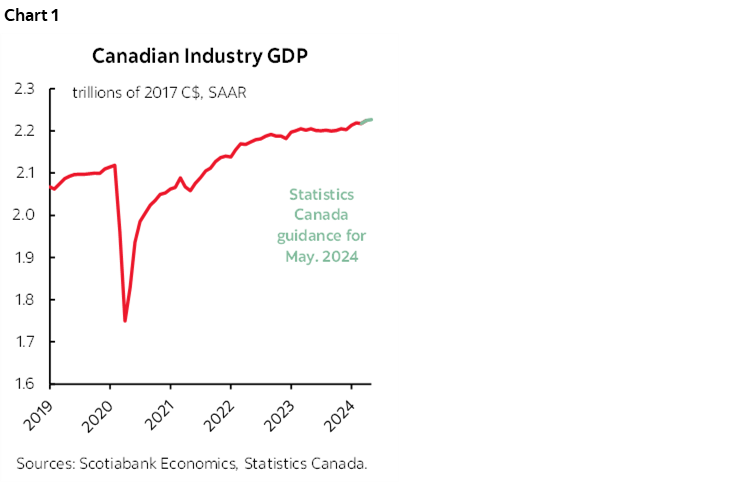
Canada’s economy offered few surprises except perhaps to the chronic over supply of Canada bears. The economy continues to expand with GDP up in four of five months with one flat print this year. Growth could always be better but chart 1 is out of sync with so much of the popular commentary from Canada bears.
The absence of material surprises has Canadian markets generally following the US tone in the wake of soft core PCE inflation (see below). CAD is flat to the USD on the day.
Canadian GDP Details
Growth of 0.3% m/m SA in April matched Statcan’s prior flash guidance based upon partial sampling. The initial ‘flash’ reading for the month of May points to modest growth of 0.1% m/m SA.
Using the monthly production-side GDP accounts, Q2 GDP is tracking growth of about 1¾% q/q SAAR (chart 2) using known numbers to May and assuming June is flat solely for the purpose of evaluating what we know so far without imposing arbitrary judgement on June GDP in either direction when we have nothing to go by thus far.
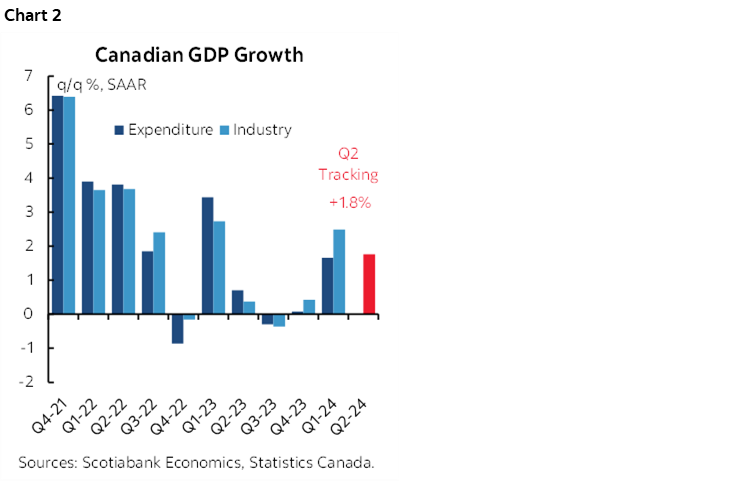
What chart 2 also shows but not yet for Q2 is GDP growth using expenditure-based GDP accounts that also consider effects like inventory swings and more fully capture net trade.
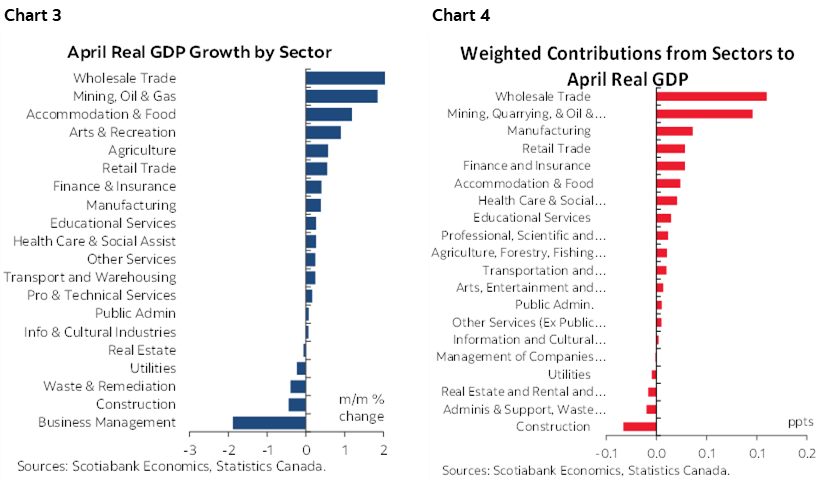
Charts 3 and 4 show a breakdown of April GDP growth by sector in unweighted and weighted contribution to overall GDP growth terms. There was significant breadth to the growth during April.
There are no details or break downs ever provided for the preliminary reading for Canadian GDP in May, but Statcan guidance for May GDP is as follows: "Increases in manufacturing, real estate and rental and leasing and finance and insurance were partially offset by decreases in retail trade and wholesale trade."
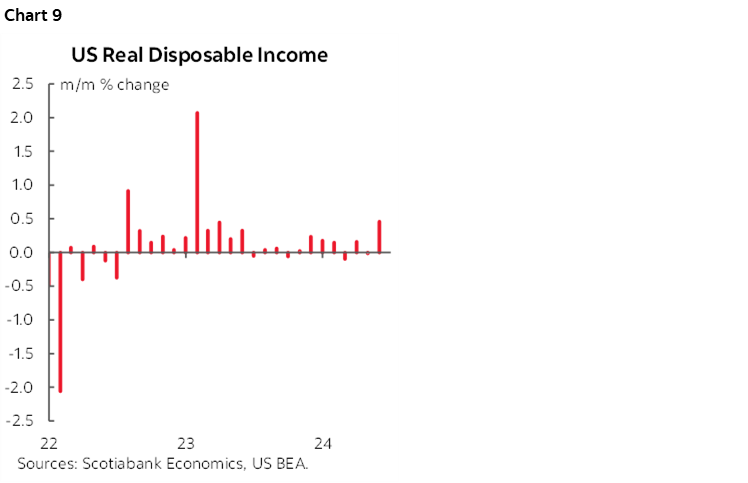
US Core PCE Inflation Was Soft, More Needed
US core PCE was little changed at 0.08% m/m SA to be exact, so the lighter side of 0.1 but rounded up on screens. Since this follows a trio of 0.3% m/m gains and 0.5% to start the year, the FOMC will require more evidence than just one report. There are three more CPI and two more PCE reports before the September 18th FOMC. See charts 5–9.
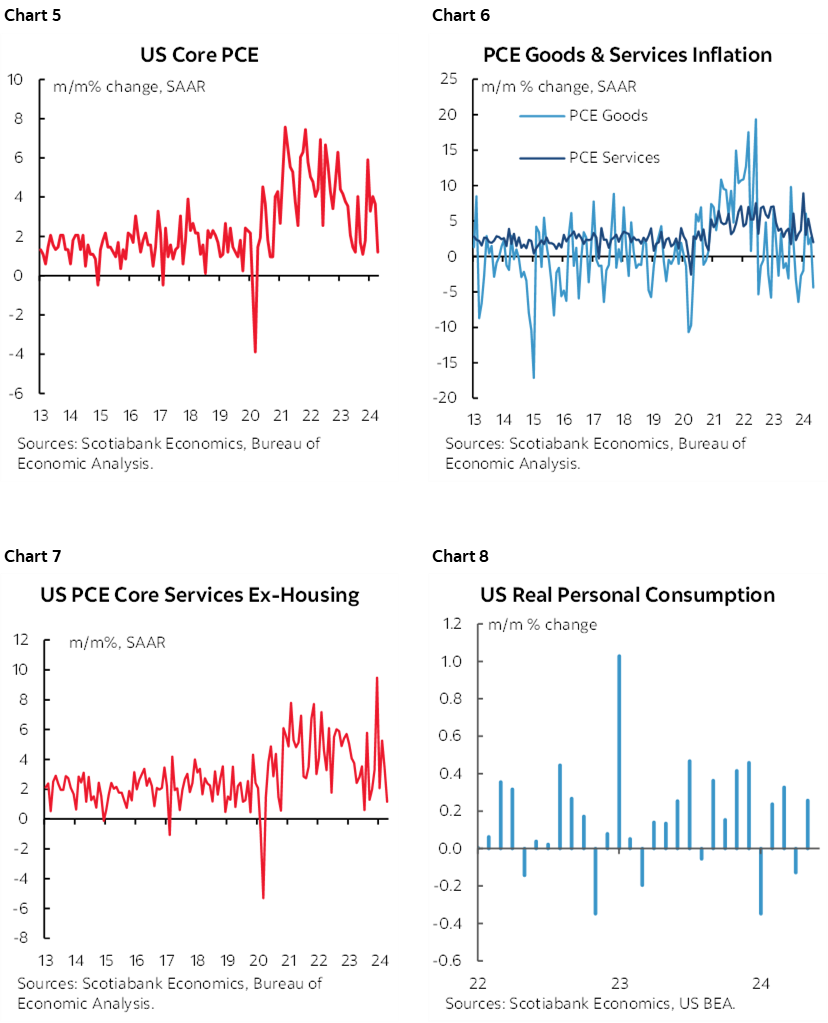
US nominal consumption was soft (0.2% m/m, 0.3% consensus) with a small downward revision to 0.1% m/m prior (from 0.2%). Real consumption was up 0.3% m/m which is solid. US real consumption is tracking only 1.4% q/q SAAR growth in Q2 based on data to May and assuming June is flat only to focus the math upon the effects of what we know so far without tilting the bias in either direction on June. Auto sales worry me for June spending. Industry tracking was already soft for sales before the CDK hack that seems to have had a sharp impact on dealers. I went with a m/m SA drop of over 6% for sales.
DISCLAIMER
This report has been prepared by Scotiabank Economics as a resource for the clients of Scotiabank. Opinions, estimates and projections contained herein are our own as of the date hereof and are subject to change without notice. The information and opinions contained herein have been compiled or arrived at from sources believed reliable but no representation or warranty, express or implied, is made as to their accuracy or completeness. Neither Scotiabank nor any of its officers, directors, partners, employees or affiliates accepts any liability whatsoever for any direct or consequential loss arising from any use of this report or its contents.
These reports are provided to you for informational purposes only. This report is not, and is not constructed as, an offer to sell or solicitation of any offer to buy any financial instrument, nor shall this report be construed as an opinion as to whether you should enter into any swap or trading strategy involving a swap or any other transaction. The information contained in this report is not intended to be, and does not constitute, a recommendation of a swap or trading strategy involving a swap within the meaning of U.S. Commodity Futures Trading Commission Regulation 23.434 and Appendix A thereto. This material is not intended to be individually tailored to your needs or characteristics and should not be viewed as a “call to action” or suggestion that you enter into a swap or trading strategy involving a swap or any other transaction. Scotiabank may engage in transactions in a manner inconsistent with the views discussed this report and may have positions, or be in the process of acquiring or disposing of positions, referred to in this report.
Scotiabank, its affiliates and any of their respective officers, directors and employees may from time to time take positions in currencies, act as managers, co-managers or underwriters of a public offering or act as principals or agents, deal in, own or act as market makers or advisors, brokers or commercial and/or investment bankers in relation to securities or related derivatives. As a result of these actions, Scotiabank may receive remuneration. All Scotiabank products and services are subject to the terms of applicable agreements and local regulations. Officers, directors and employees of Scotiabank and its affiliates may serve as directors of corporations.
Any securities discussed in this report may not be suitable for all investors. Scotiabank recommends that investors independently evaluate any issuer and security discussed in this report, and consult with any advisors they deem necessary prior to making any investment.
This report and all information, opinions and conclusions contained in it are protected by copyright. This information may not be reproduced without the prior express written consent of Scotiabank.
™ Trademark of The Bank of Nova Scotia. Used under license, where applicable.
Scotiabank, together with “Global Banking and Markets”, is a marketing name for the global corporate and investment banking and capital markets businesses of The Bank of Nova Scotia and certain of its affiliates in the countries where they operate, including; Scotiabank Europe plc; Scotiabank (Ireland) Designated Activity Company; Scotiabank Inverlat S.A., Institución de Banca Múltiple, Grupo Financiero Scotiabank Inverlat, Scotia Inverlat Casa de Bolsa, S.A. de C.V., Grupo Financiero Scotiabank Inverlat, Scotia Inverlat Derivados S.A. de C.V. – all members of the Scotiabank group and authorized users of the Scotiabank mark. The Bank of Nova Scotia is incorporated in Canada with limited liability and is authorised and regulated by the Office of the Superintendent of Financial Institutions Canada. The Bank of Nova Scotia is authorized by the UK Prudential Regulation Authority and is subject to regulation by the UK Financial Conduct Authority and limited regulation by the UK Prudential Regulation Authority. Details about the extent of The Bank of Nova Scotia's regulation by the UK Prudential Regulation Authority are available from us on request. Scotiabank Europe plc is authorized by the UK Prudential Regulation Authority and regulated by the UK Financial Conduct Authority and the UK Prudential Regulation Authority.
Scotiabank Inverlat, S.A., Scotia Inverlat Casa de Bolsa, S.A. de C.V, Grupo Financiero Scotiabank Inverlat, and Scotia Inverlat Derivados, S.A. de C.V., are each authorized and regulated by the Mexican financial authorities.
Not all products and services are offered in all jurisdictions. Services described are available in jurisdictions where permitted by law.