- Core CPI exceeds expectations...
- ...including Powell’s favourite measure
- Breadth was high
- Markets are back to pricing most of a quarter point hike next week
- It would be a misstep for the Fed to pause, let alone cut
- US headline / core CPI, m/m % change, SA, February:
- Actual: 0.4 / 0.5
- Scotia: 0.4 / 0.3
- Consensus: 0.4 / 0.4
- Prior: 0.5 / 0.4
Most of a quarter point Fed hike is back to being priced for next Wednesday’s decision in the wake of an upside surprise to core CPI and further evidence of stabilizing markets. Major rallies across US regional banks are unfolding on day two of the aftermath of weekend developments.
I’m still not buying the case for the Fed to pause next week—let alone cut . That seemed to be an overly hasty and impulsive view in the markets. I think there remains a strong case to hike 25bps which is my expectation. These developments add to why and on top of previously expressed views (here) on how the magnitude and scope of the response by regulators ringfenced systemic risk while preserving the safety, soundness and functioning of the core banking industry in functioning markets engaging in price discovery.
If the FOMC is uncomfortable with most of a hike being priced then watch for a media plant in blackout like they did last summer, but that would be more likely closer to the meeting if at all. Powell does not like to surprise markets on game day with the here-and-now decisions.
On the future guidance, the FOMC may not go as high with revised terminal rate projections in next week’s dot plot as they would have otherwise, but it would be a misstep in my opinion for them to signal panic and abandon the fight against inflation at the first whiff of trouble. Trouble that is being contained. They can work caution into the bias by not going as high on the terminal rate given a rate equivalence to tightened financial conditions and signal that it’s just a dot plot, but that they will take all decisions meeting-by-meeting while monitoring conditions. Chair Powell needs to be a steady hand on the tiller and resist the flightiness that has characterized some market voices. It’s not a shoe-in call, but I’ll be disappointed in the Chair if he caves.
INFLATION DETAILS
Core inflation is still not cooling. In fact, it accelerated last month. Core inflation ex-food and energy ran at a seasonally adjusted and annualized pace of 5.6% m/m in February. That’s the hottest since last September, a half point hotter than the prior month and more importantly continues to show that the mild ebbing that we saw last Fall is being left in the dust (chart 1). Forget the media headlines that look at irrelevant year-over-year core inflation that was down a tick to 5.5%. At issue is evidence on inflationary pressures at the margin, not prices relative to year-ago base effects.

Powell may see even hotter pressures in this report by emphasizing the measure of inflation that he has been most concerned about since last Fall. That measure is core PCE inflation minus shelter and energy services. We won’t get that gauge until March 31st, but in the meantime, we do have it in CPI terms. This measure was up by 6.2% m/m which is the hottest since six months ago (chart 2).

This is the controversial measure that Powell emphasizes with his argument being that it is closely connected to wage growth. That's loosely true, but the way he speaks implies it's a leading relationship (ie: wage pressures driving this measure of inflation in future) when in reality it's more of a contemporaneous one.
The breadth of price pressures remains high. Chart 3 shows the breakdown of the CPI basket in y/y unweighted terms and chart 4 shows the weighted contributions to year-over-year inflation by component. Charts 5 and 6 do likewise for month-over-month inflation.


OER was up 0.7% m/m SA again as we’re not yet at the point at which cooling pressure arises via market rents moving through shelter gauges (chart 7). That is likely in the second half of 2023 into 2024. It matters much less to the Fed’s preferred PCE gauges that attached about half the weight to shelter compared to CPI’s weight.

In terms of influences upon headline CPI, gasoline was up 1% m/m SA and at a 3¼% weight offered an immaterial effect. Food was up 0.4% m/m that with very generous rounding added under 0.1% m/m to CPI in weighted terms (chart 8). Grocery prices were up 0.3% m/m while food away from home (restaurants, take-out etc) was up 0.6%.

New vehicle prices were flat (+0.2%) and at a 4.3% weight had nothing to offer to CPI in m/m terms (chart 9). Used vehicle prices fell 2.8% m/m and when rounding up at a 2.6% weight added almost 0.1% to m/m CPI.

Airfare took off with a 6.4% m/m gain but the 0.57% weight kept the wheels on the ground in terms of weighted contributions (chart 10).

Other pandemic categories.... Vehicle rental prices slipped –0.5% but with no weighted effect. Lodging was up 2.3% m/m with very little effect at a 1.1% weight.
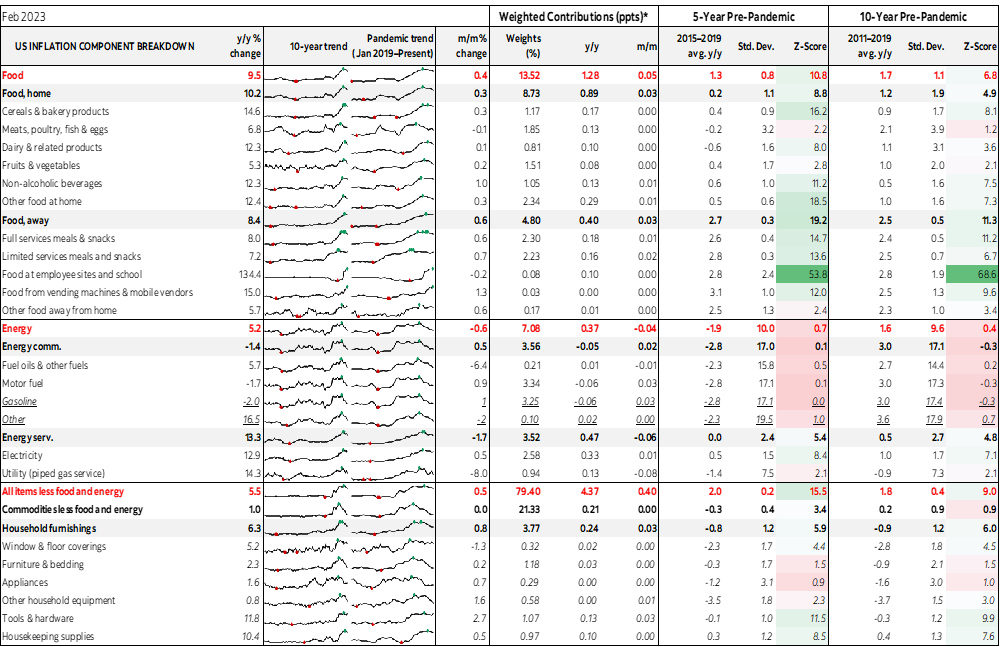
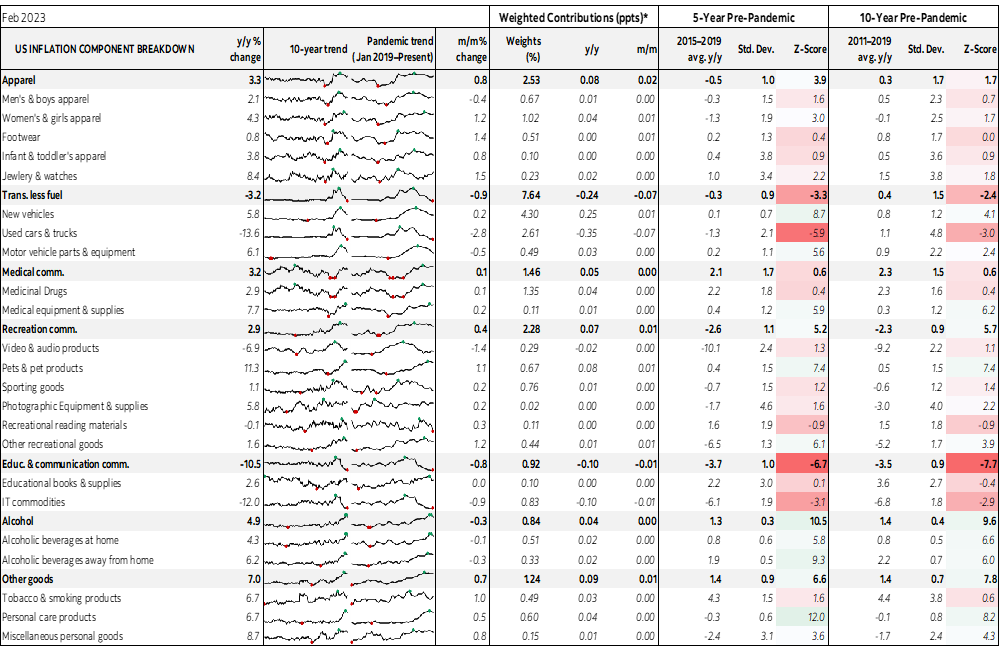
Please see the accompanying table for a further breakdown of the details along with micro charts and z-score measures of deviations compared to historical norms.

DISCLAIMER
This report has been prepared by Scotiabank Economics as a resource for the clients of Scotiabank. Opinions, estimates and projections contained herein are our own as of the date hereof and are subject to change without notice. The information and opinions contained herein have been compiled or arrived at from sources believed reliable but no representation or warranty, express or implied, is made as to their accuracy or completeness. Neither Scotiabank nor any of its officers, directors, partners, employees or affiliates accepts any liability whatsoever for any direct or consequential loss arising from any use of this report or its contents.
These reports are provided to you for informational purposes only. This report is not, and is not constructed as, an offer to sell or solicitation of any offer to buy any financial instrument, nor shall this report be construed as an opinion as to whether you should enter into any swap or trading strategy involving a swap or any other transaction. The information contained in this report is not intended to be, and does not constitute, a recommendation of a swap or trading strategy involving a swap within the meaning of U.S. Commodity Futures Trading Commission Regulation 23.434 and Appendix A thereto. This material is not intended to be individually tailored to your needs or characteristics and should not be viewed as a “call to action” or suggestion that you enter into a swap or trading strategy involving a swap or any other transaction. Scotiabank may engage in transactions in a manner inconsistent with the views discussed this report and may have positions, or be in the process of acquiring or disposing of positions, referred to in this report.
Scotiabank, its affiliates and any of their respective officers, directors and employees may from time to time take positions in currencies, act as managers, co-managers or underwriters of a public offering or act as principals or agents, deal in, own or act as market makers or advisors, brokers or commercial and/or investment bankers in relation to securities or related derivatives. As a result of these actions, Scotiabank may receive remuneration. All Scotiabank products and services are subject to the terms of applicable agreements and local regulations. Officers, directors and employees of Scotiabank and its affiliates may serve as directors of corporations.
Any securities discussed in this report may not be suitable for all investors. Scotiabank recommends that investors independently evaluate any issuer and security discussed in this report, and consult with any advisors they deem necessary prior to making any investment.
This report and all information, opinions and conclusions contained in it are protected by copyright. This information may not be reproduced without the prior express written consent of Scotiabank.
™ Trademark of The Bank of Nova Scotia. Used under license, where applicable.
Scotiabank, together with “Global Banking and Markets”, is a marketing name for the global corporate and investment banking and capital markets businesses of The Bank of Nova Scotia and certain of its affiliates in the countries where they operate, including; Scotiabank Europe plc; Scotiabank (Ireland) Designated Activity Company; Scotiabank Inverlat S.A., Institución de Banca Múltiple, Grupo Financiero Scotiabank Inverlat, Scotia Inverlat Casa de Bolsa, S.A. de C.V., Grupo Financiero Scotiabank Inverlat, Scotia Inverlat Derivados S.A. de C.V. – all members of the Scotiabank group and authorized users of the Scotiabank mark. The Bank of Nova Scotia is incorporated in Canada with limited liability and is authorised and regulated by the Office of the Superintendent of Financial Institutions Canada. The Bank of Nova Scotia is authorized by the UK Prudential Regulation Authority and is subject to regulation by the UK Financial Conduct Authority and limited regulation by the UK Prudential Regulation Authority. Details about the extent of The Bank of Nova Scotia's regulation by the UK Prudential Regulation Authority are available from us on request. Scotiabank Europe plc is authorized by the UK Prudential Regulation Authority and regulated by the UK Financial Conduct Authority and the UK Prudential Regulation Authority.
Scotiabank Inverlat, S.A., Scotia Inverlat Casa de Bolsa, S.A. de C.V, Grupo Financiero Scotiabank Inverlat, and Scotia Inverlat Derivados, S.A. de C.V., are each authorized and regulated by the Mexican financial authorities.
Not all products and services are offered in all jurisdictions. Services described are available in jurisdictions where permitted by law.