- The USD sank and rates rallied in reaction to CPI...
- ...with one possible reason being a soft core services gauge that Powell emphasizes
- There are multiple reasons why this reaction was misplaced
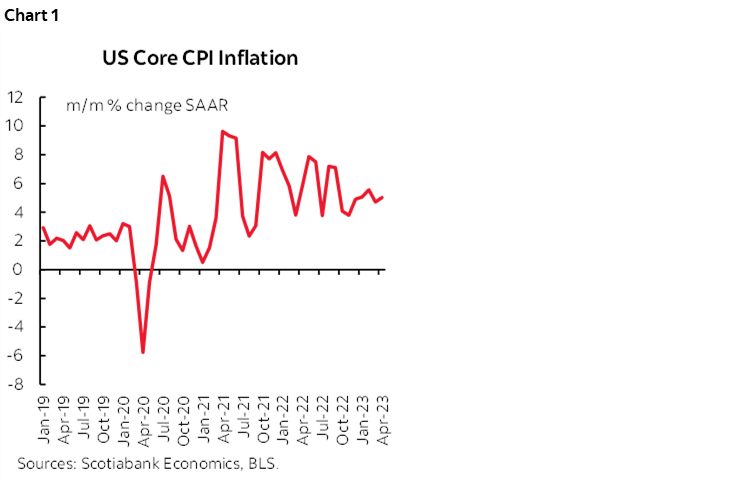
Despite another hot set of readings for headline and core CPI that remains sticky (chart 1), markets reacted by selling the dollar and piling into the US front-end as indicated by a 10+bps decline in the US 2-year Treasury yield post-data. If you’re of the view that markets are always right in their reactions then perhaps just stop reading as you won’t like this note one bit.
WHAT MARKETS CHOSE TO EMPHASIZE...
Good. At least some of you are still reading. And in fairness before turning to the problems with this market interpretation, one plausible reason for this market reaction is that the core services ex-energy and housing gauge was up by only 0.1% m/m in April for the weakest reading since last July (chart 2).

Markets are reasoning that this matters because Chair Powell has regrettably placed inordinate attention upon the significance of this measure and the connection to wage growth notwithstanding the fact that his recent press conference denied ever drawing a connection between wage growth and this measure of inflation. Powell’s own words in his speech on inflation last November spelled out the emphasis upon this gauge and its connection to wage growth as he sees it by saying the following:
“Finally, we come to core services other than housing. This spending category covers a wide range of services from health care and education to haircuts and hospitality. This is the largest of our three categories, constituting more than half of the core PCE index. Thus, this may be the most important category for understanding the future evolution of core inflation. Because wages make up the largest cost in delivering these services, the labor market holds the key to understanding inflation in this category.”
And:
“Finally, the labor market, which is especially important for inflation in core services ex housing, shows only tentative signs of rebalancing, and wage growth remains well above levels that would be consistent with 2 percent inflation over time.”
Yes, Chair Powell, you said this is the measure you are following and you pretty solidly intimated that monitoring wage growth is important to understanding where this measure is going despite the evidence that they offer more of a contemporaneous relationship to one another.
...AND WHY THAT WAS PROBABLY WRONG
Now for the cautions to the market reaction that I instantly shared with clients and staff.
- All-in core CPI was up by 0.4% m/m SA and 5% m/m SAAR which is an acceleration from 4.7% the prior month. Three out of four months this year have been 5%+ SAAR.
- Markets ignored the possibility that core goods inflation is returning which explained why total core was hotter than core services CPI. CPI goods ex-food and energy accelerated to 0.6% m/m and has been trending higher over recent months (chart 3). Maybe this is as temporary as the possibly temporary lull in core services inflation but whatever the case it attracted zero attention by markets and that was wrong in my view.

- The deceleration in core services inflation was just one month and this could be a repeat of past head fakes. A case in point here is that when we last saw core services ex-energy and housing CPI dip this low last July, the next month skyrocketed back to 0.5% m/m.
- The next CPI reading arrives on Day 1 of the June FOMC. Core services inflation could well photobomb the next FOMC and matter more than today’s reading.
- April is not a good month during which to judge the effects of travel-related categories on core services CPI that helped to weigh it down. The peak Summer travel season will be a better period during which to do so and indications from airlines among others point to expectations for a strong summer travel season that could restore pricing power to these categories.
- Powell has a tendency to change his mind in terms of what he is looking at and in my view offers a less than trustworthy way of interpreting what data matters going forward. His latest and greatest gauge that he seizes upon in the moment is subject to change. A case in point was last year when he at one point said that what really motivated his hawkish side was a pick-up in the Employment Cost Index and we rarely hear him speak of that since then. Stop doing that! Stick to the mantra that the entire suite of data is being evaluated and no one single indicator or individual data point will carry the day.
HOW THE FOMC MAY LOOK AT THE NUMBERS
Overall, I think the whole FOMC will look at the numbers differently than how the market did today and in a broader context with more data, developments and events ahead of us into the June FOMC. Most FOMC officials will focus on core that was still hot. I would caution against relying too heavily upon the market's interpretation of the significance of the core services ex-energy and housing gauge.
While I think markets did react the way they did because of core services CPI, there are other less likely but still plausible reasons for some of the reaction. Perhaps markets were positioned for an even stronger print in line with the Cleveland nowcast that leaned closer toward 0.5% m/m core when we got 0.4% in which case it’s a positioning thing and not necessarily something that would be aligned with how the Fed would look at it. Or perhaps markets were looking at the one-tick miss on the headline y/y rate and the one-tick deceleration in the y/y core rate, neither of which are at all relevant in my view given the need to ignore disinflation driven by base-effects and to instead pay much closer attention to pricing power at the margin using m/m gauges.
DETAILS
Charts 4 and 5 provide a breakdown of the weighted contributions to the month-over-month and year-over-year rates of inflation in April.

Housing remained a strong contribution for now withe OER up 0.5% m/m SA but is expected to ebb later this year. I’d repeat earlier points including in this morning’s note about how this will matter much less to the Fed’s preferred core PCE gauge than core CPI given that core PCE carries about half the weight on housing compared to core CPI.
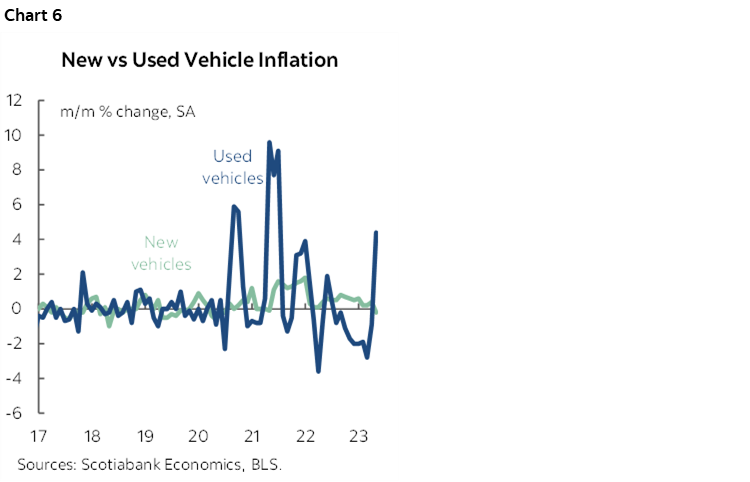
Overall vehicle prices slipped by 0.2% m/m SA and so at a 5.4% weight was not a relevant contributor. However, used vehicle price inflation is returning (chart 6).
Gasoline prices were up 3% m/m SA in line with expectations, adding 0.1% m/m SA to CPI.
Food prices were flat. I had factored in a small rise for that, but that did not happen. Groceries ("food at home") were down -0.2% m/m for the second monthly drop. Take-out etc ("away from home") was stiil strong at +0.4% m/m SA
Travel related categories were surprisingly soft. Lodging was down 3% m/m. Vehicle rentals were down 3.2%. Airfare prices fell 2.6% m/m. To repeat the earlier point, let’s just see how these prices behave over the peak summer travel season in relation to normal seasonal patterns.
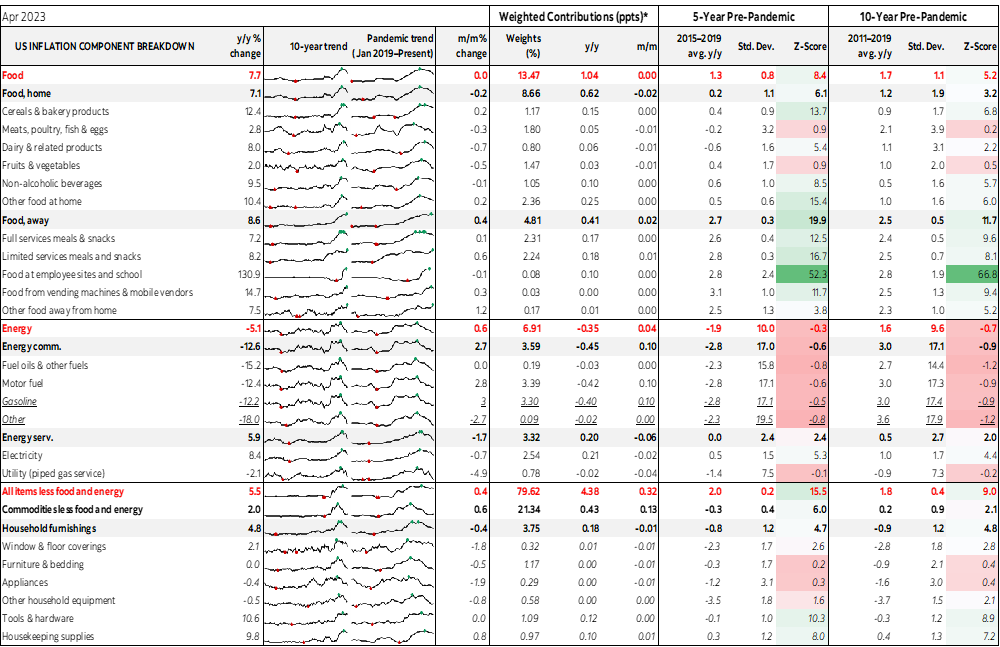
The accompanying table includes more detail along with micro charts and z-score measures of deviation to historical tendencies across the components.


DISCLAIMER
This report has been prepared by Scotiabank Economics as a resource for the clients of Scotiabank. Opinions, estimates and projections contained herein are our own as of the date hereof and are subject to change without notice. The information and opinions contained herein have been compiled or arrived at from sources believed reliable but no representation or warranty, express or implied, is made as to their accuracy or completeness. Neither Scotiabank nor any of its officers, directors, partners, employees or affiliates accepts any liability whatsoever for any direct or consequential loss arising from any use of this report or its contents.
These reports are provided to you for informational purposes only. This report is not, and is not constructed as, an offer to sell or solicitation of any offer to buy any financial instrument, nor shall this report be construed as an opinion as to whether you should enter into any swap or trading strategy involving a swap or any other transaction. The information contained in this report is not intended to be, and does not constitute, a recommendation of a swap or trading strategy involving a swap within the meaning of U.S. Commodity Futures Trading Commission Regulation 23.434 and Appendix A thereto. This material is not intended to be individually tailored to your needs or characteristics and should not be viewed as a “call to action” or suggestion that you enter into a swap or trading strategy involving a swap or any other transaction. Scotiabank may engage in transactions in a manner inconsistent with the views discussed this report and may have positions, or be in the process of acquiring or disposing of positions, referred to in this report.
Scotiabank, its affiliates and any of their respective officers, directors and employees may from time to time take positions in currencies, act as managers, co-managers or underwriters of a public offering or act as principals or agents, deal in, own or act as market makers or advisors, brokers or commercial and/or investment bankers in relation to securities or related derivatives. As a result of these actions, Scotiabank may receive remuneration. All Scotiabank products and services are subject to the terms of applicable agreements and local regulations. Officers, directors and employees of Scotiabank and its affiliates may serve as directors of corporations.
Any securities discussed in this report may not be suitable for all investors. Scotiabank recommends that investors independently evaluate any issuer and security discussed in this report, and consult with any advisors they deem necessary prior to making any investment.
This report and all information, opinions and conclusions contained in it are protected by copyright. This information may not be reproduced without the prior express written consent of Scotiabank.
™ Trademark of The Bank of Nova Scotia. Used under license, where applicable.
Scotiabank, together with “Global Banking and Markets”, is a marketing name for the global corporate and investment banking and capital markets businesses of The Bank of Nova Scotia and certain of its affiliates in the countries where they operate, including; Scotiabank Europe plc; Scotiabank (Ireland) Designated Activity Company; Scotiabank Inverlat S.A., Institución de Banca Múltiple, Grupo Financiero Scotiabank Inverlat, Scotia Inverlat Casa de Bolsa, S.A. de C.V., Grupo Financiero Scotiabank Inverlat, Scotia Inverlat Derivados S.A. de C.V. – all members of the Scotiabank group and authorized users of the Scotiabank mark. The Bank of Nova Scotia is incorporated in Canada with limited liability and is authorised and regulated by the Office of the Superintendent of Financial Institutions Canada. The Bank of Nova Scotia is authorized by the UK Prudential Regulation Authority and is subject to regulation by the UK Financial Conduct Authority and limited regulation by the UK Prudential Regulation Authority. Details about the extent of The Bank of Nova Scotia's regulation by the UK Prudential Regulation Authority are available from us on request. Scotiabank Europe plc is authorized by the UK Prudential Regulation Authority and regulated by the UK Financial Conduct Authority and the UK Prudential Regulation Authority.
Scotiabank Inverlat, S.A., Scotia Inverlat Casa de Bolsa, S.A. de C.V, Grupo Financiero Scotiabank Inverlat, and Scotia Inverlat Derivados, S.A. de C.V., are each authorized and regulated by the Mexican financial authorities.
Not all products and services are offered in all jurisdictions. Services described are available in jurisdictions where permitted by law.