- US CPI inflation increased by more than anyone expected
- There was high breadth to the gain
- Be careful to avoid cherry-picking what transitory components to remove
- Central tendency price measures also accelerated above-target
- Why the Fed’s all-in Phillips curve bet might not work out so well
US CPI m/m / y/y %, April:
Actual: 0.8 / 4.2
Consensus: 0.2 / 3.6
Scotia: 0.3 / 3.8
Prior: 0.6 / 2.6
US core CPI m/m / y/y %, SA, April:
Actual: 0.9 / 3.0
Consensus: 0.3 / 2.3
Scotia: 0.3 / 2.4
Prior: 0.3 / 1.6
Is the Fed banking too heavily upon the Phillips curve to explain away sustainable inflation risk? It’s obviously far too early to tell, but round 1 of the debate either leans toward other ways of explaining much higher inflation than would be predicted by a Phillips curve framework at this point in the cycle and/or toward a fundamentally different Phillips curve than historically.
First up let’s review what happened. The US Treasury curve steepened as the two-year note yield increased by 1–2bps but the 10 year yield increased by 5–6bps. The USD was super volatile post-data and during a speech and press conference by the Fed’s #2 Richard Clarida, but generally appreciated. S&P futures fell immediately and the cash market is off by just over 1% as markets continue to assess Fed policy risks.
This price action came in response to stronger than expected headline and core inflation readings that were marked by high breadth to the gains within the overall basket. See the tables below for the numbers.
Chart 1 shows the acceleration in the three-month moving average of annualized m/m core CPI price changes. Obviously it is skewed toward the latest monthly reading of 0.9% and then annualized, but momentum had been in place before today. This way of looking at inflation is clean of distortions introduced through year-over-year base effect shifts and it shows inflation on the rise compared to last year’s downdraft.

Chart 2 shows that the services side of the core inflation picture is starting to join price inflation in core goods that is leading overall inflationary pressure. That indicates widening breadth in goods and services contributions to inflation.

Chart 3 provides a hint at where the risk lies into the update of the Fed’s preferred core PCE inflation gauge on May 28th. CPI and how its components trace through to the PCE gauge could easily propel headline PCE toward 4% y/y with core PCE in the 3 ¼% y/y range.

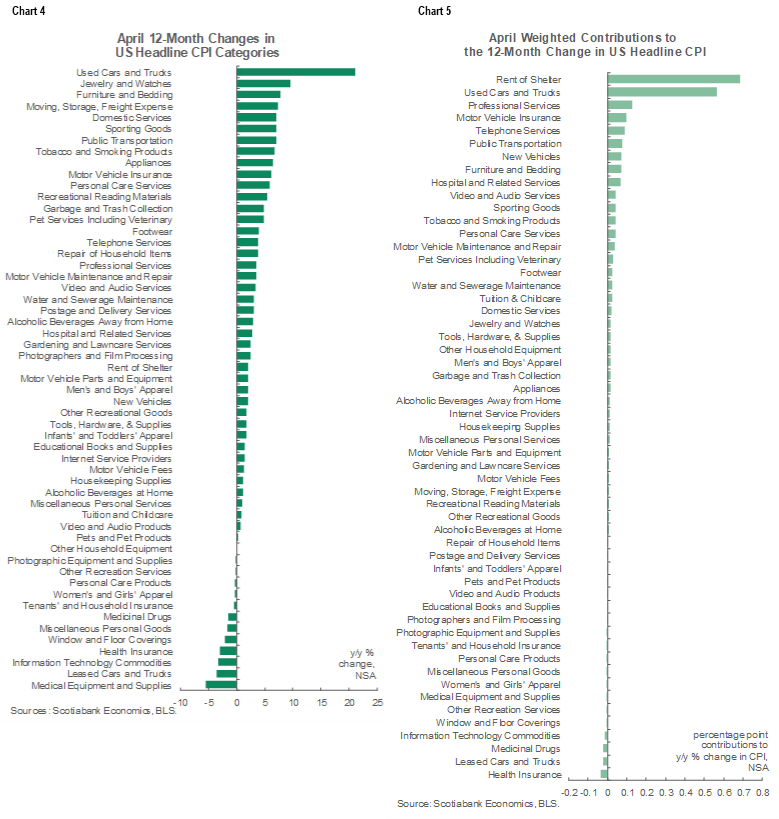
Charts 4 and 5 give a depiction of what drove the year-over-year change in prices by category in both unweighted and weighted contribution terms. Housing and autos were generally toward the top of the heap in terms of weighted contributions, but there was high breadth to the gains through most of the basket. The overall tone of the report indicated heated pressures across many prices other than energy that we had a generally decent feel for in advance.
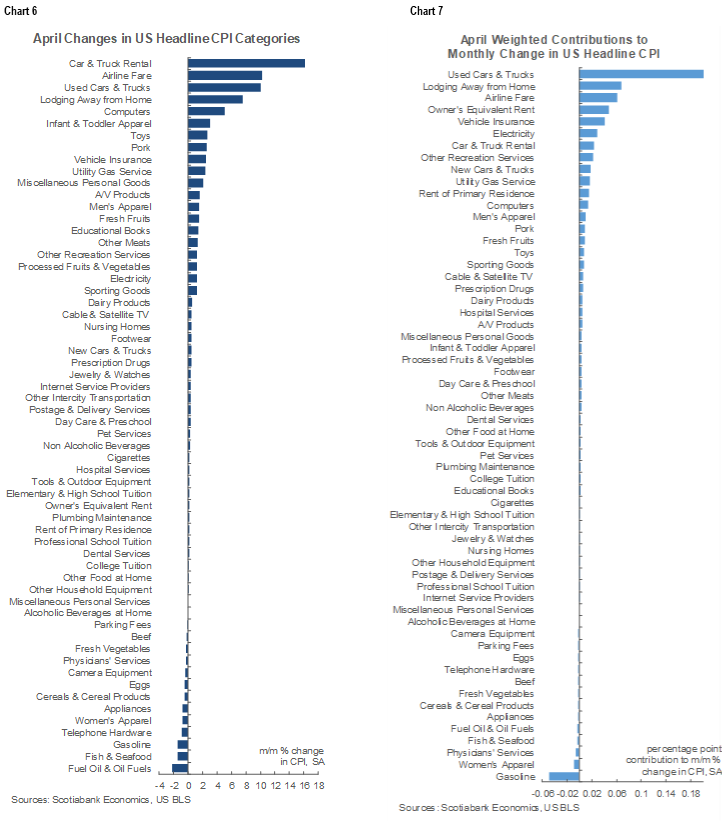
Charts 6 and 7 do the same thing in breaking down m/m changes in seasonally adjusted prices in unweighted and weighted contribution terms. In weighted terms, the biggest upside came from used autos followed by some prices affected by reopening (lodging, airfare) and then housing and auto insurance. Here too there was generally substantial breadth to the gains with only a small handful of categories dragging inflation lower including gas, women’s clothing and doctors’ services.
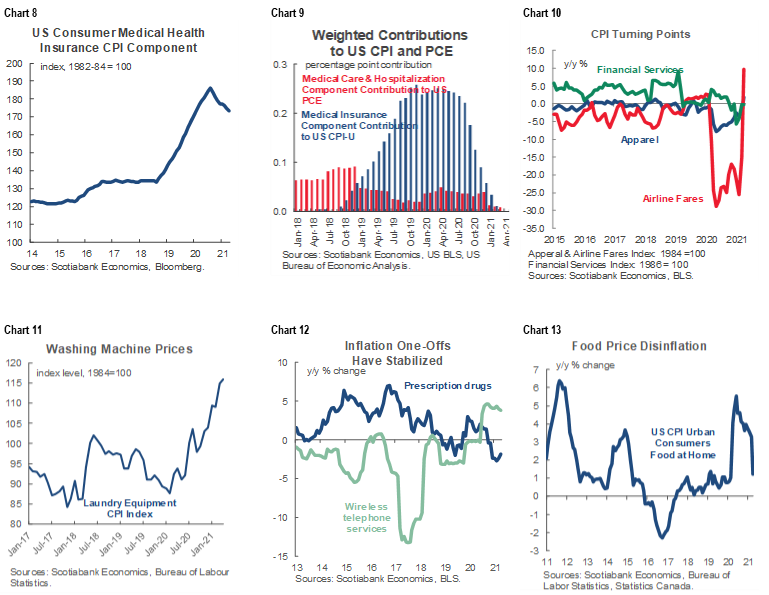
What the heck, why stop at 7. Charts 8–13 demonstrate movements in several notable categories. Medical insurance remains an ebbing contribution to year-over-year inflation (charts 8, 9). Airfare prices are up on a base effect basis but there is also firming pressure in categories like financial services and apparel (chart 10). Tried getting a new appliance lately? We’re still waiting for a stove. Chart 11 shows what’s happening to prices for washing machines that have been influenced first by Trump’s anti-competitive protectionist tariff hikes and then by supply chain issues. Chart 12 shows trade-offs between cellphone pricing versus prescription drugs that have been emphasized as transitory considerations in the past. Take-home food price inflation is experiencing the opposite sort of base effect after prices spiked a year ago and this form of inflation is continuing to ebb (chart 13).
One issue to consider while digesting movements across individual prices is how much of the swing in prices by component should be removed to compensate for reopening effects? That’s tricky as even the more likely categories to experience such an effect might not have been fully driven by just a burst of reopening activity, but a crude first pass would start by subtracting the weighted contributions to the m/m CPI change from lodging and airfare but that would only knock 0.13% off the 0.8% m/m headline CPI change. One could remove other categories that made small contributions, but then it’s also important to remove categories that are shaking off pandemic upsides like food at home prices (aka groceries…) and to also remove categories directly negatively affected by the pandemic that are still weak, like women’s clothing and gasoline. The result is likely to be a whole lot of cherry-picking.
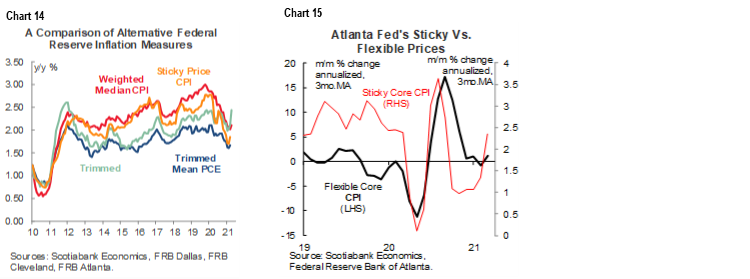
That’s why alternative measures that look for central tendencies in the overall basket of price pressures are important. Charts 14–15 show what they are. Measures like the Cleveland Fed’s trimmed mean and weighted median CPI picked up to 2.4% y/y and 2.1% y/y respectively in April. The Atlanta Fed’s sticky price CPI measure is pending its update and so is the Dallas Fed’s trimmed mean PCE gauge after PCE figures near the end of the month. All of these measures average out to being close to or exceeding the Fed’s inflation target and this momentum was in place before base effects became a more powerful influence in April.
So why is this happening with 8.3 million folks still without a job who had one before the pandemic struck plus underutilized employed Americans including 840k more Americans working part-time who would prefer full-time compared to the pre-pandemic level? You’re not supposed to get durable inflation with lots of unemployed folks sitting around, right? Answer that question and whether it could be durable and you’ve got the Fed figured out. Unfortunately it’s not quite that simple. What I think is worth doing, however, is to remind readers that the Fed is making a big bet on a stable Phillips curve argument rooted in estimated relationships and inputs dating back before the pandemic struck. Several points follow:
1. The Phillips curve has led central bankers astray for years as they and others over-estimated inflation risk in the past. It’s not an ironclad model and it is sensitive to its parameterization and estimation. In the past it moved steadily flatter with less persistence, but who is to say that will continue? So why is the Fed relying so heavily upon something that hasn’t worked so well in the past while leading them fundamentally astray on policy risks?
2. There is lots of uncertainty around the inputs to the Phillips curve model both at present and how they may evolve. One illustration of the Phillips curve sets inflation as equal to expected inflation minus a coefficient applied to the spread between the actual unemployment rate and the natural rate of unemployment. Having faith in the Phillips curve not only depends upon how fast one expects actual unemployment to fall with renewed uncertainty following nonfarm payrolls and whether that may have been a transitory bottleneck issue, but also depends upon having faith in the measures of expected inflation and the natural rate of unemployment at which labour markets are in equilibrium. In truth, we can’t really observe either with much accuracy in real time. There are multiple measures of inflation expectations and they all have their pitfalls. It’s also feasible that the natural rate of unemployment could be higher in this cycle than historically without all of the still unemployed due to the pandemic coming back. If so, then the spread between the unemployment rate and the natural rate would be lower and hence one might expect durable on-target inflation to arrive sooner and possibly with upside risk.
3. How the model is estimated also counts. I’m unsure about how much confidence one should have in pre-pandemic estimations of the Phillips curve relationship but the issue translates into the size of the coefficient in front of the unemployment rate minus the natural rate. Exogenous factors influencing inflation may be inadequately captured including massive fiscal and monetary policy stimulus and supply chains that may be damaged for longer than anyone expects due to trade wars followed by the pandemic with further trade tensions perhaps ahead in the Biden administration’s agenda.
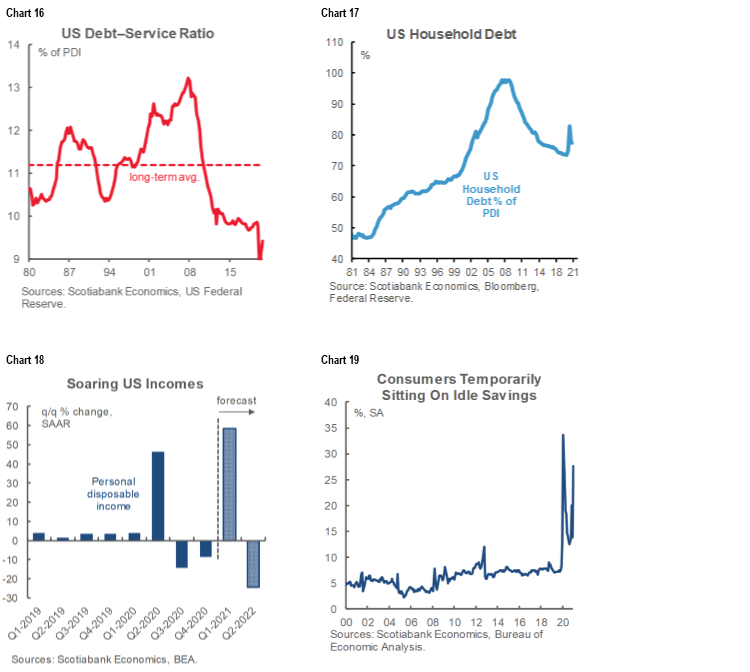
Furthermore, it’s the pricing power that may be extracted at the expense of the vast majority of Americans who kept or regained employment to date that could be more powerful today than previously. Charts 16–19 show measures of US household finances. The broad financial conditions of the US household sector have never looked this good as measured by a record-low debt service burden, record high personal saving rate, lower debt and
Other inflation drivers also may not behave quite as they did in the past. For one thing, an aging population is supposed to be a more positive influence upon inflation in a life cycle theory framework and as the US population ages perhaps the past estimates of the Phillips curve will not apply as strongly. For another, following decades of disinflationary trade liberalization, the protectionist measures pursued by the Trump administration and possibly to be followed by protectionist measures under the Biden administration including climate actions may be a fundamental break from the past.
In all, a more circumspect Federal Reserve would consider bidirectional risks to inflation especially since today’s number was higher than the Fed had expected. I find the tone of the commentary from Fed officials has become somewhat more guarded more recently versus earlier efforts to be dismissive toward inflation risk as purely a transitory base-effect-driven phenomenon to be looked through. We heard from Clarida this morning that he was surprised by the CPI report and we’re hearing that while he, Governor Brainard and others still generally think most of the inflationary pressure will be transitory, they are collectively sounding less strident and more open to using the tools at their disposal to rein in inflationary pressures if the need arises. At the end of the day, however, even ebbing inflation from a 4-range toward just over half that doesn’t need historic emergency levels of combined monetary and fiscal policy stimulus with vaccines doing the heavy work to end the pandemic earlier than imagined when all of this stimulus was put into place.
DISCLAIMER
This report has been prepared by Scotiabank Economics as a resource for the clients of Scotiabank. Opinions, estimates and projections contained herein are our own as of the date hereof and are subject to change without notice. The information and opinions contained herein have been compiled or arrived at from sources believed reliable but no representation or warranty, express or implied, is made as to their accuracy or completeness. Neither Scotiabank nor any of its officers, directors, partners, employees or affiliates accepts any liability whatsoever for any direct or consequential loss arising from any use of this report or its contents.
These reports are provided to you for informational purposes only. This report is not, and is not constructed as, an offer to sell or solicitation of any offer to buy any financial instrument, nor shall this report be construed as an opinion as to whether you should enter into any swap or trading strategy involving a swap or any other transaction. The information contained in this report is not intended to be, and does not constitute, a recommendation of a swap or trading strategy involving a swap within the meaning of U.S. Commodity Futures Trading Commission Regulation 23.434 and Appendix A thereto. This material is not intended to be individually tailored to your needs or characteristics and should not be viewed as a “call to action” or suggestion that you enter into a swap or trading strategy involving a swap or any other transaction. Scotiabank may engage in transactions in a manner inconsistent with the views discussed this report and may have positions, or be in the process of acquiring or disposing of positions, referred to in this report.
Scotiabank, its affiliates and any of their respective officers, directors and employees may from time to time take positions in currencies, act as managers, co-managers or underwriters of a public offering or act as principals or agents, deal in, own or act as market makers or advisors, brokers or commercial and/or investment bankers in relation to securities or related derivatives. As a result of these actions, Scotiabank may receive remuneration. All Scotiabank products and services are subject to the terms of applicable agreements and local regulations. Officers, directors and employees of Scotiabank and its affiliates may serve as directors of corporations.
Any securities discussed in this report may not be suitable for all investors. Scotiabank recommends that investors independently evaluate any issuer and security discussed in this report, and consult with any advisors they deem necessary prior to making any investment.
This report and all information, opinions and conclusions contained in it are protected by copyright. This information may not be reproduced without the prior express written consent of Scotiabank.
™ Trademark of The Bank of Nova Scotia. Used under license, where applicable.
Scotiabank, together with “Global Banking and Markets”, is a marketing name for the global corporate and investment banking and capital markets businesses of The Bank of Nova Scotia and certain of its affiliates in the countries where they operate, including; Scotiabank Europe plc; Scotiabank (Ireland) Designated Activity Company; Scotiabank Inverlat S.A., Institución de Banca Múltiple, Grupo Financiero Scotiabank Inverlat, Scotia Inverlat Casa de Bolsa, S.A. de C.V., Grupo Financiero Scotiabank Inverlat, Scotia Inverlat Derivados S.A. de C.V. – all members of the Scotiabank group and authorized users of the Scotiabank mark. The Bank of Nova Scotia is incorporated in Canada with limited liability and is authorised and regulated by the Office of the Superintendent of Financial Institutions Canada. The Bank of Nova Scotia is authorized by the UK Prudential Regulation Authority and is subject to regulation by the UK Financial Conduct Authority and limited regulation by the UK Prudential Regulation Authority. Details about the extent of The Bank of Nova Scotia's regulation by the UK Prudential Regulation Authority are available from us on request. Scotiabank Europe plc is authorized by the UK Prudential Regulation Authority and regulated by the UK Financial Conduct Authority and the UK Prudential Regulation Authority.
Scotiabank Inverlat, S.A., Scotia Inverlat Casa de Bolsa, S.A. de C.V, Grupo Financiero Scotiabank Inverlat, and Scotia Inverlat Derivados, S.A. de C.V., are each authorized and regulated by the Mexican financial authorities.
Not all products and services are offered in all jurisdictions. Services described are available in jurisdictions where permitted by law.

