- Inflation accelerated in line with expectations
- That wasn’t good enough for CAD and shorter term rates
- Key is which measure of core inflation should be relied upon…
- ...as common component remains remarkably stable…
- ...but may be sharply underestimating true core inflation
- Our inflation dashboard
Canadian CPI, m/m / y/y %, October:
Actual: 0.7 / 4.7
Scotia: 0.7 / 4.7
Consensus: 0.7 / 4.7
Prior: 0.2 / 4.4
Canadian core CPI, y/y % change, October:
Average: 2.7 (prior 2.7)
Weighted median: 2.9 (prior 2.9 revised up from 2.8)
Common component: 1.8 (prior 1.8%)
Trimmed mean: 3.3 (prior 3.3% revised down from 3.4)
Canadian inflation continued to climb higher and met expectations. The Canadian dollar depreciated and shorter-term interest rates rallied in the wake. I think there were two reasons for this market reaction. One is positioning in that markets may have been braced for hotter than expected readings which has been the pattern elsewhere (US, UK); perhaps Canada’s consensus was simply more accurate. Second, I’m not sure market participants have the best handle on core inflation and may be over-weighting one measure among 7 that hasn’t budged in many months and that we don’t think is the best gauge. I’ll come back to this issue.
But first, in terms of highlights, average core inflation was unchanged at 2.67% y/y in October using the BoC’s three preferred gauges of trimmed mean CPI, weighted median CPI and common component CPI (chart 1).

Inflation continues to be about far more than just year-ago base effects (chart 2). Month-ago annualized and seasonally adjusted prices have been up by between 6–7% over the past four months and have been running hot since April.

Chart 3 shows the range of all 7 core inflation measures. The lower end of the range arrives with lag (CPI mean standard deviation).

Chart 4 breaks apart the BoC’s three preferred measures of core inflation. Note the historic gap between common component CPI at just 1.8% y/y and the others. This issue deserves focused treatment because a common client question is whether common component’s low reading is the best one.

WHAT ‘CORE’ IS BEST?
CPI-common’s advantage is that it uses a factor-based approach to seeking common price changes across multiple categories of the CPI basket. CPI-common tracks spare capacity conditions best when spending patterns don’t materially change and yet they clearly have during the pandemic with only partial adjustment for this via rebasing that started in July but left all prior months’ weights at 2017 spending patterns. CPI-common is also the most susceptible to year-ago base effects since the other two preferred core measures estimate year-over-year inflation on a compounded monthly weighted basis.
Key, however, is what measure of core inflation should the BoC prefer? We haven’t heard much from them on that topic in quite a while. Our shop’s view is that the BoC should have a preference toward going back to the simple CPI excluding food, energy and indirect taxes measure. See the piece here by René Lalonde and Nikita Perevalov this past summer which they continue to stand by. René and Nikita drew upon analytical efforts to argue that this measure of core is the best one because it is best explained in a Phillips curve framework and has beaten other measures of core inflation at forecasting total inflation by a wide margin over recent years. It would be helpful for the BoC to update its views on which measure(s) of core inflation are preferred given the importance of the matter.
This is not a small issue. If Rene and Nikita are right, then the measure they are pointing to shows core inflation running at 3.8% y/y (chart 5). The rate of change in this core measure on a month-over-month seasonally adjusted and annualized basis is ebbing, but still running hot. That blows common component CPI’s reading of 1.8% y/y right out of the water. That, in turn, suggests that the BoC is perhaps not paying enough attention to the best gauge of underlying core inflation and has confused markets on the topic with too many measures of core inflation. Perhaps that’s by design amid uncertainty…. Nevertheless, if the BoC is internally emphasizing common component CPI to justify its transitory-for-longer than previously expected stance then it may be making policy vulnerable to emphasizing the wrong measure.

OTHER DETAILS
As for broader details, let’s start with a broad decomposition of goods versus services inflation shown in chart 6. Goods inflation accelerated, but only because of food and energy. Services inflation accelerated outright and probably still has further upside ahead.

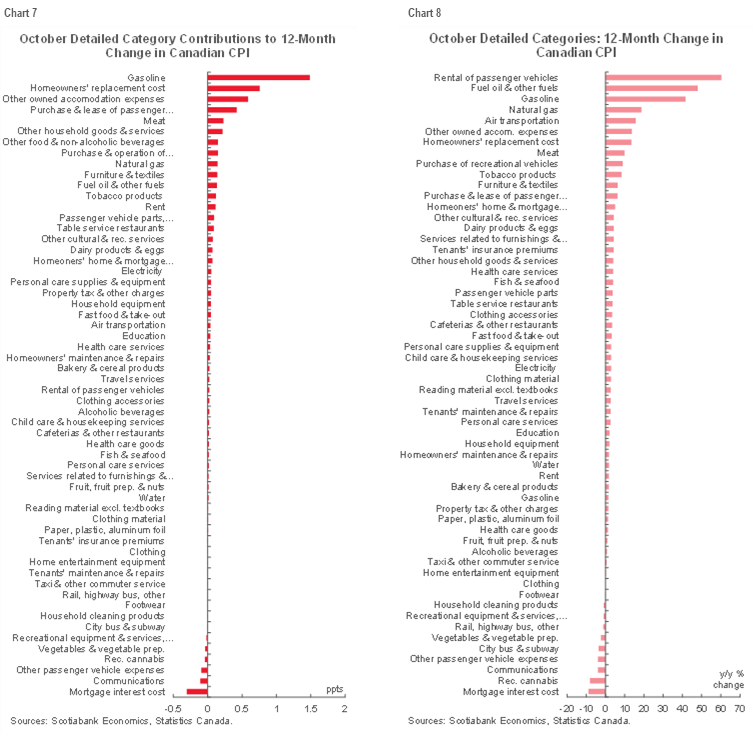
Chart 7 provides a more detailed breakdown of the CPI basket in terms of weighted contributions to the overall year-over-year inflation rate. Chart 8 does the same thing in unweighted terms. Gasoline is the biggest driver by quite a bit, but homes and vehicles are playing the other biggest roles in driving inflationary pressure. There is substantial breadth to the rest of the gains.

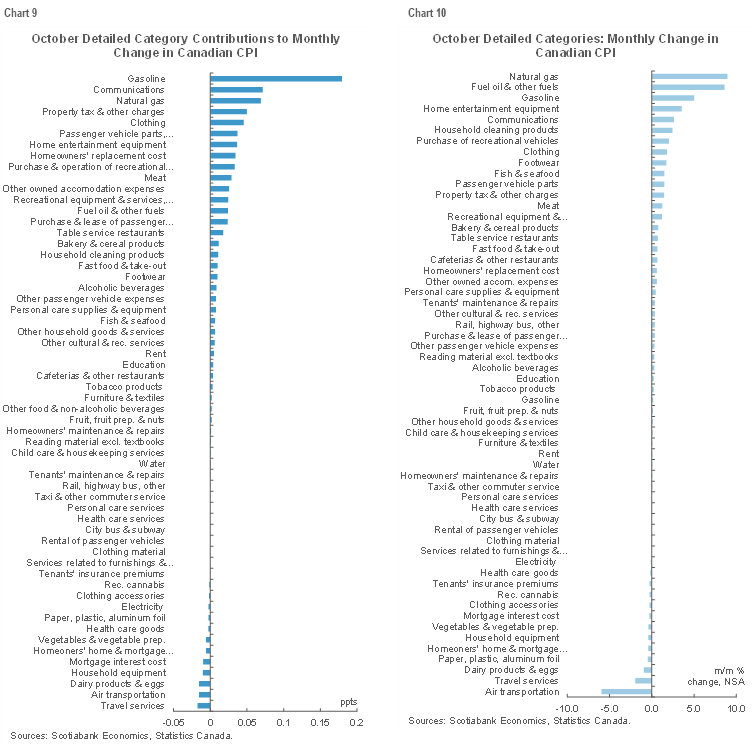
Charts 9 and 10 do the same thing for the month-over-month inflation rates.

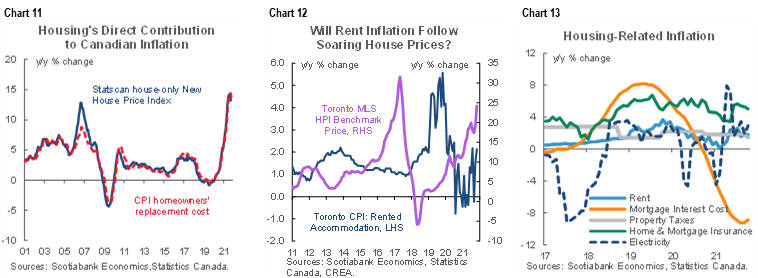
Charts 11–17 on the next few pages home in on trends in several specific categories. Homeowners’ replacement cost is a big upside driver (chart 11). Rented accommodation is continuing to heat up (chart 12). Chart 13 shows other housing-related components. Property taxes jumped in month-over-month terms during October as per the norm, but relatively stable in year-over-year terms. Mortgage interest remains a transitory downside that continues to see lower mortgage rates pass through in lagging fashion which is probably something that will turn the other way in 2022. Electricity price inflation was roughly stable.

Restaurant price inflation (chart 14) accelerated at full sit-down restaurants but saw an offset in volatile take-out prices.

Auto price inflation (chart 15) ebbed somewhat in year-over-year terms but remains volatile and is still high.

Airfare prices (chart 16) eased somewhat after the large prior gain but are exceptionally volatile.

The breakdown of the recreation/reading/education category is also offered (chart 17).

Please also see the complete inflation dashboard that breaks down individual components and their changes including mini-charts and Z-scores that depict the size of deviations from norms across individual price changes over 5- and 10-year intervals.


DISCLAIMER
This report has been prepared by Scotiabank Economics as a resource for the clients of Scotiabank. Opinions, estimates and projections contained herein are our own as of the date hereof and are subject to change without notice. The information and opinions contained herein have been compiled or arrived at from sources believed reliable but no representation or warranty, express or implied, is made as to their accuracy or completeness. Neither Scotiabank nor any of its officers, directors, partners, employees or affiliates accepts any liability whatsoever for any direct or consequential loss arising from any use of this report or its contents.
These reports are provided to you for informational purposes only. This report is not, and is not constructed as, an offer to sell or solicitation of any offer to buy any financial instrument, nor shall this report be construed as an opinion as to whether you should enter into any swap or trading strategy involving a swap or any other transaction. The information contained in this report is not intended to be, and does not constitute, a recommendation of a swap or trading strategy involving a swap within the meaning of U.S. Commodity Futures Trading Commission Regulation 23.434 and Appendix A thereto. This material is not intended to be individually tailored to your needs or characteristics and should not be viewed as a “call to action” or suggestion that you enter into a swap or trading strategy involving a swap or any other transaction. Scotiabank may engage in transactions in a manner inconsistent with the views discussed this report and may have positions, or be in the process of acquiring or disposing of positions, referred to in this report.
Scotiabank, its affiliates and any of their respective officers, directors and employees may from time to time take positions in currencies, act as managers, co-managers or underwriters of a public offering or act as principals or agents, deal in, own or act as market makers or advisors, brokers or commercial and/or investment bankers in relation to securities or related derivatives. As a result of these actions, Scotiabank may receive remuneration. All Scotiabank products and services are subject to the terms of applicable agreements and local regulations. Officers, directors and employees of Scotiabank and its affiliates may serve as directors of corporations.
Any securities discussed in this report may not be suitable for all investors. Scotiabank recommends that investors independently evaluate any issuer and security discussed in this report, and consult with any advisors they deem necessary prior to making any investment.
This report and all information, opinions and conclusions contained in it are protected by copyright. This information may not be reproduced without the prior express written consent of Scotiabank.
™ Trademark of The Bank of Nova Scotia. Used under license, where applicable.
Scotiabank, together with “Global Banking and Markets”, is a marketing name for the global corporate and investment banking and capital markets businesses of The Bank of Nova Scotia and certain of its affiliates in the countries where they operate, including; Scotiabank Europe plc; Scotiabank (Ireland) Designated Activity Company; Scotiabank Inverlat S.A., Institución de Banca Múltiple, Grupo Financiero Scotiabank Inverlat, Scotia Inverlat Casa de Bolsa, S.A. de C.V., Grupo Financiero Scotiabank Inverlat, Scotia Inverlat Derivados S.A. de C.V. – all members of the Scotiabank group and authorized users of the Scotiabank mark. The Bank of Nova Scotia is incorporated in Canada with limited liability and is authorised and regulated by the Office of the Superintendent of Financial Institutions Canada. The Bank of Nova Scotia is authorized by the UK Prudential Regulation Authority and is subject to regulation by the UK Financial Conduct Authority and limited regulation by the UK Prudential Regulation Authority. Details about the extent of The Bank of Nova Scotia's regulation by the UK Prudential Regulation Authority are available from us on request. Scotiabank Europe plc is authorized by the UK Prudential Regulation Authority and regulated by the UK Financial Conduct Authority and the UK Prudential Regulation Authority.
Scotiabank Inverlat, S.A., Scotia Inverlat Casa de Bolsa, S.A. de C.V, Grupo Financiero Scotiabank Inverlat, and Scotia Inverlat Derivados, S.A. de C.V., are each authorized and regulated by the Mexican financial authorities.
Not all products and services are offered in all jurisdictions. Services described are available in jurisdictions where permitted by law.

