- Hot core inflation and higher breadth point to no cooling effects
- Yields pushed higher, USDCAD shakes it off…
- ...partly because US Ts cheapened on spillover effects
- Why I still think that the BoC has to hike by 75bps next week…
- ...and it’s about much more than the latest CPI print
- CDN CPI m/m % NSA // y/y %, September:
- Actual: +0.1 / 6.9
- Scotia: +0.3 / 7.0
- Consensus: -0.1 / 6.7
- Prior: -0.3 / 7.0
- Average ‘Core’ CPI ex-common: 5.0 y/y (5.0% prior)
Hot underlying details to Canada’s CPI update for September reinforce my expectation for the Bank of Canada to hike its policy rate by another 75bps next week alongside a still hawkish bias that repeats guidance that rates will still need to move higher.
Markets remain wildly hyper-sensitive to backward looking CPI readings. Canada’s two-year and 5-year yields both spiked by 5bps post-data and hence went from outperforming US Treasuries pre-data to matching their selloff. USDCAD is little changed post-data in part because of the correlated moves in US and Canadian yields this morning.
OIS pricing for next week’s BoC decision has moved from pre-data pricing around 60bps to over 75bps now as a three-quarters of a percentage point rate hike is now fully priced. That’s consistent with my messaging to clients and staff for some time now and I’ll explain later in this note why I don’t think the BoC has a choice to hike by less than 75bps.
HEADLINE RISES MORE THAN EXPECTED
Before turning to more relevant gauges, headline inflation was up +0.1% m/m on a seasonally unadjusted basis and hence hotter than the median consensus estimate for a decline of –0.1% m/m and the roughly half of consensus that expected a negative reading. It was not quite as hot as my guesstimate for a rise of +0.3% m/m NSA which was nevertheless broadly on the right side of consensus.
On a seasonally adjusted basis, headline CPI was up by 0.4% m/m, or 4.8% at an annualized pace which is the hottest reading since June. To repeat, forget the year-over-year gauges as m/m trend pressures will inform whether inflation is cooling or not and by how much at the margin.
CORE GAUGES REMAIN HOT
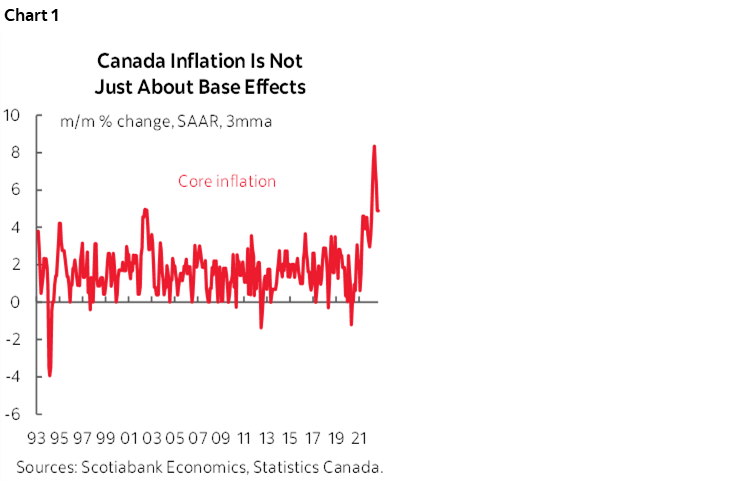
Far more important, however, is that all core CPI measures were hot. Core CPI excluding food and energy was up by 5.2% m/m at a seasonally adjusted and annualized rate (SAAR). Chart 1 shows the three-month moving average that remains high. Core CPI defined on a CPI ex-8 most volatile components basis that excludes produce, mortgage interest costs, gasoline, natural gas and other fuels, inter-city transport, tobacco etc was also up by 5% m/m SAAR.
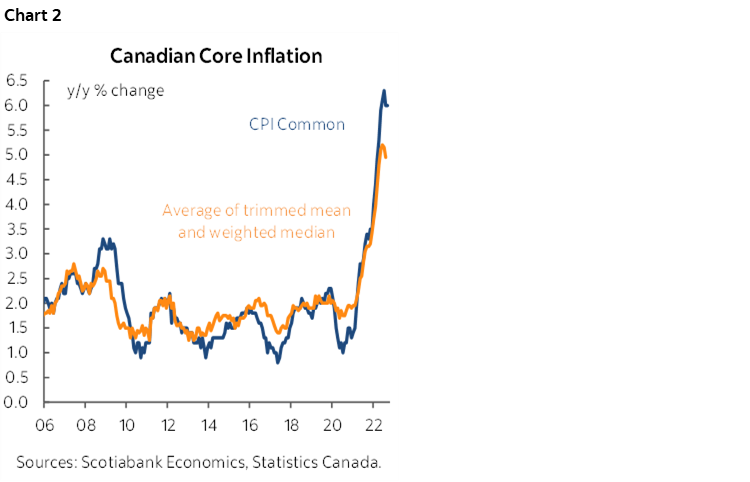
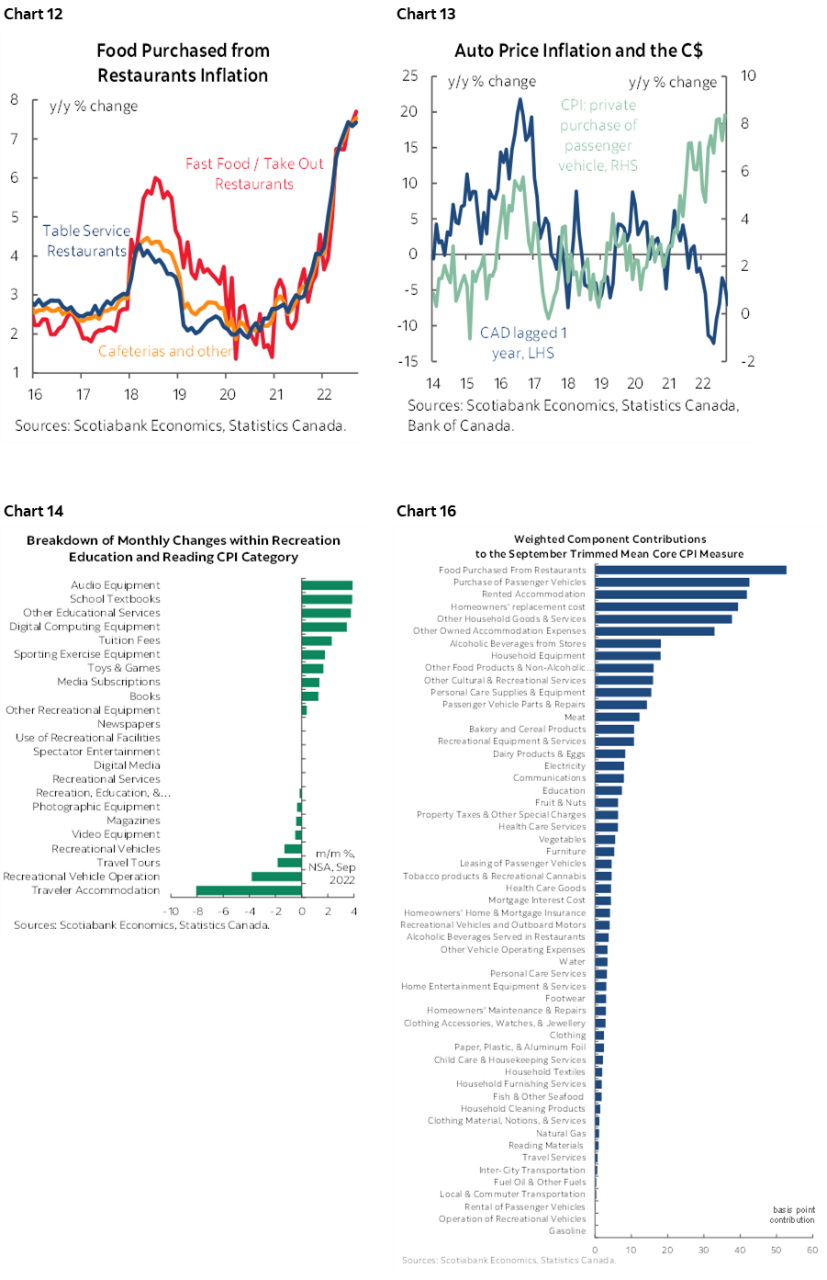
The Bank of Canada’s central tendency gauges held firm at 5% y/y on average and hence unchanged from the prior month’s reading and only two-tenths lower than the two months before that (chart 2). Basically, this measure has been around 5% y/y since April and is showing no signs of cooling. To arrive at this I’ve averaged the trimmed mean and weighted median measures but excluded common component CPI that has been discredited by wild revisions and even Governor Macklem now leans against including it as they reassess the gauge.
BREADTH INCREASED
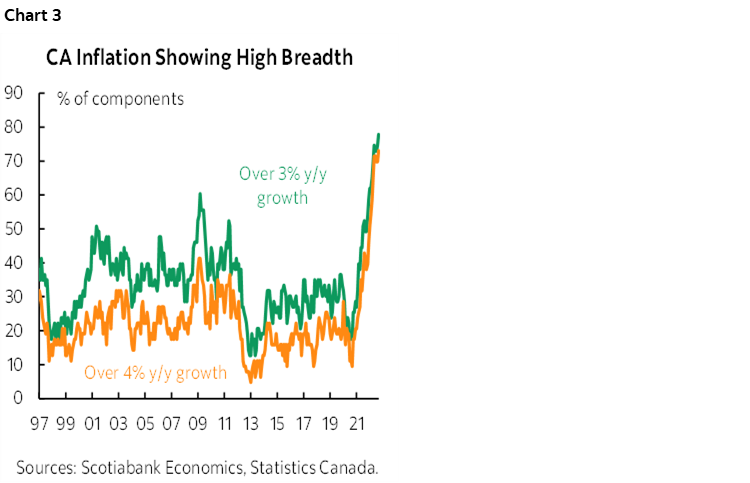
As chart 3 shows, there was another up-tick in the breadth of price pressures across all cut-offs. A whopping 78% of the CPI basket (prior month was 75%) is now up by over 3% y/y and 73% of the basket is up by over 4% y/y (prior month was 70%). Price pressures continue to fan out across a larger and larger share of the economy.
DRIVERS
Breadth is also indicated by the breakdowns of the changes within the basket by individual component. Chart 4 shows m/m changes in prices and chart 5 shows the same thing after weighting their contributions to the overall change in CPI in m/m terms. Chart 6 shows price changes in y/y terms and chart 7 shows the same thing in terms of weighted contributions to the overall change in CPI in y/y terms.
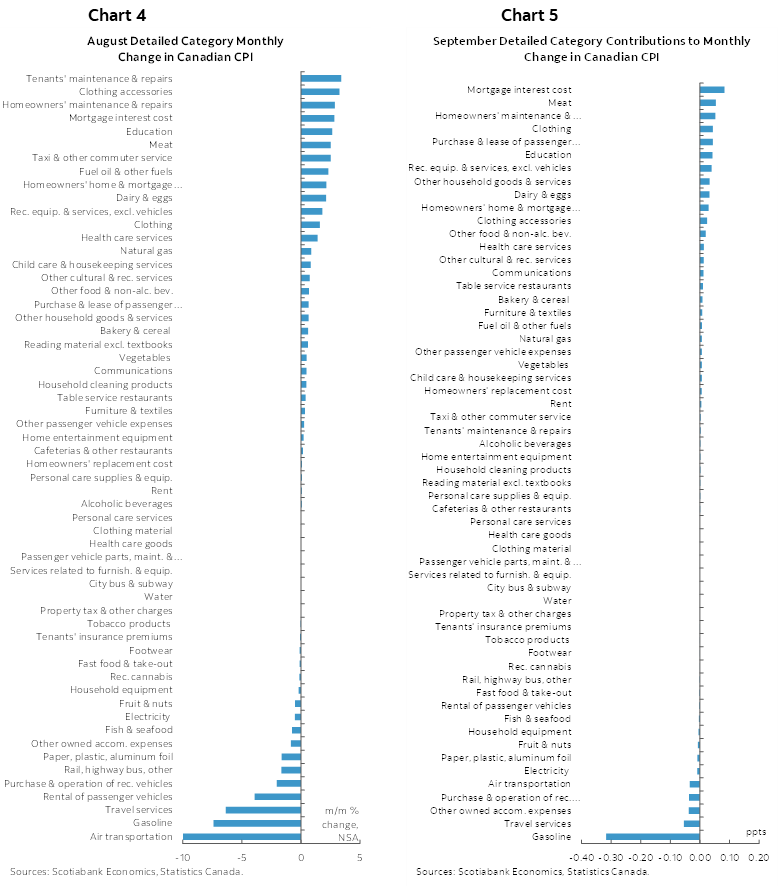
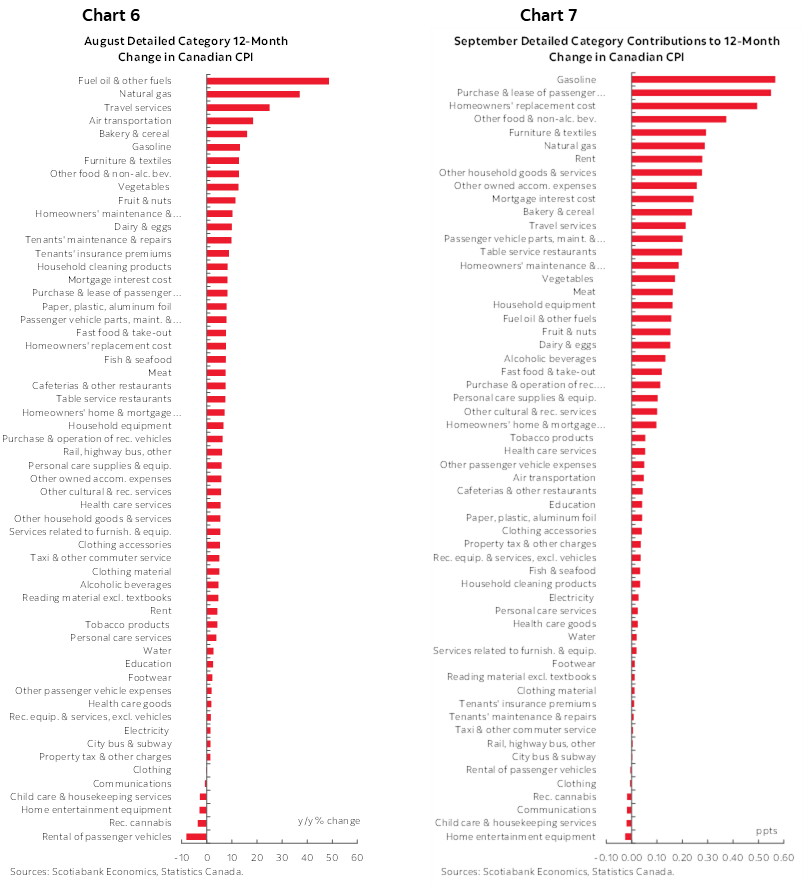
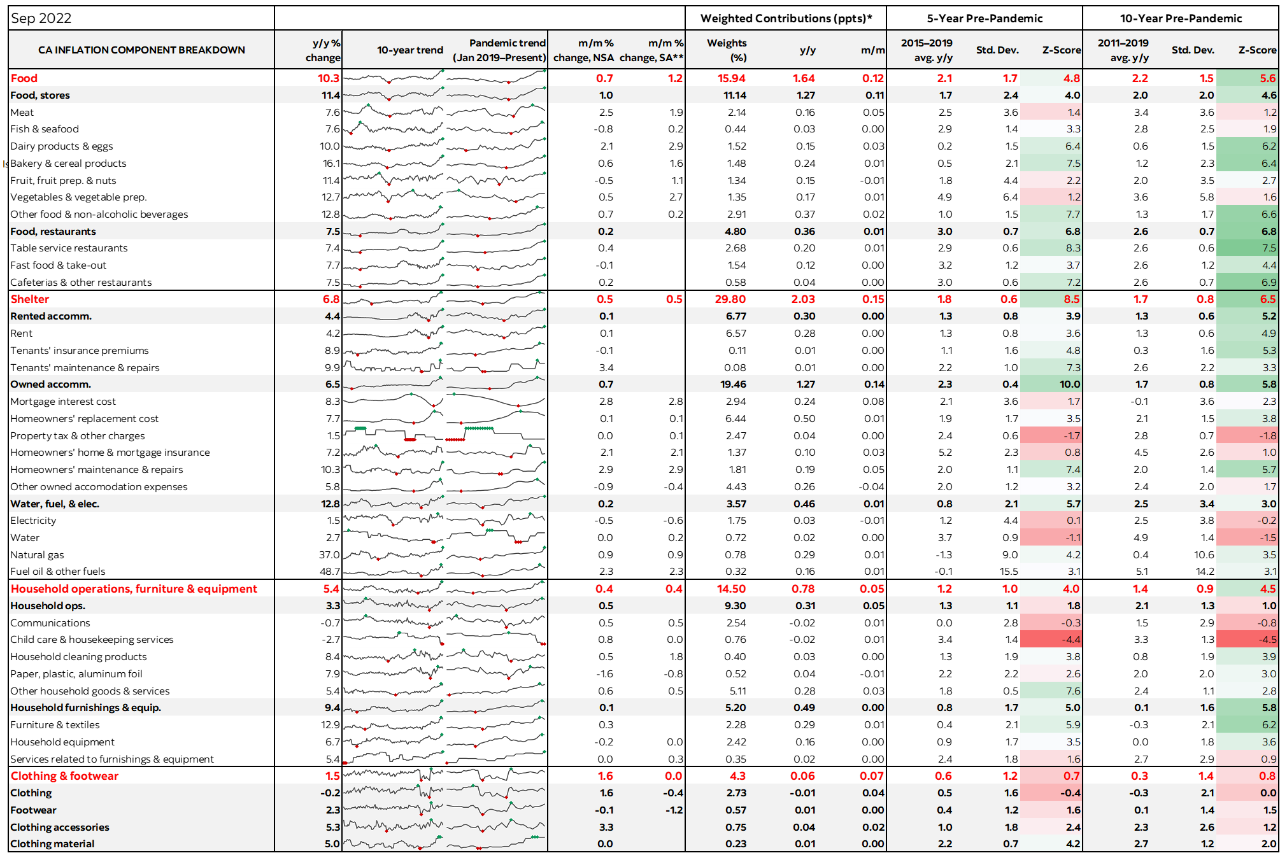
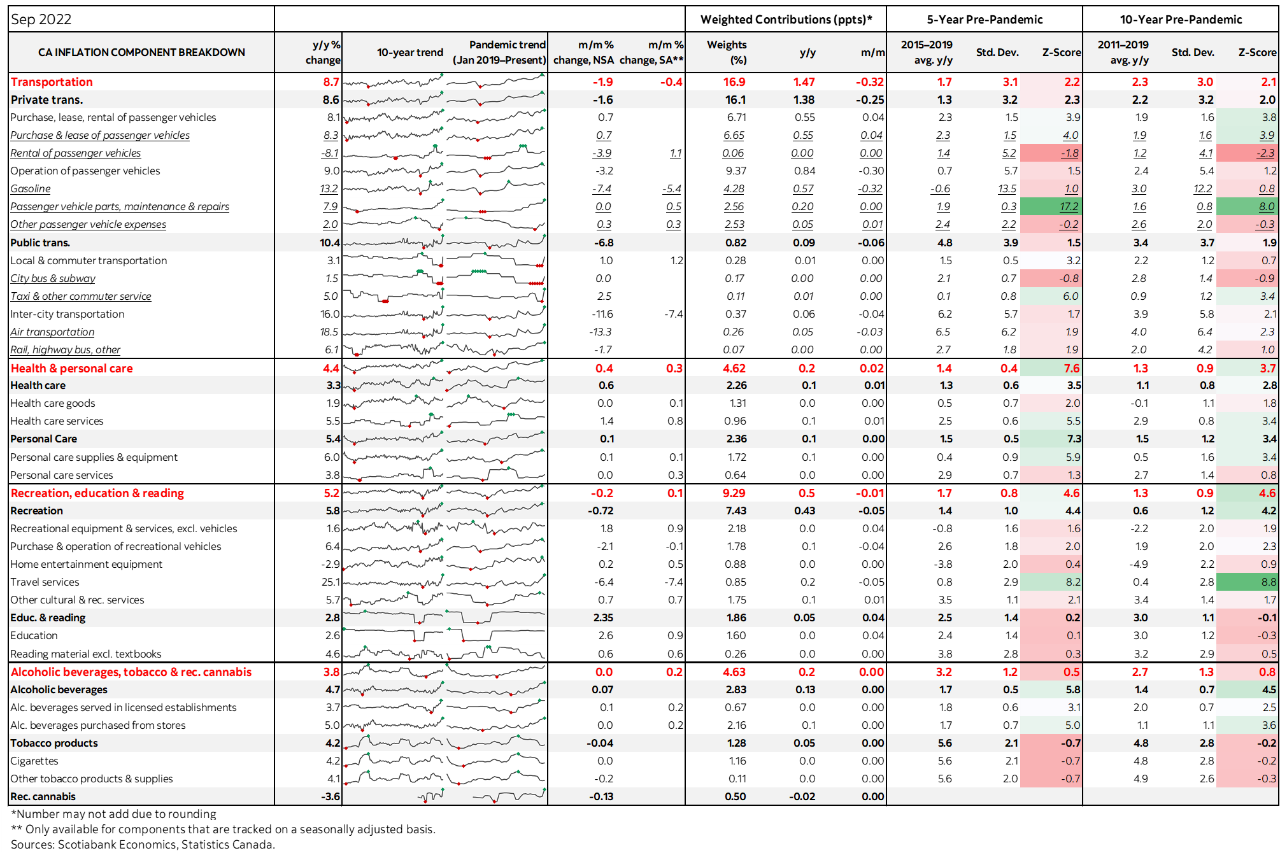
The main SA drivers were food (+1.2% m/m), shelter (0.5%), household ops/furnishings/equipment (0.4%) and health/personal care (0.3%).
Services CPI (just over half the basket) increased 0.3% NSA so that posted some of my expected rebound in what is typically a soft seasonally-unadjusted month. Therefore SA services were up by around 1/2% m/m.
Rec/ed'n/reading did not rebound as I had expected. -0.2% m/m NSA
Gasoline fell 7.4% m/m which is roughly consistent with the tracking I had of retail prices.
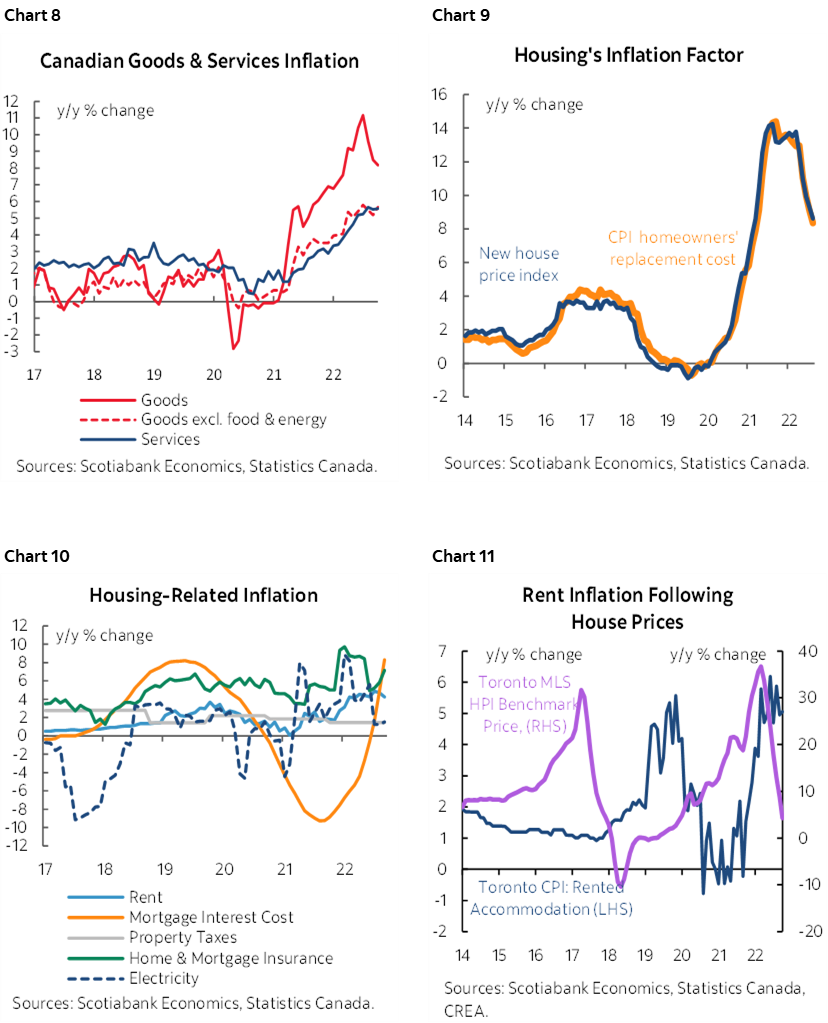
Housing's replacement cost continues to level off in CPI from June to now September. It is not declining yet in absolute index terms but probably will and the year-over-year rates are ebbing. Still, that's about 6% of the basket so the way Canada directly captures house prices won't have the same big disinflationary impact as the (lagging) way that US OER does but it is likely to happen faster in Canada.
Clothing was up 1.6% m/m NSA but less than seasonally normal as the lines change over toward winterwear. SA clothing was -0.2% m/m.
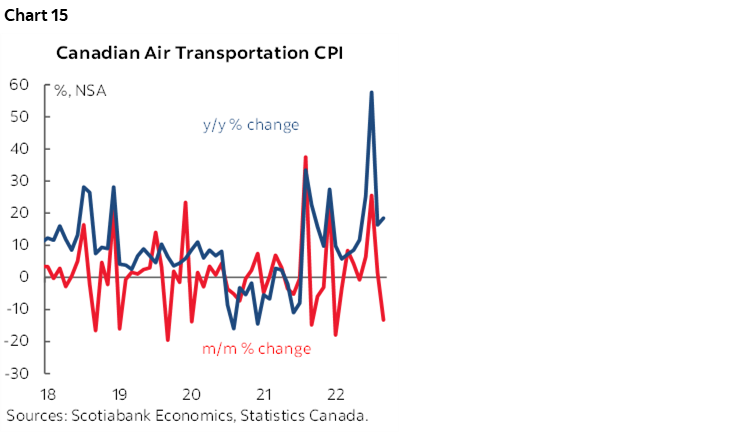
Charts 8–16 show select other measures. Also see the full table at the back of this publication that provides a detailed breakdown of the basket including micro-charts and z-score measures of changes in relation to recent norms across different periods.
BANK OF CANADA IMPLICATIONS
Shall that be 75 or 50 next week Governor Macklem? I’ve been arguing 75bps all week and saying it doesn’t even hinge upon today’s CPI print. My call is 75bps and it is based upon the following arguments slanted toward their CAD commentary, how markets would react and in relation to what the Fed is likely to do.
Start with the fac that Macklem is signalling a return to rate substitutes to CAD moves that, while perhaps debatable in terms of whether they should be thinking this way, nevertheless signals a reaction function that is willing to do more to offset currency weakness. I think he risks being picked off and bumper dragged by FX markets as a currency targeter which is unwise, but it’s what he’s signalling that may matter more at least in the short run. Canada imports a lot and so price pass-through pressures are material but usually treated as modest and typically transitory. Then again, the long-held analyst forecast for USD weakening hasn’t worked well and so serial frustration on the currency front is getting the BoC’s attention. Macklem has said this formally on two separate occasions and so did SDG Rogers. They are not intimating a return to the formal monetary conditions index of the past, but he is explicitly saying that a weak currency means they have to lean on rates harder. CAD has not been listening as it has been stuck in a 1.37–1.38 range throughout their cautions.
So, if the BoC hikes by, say, 50bps and the Fed hikes by 75bps on November 2nd as widely expected, then a negative rate differential would open up across policy rates. All else equal (ha!) that could mean further CAD weakness especially in relation to what is priced which would go against their messaging and look highly inconsistent. Do you want a stronger currency or not? Are you substituting higher rates for a weak currency or not? What time is it on Mars? The messaging and consistency around this issue would look rather erratic.
Furthermore, going just 50 at this point after 75 and before that 100 would risk an RBA style downshifting reaction in markets that eases financial conditions which seems counter to what they wish to happen. You’d get markets saying they’re done or almost there which seems to be against most of their messaging. I think the BoC still needs to appear hawkish and then be open to pivoting later if needed. Unlike Australia, Canada has much firmer trend wage growth, greater attachment to the Fed, ongoing Fed/prov stimulus from Trudeau bucks to Ontario licence refunds to Quebec’s vote bucks etc etc, diff commodities, less direct exposure to China, fresher and firmer inflation readings, a job market is still incredibly tight etc.
So the case for 75bps mostly boils down to a) how serious they are about CAD and credibility around those communications, b) managing markets which admittedly they’re not terribly good at, and c) the Fed’s influences. That’s all in addition to the many other parts of the Canada narrative I’ve been plugging in marketing this season that go beyond just the one call.
If the BoC hikes 75bps next week then they probably have a terminal rate in mind that is in the ballpark of what the FOMC has guided for theirs (4.5-5%). It’s hard to imagine that after a 75bps hike they either stop or downshift to just a 25bps and then perhaps done.
DISCLAIMER
This report has been prepared by Scotiabank Economics as a resource for the clients of Scotiabank. Opinions, estimates and projections contained herein are our own as of the date hereof and are subject to change without notice. The information and opinions contained herein have been compiled or arrived at from sources believed reliable but no representation or warranty, express or implied, is made as to their accuracy or completeness. Neither Scotiabank nor any of its officers, directors, partners, employees or affiliates accepts any liability whatsoever for any direct or consequential loss arising from any use of this report or its contents.
These reports are provided to you for informational purposes only. This report is not, and is not constructed as, an offer to sell or solicitation of any offer to buy any financial instrument, nor shall this report be construed as an opinion as to whether you should enter into any swap or trading strategy involving a swap or any other transaction. The information contained in this report is not intended to be, and does not constitute, a recommendation of a swap or trading strategy involving a swap within the meaning of U.S. Commodity Futures Trading Commission Regulation 23.434 and Appendix A thereto. This material is not intended to be individually tailored to your needs or characteristics and should not be viewed as a “call to action” or suggestion that you enter into a swap or trading strategy involving a swap or any other transaction. Scotiabank may engage in transactions in a manner inconsistent with the views discussed this report and may have positions, or be in the process of acquiring or disposing of positions, referred to in this report.
Scotiabank, its affiliates and any of their respective officers, directors and employees may from time to time take positions in currencies, act as managers, co-managers or underwriters of a public offering or act as principals or agents, deal in, own or act as market makers or advisors, brokers or commercial and/or investment bankers in relation to securities or related derivatives. As a result of these actions, Scotiabank may receive remuneration. All Scotiabank products and services are subject to the terms of applicable agreements and local regulations. Officers, directors and employees of Scotiabank and its affiliates may serve as directors of corporations.
Any securities discussed in this report may not be suitable for all investors. Scotiabank recommends that investors independently evaluate any issuer and security discussed in this report, and consult with any advisors they deem necessary prior to making any investment.
This report and all information, opinions and conclusions contained in it are protected by copyright. This information may not be reproduced without the prior express written consent of Scotiabank.
™ Trademark of The Bank of Nova Scotia. Used under license, where applicable.
Scotiabank, together with “Global Banking and Markets”, is a marketing name for the global corporate and investment banking and capital markets businesses of The Bank of Nova Scotia and certain of its affiliates in the countries where they operate, including; Scotiabank Europe plc; Scotiabank (Ireland) Designated Activity Company; Scotiabank Inverlat S.A., Institución de Banca Múltiple, Grupo Financiero Scotiabank Inverlat, Scotia Inverlat Casa de Bolsa, S.A. de C.V., Grupo Financiero Scotiabank Inverlat, Scotia Inverlat Derivados S.A. de C.V. – all members of the Scotiabank group and authorized users of the Scotiabank mark. The Bank of Nova Scotia is incorporated in Canada with limited liability and is authorised and regulated by the Office of the Superintendent of Financial Institutions Canada. The Bank of Nova Scotia is authorized by the UK Prudential Regulation Authority and is subject to regulation by the UK Financial Conduct Authority and limited regulation by the UK Prudential Regulation Authority. Details about the extent of The Bank of Nova Scotia's regulation by the UK Prudential Regulation Authority are available from us on request. Scotiabank Europe plc is authorized by the UK Prudential Regulation Authority and regulated by the UK Financial Conduct Authority and the UK Prudential Regulation Authority.
Scotiabank Inverlat, S.A., Scotia Inverlat Casa de Bolsa, S.A. de C.V, Grupo Financiero Scotiabank Inverlat, and Scotia Inverlat Derivados, S.A. de C.V., are each authorized and regulated by the Mexican financial authorities.
Not all products and services are offered in all jurisdictions. Services described are available in jurisdictions where permitted by law.