- Canada’s economy stays on the plus side in Q3
- The economy is still in inflationary excess demand
- Canada to offer Budget update next Thursday
- US inflation measures remain hot
- CDN GDP m/m % change, August, SA:
- Actual: 0.1
- Scotia: 0.1
- Consensus: 0.0
- Prior: 0.1
- September ‘flash’: 0.1
Canada’s economy isn’t looking so shabby after all! At least so far. The economy matched my above-consensus reading and grew by 0.1% m/m in August. It then posted another 0.1% gain in September that was better than I had thought it might have been at least on the first guesstimates from Statcan. That’s not great growth, but consider the context below. The C$ largely shook it off and Canada’s two-year bond yield initially moved 2–3bps higher post-data but has since come back down.
This leaves us tracking Q3 GDP growth of about 1.6% at an annualized rate (chart 1). Q4 has ½% growth at an annualized rate ‘baked in’ and based upon the Q3 average and the way the quarter ended before we get any actual data for Q4.
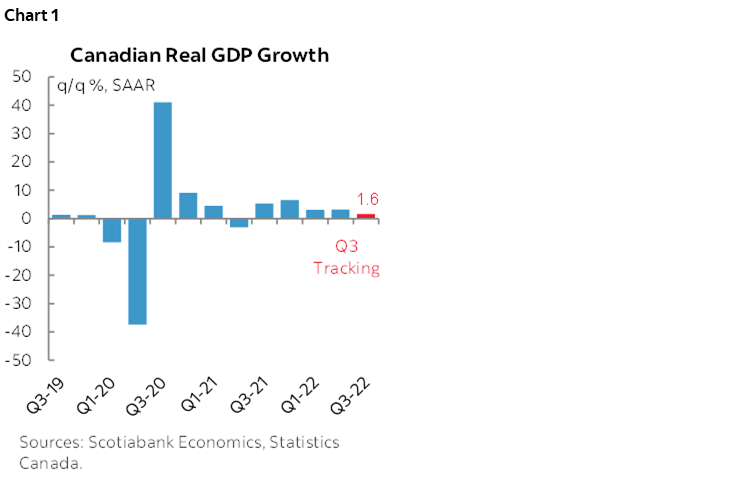
How does that compare to what the Bank of Canada just forecast for Q3? Using different accounts that cover the expenditure side they estimate growth of 1.5% in Q3 at a q/q annualized pace. That’s a different concept to the 1.6% tracking above that uses production side accounts that don’t fully capture how the economy grew including through inventory investment swings and changes in net trade including import leakage effects. Still, it’s feasible that the BoC’s forecast for a mild continued expansion in Q3 may be tracking well.
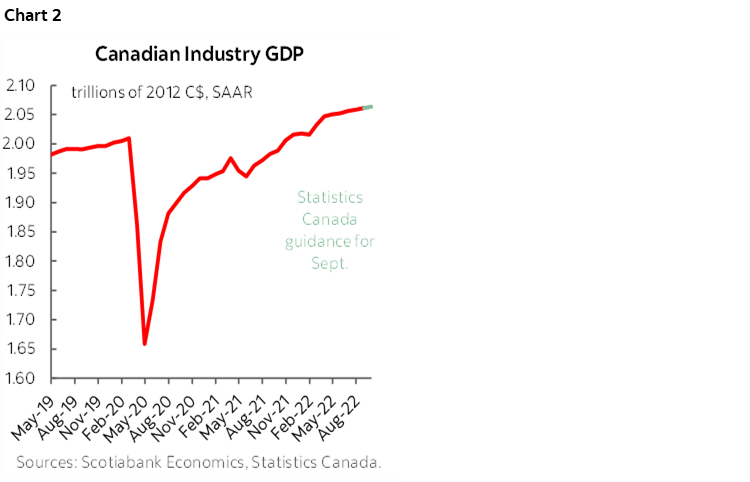
The economy is now 2.7% larger than it was in February 2020 before the pandemic struck with full force (chart 2). That might not sound like much, but amidst all of the damage done to the supply side of the global economy the combination has contributed to net excess demand and inflationary pressures.
The fact the economy is eking out any growth is a minor miracle of sorts in the wake of the torrid pace of growth before that. Q2 grew by 4.2%, Q1 posted growth of 3.7%, 2021Q4 grew by 6.6% and 2021Q3 grew at a similar rate of 5.7%. The economy has been on fire and the envy of much of the rest of the world while strongly outpacing international peers right up to the summer. The Canadian economy is now petering out but not yet contracting. The four quarters of enormous growth brought forward some momentum, but not in some bone-crushing fashion.
There was decent breadth to the August GDP figures with 14 of 20 sectors up (chart 3). Service sector GDP led the way with a gain of 0.3% m/m and goods sector GDP was down 0.3%. Chart 4 shows the weighted contributions to growth by sector behind the 0.1% m/m Canadian GDP gain in August.
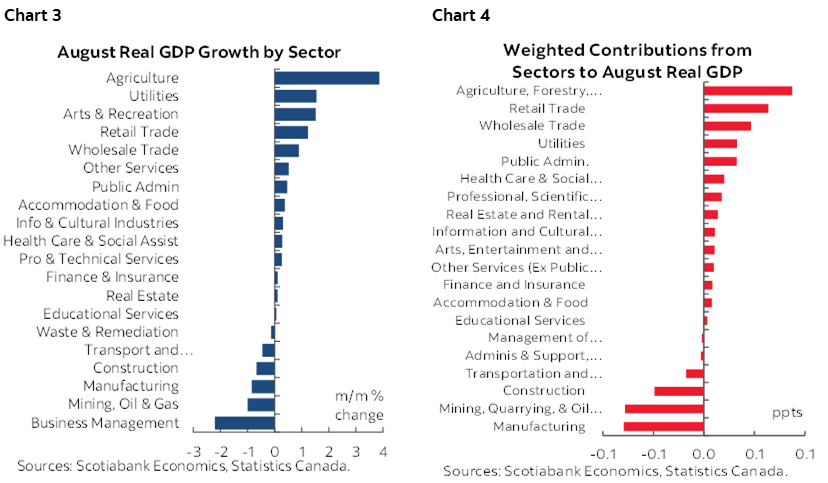
Within the goods sector, ag/forestry up 3.9% m/m as Cdn crop conditions have generally been much better than, say, Europe's drought. Mining/o&g down 1%, utilities up 1.5%, construction up 0.7% and manufacturing down 0.8%
Within services during August, retail as up 1.2%, wholesale 0.9%, arts/entertainment was up 1.5% as the biggest upsides. The biggest downsides were the small weight on management of companies (-2.2%) and transportation/warehousing (-0.5%)
As for September, we don’t get actual numbers, but general guidance points to gains in oil & gas and manufacturing offset by weaker construction.
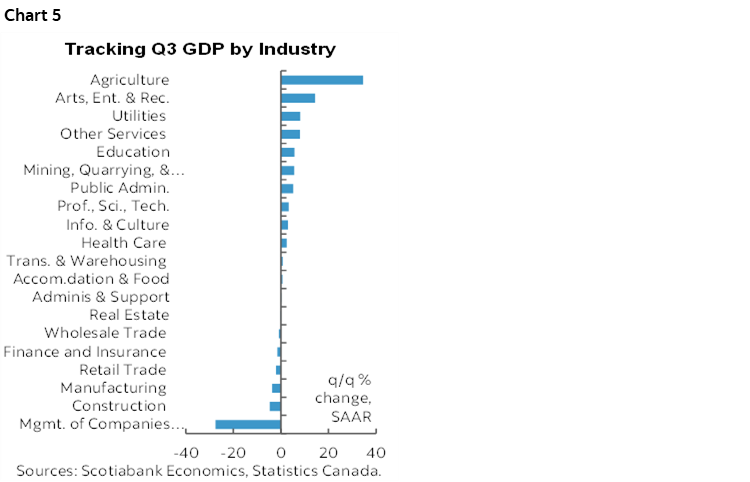
Chart 5 shows tracking of Q3 GDP growth by sector. Agriculture is crushing it with assists from other sectors and few material downsides.
BUDGET UPDATE COMING
Canadian Finance Minister Chrystia Freeland will offer the Fall fiscal update next Thursday after markets close (announcement here).
HOT US INFLATION
At the same time that Canada was releasing GDP, the US updated a couple of important inflation measures that met expectations and continue to run hot.
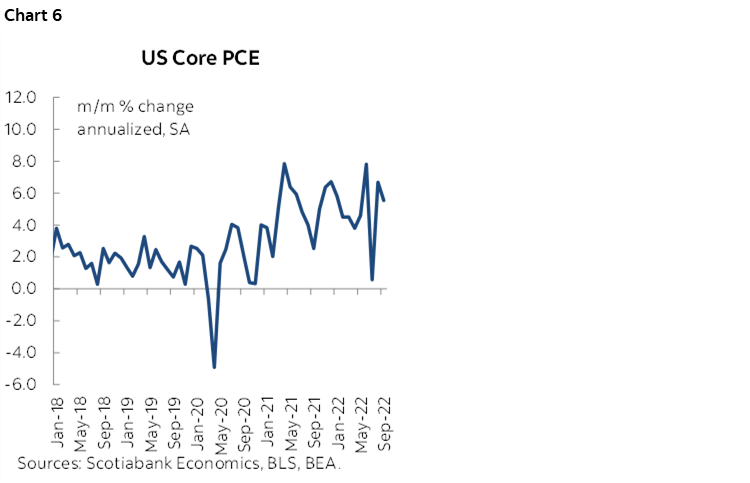
Core PCE inflation (ex-food and energy) met expectations for a gain of 0.5% m/m in September. We already had core CPI and so it’s not a big surprise that core PCE met expectations. Chart 6 shows that the annualized rise remains hot and that hope that inflationary pressures in the US economy remains nothing more than hope.
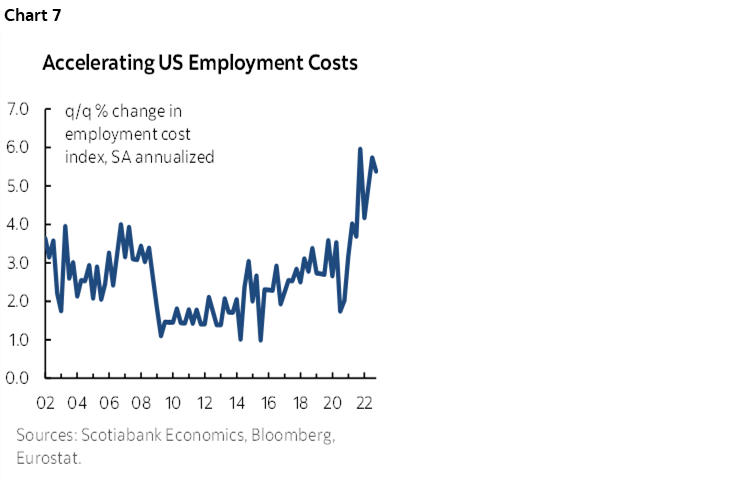
Ditto on US employment costs that climbed by 1.2% q/q non-annualized in Q3. At an annualized rate, employment costs have been soaring as shown in the final chart.
Into next Wednesday’s FOMC meeting, I would expect Fed Chair Powell to ask whether the dovish pivot folks have been looking at the same data!
DISCLAIMER
This report has been prepared by Scotiabank Economics as a resource for the clients of Scotiabank. Opinions, estimates and projections contained herein are our own as of the date hereof and are subject to change without notice. The information and opinions contained herein have been compiled or arrived at from sources believed reliable but no representation or warranty, express or implied, is made as to their accuracy or completeness. Neither Scotiabank nor any of its officers, directors, partners, employees or affiliates accepts any liability whatsoever for any direct or consequential loss arising from any use of this report or its contents.
These reports are provided to you for informational purposes only. This report is not, and is not constructed as, an offer to sell or solicitation of any offer to buy any financial instrument, nor shall this report be construed as an opinion as to whether you should enter into any swap or trading strategy involving a swap or any other transaction. The information contained in this report is not intended to be, and does not constitute, a recommendation of a swap or trading strategy involving a swap within the meaning of U.S. Commodity Futures Trading Commission Regulation 23.434 and Appendix A thereto. This material is not intended to be individually tailored to your needs or characteristics and should not be viewed as a “call to action” or suggestion that you enter into a swap or trading strategy involving a swap or any other transaction. Scotiabank may engage in transactions in a manner inconsistent with the views discussed this report and may have positions, or be in the process of acquiring or disposing of positions, referred to in this report.
Scotiabank, its affiliates and any of their respective officers, directors and employees may from time to time take positions in currencies, act as managers, co-managers or underwriters of a public offering or act as principals or agents, deal in, own or act as market makers or advisors, brokers or commercial and/or investment bankers in relation to securities or related derivatives. As a result of these actions, Scotiabank may receive remuneration. All Scotiabank products and services are subject to the terms of applicable agreements and local regulations. Officers, directors and employees of Scotiabank and its affiliates may serve as directors of corporations.
Any securities discussed in this report may not be suitable for all investors. Scotiabank recommends that investors independently evaluate any issuer and security discussed in this report, and consult with any advisors they deem necessary prior to making any investment.
This report and all information, opinions and conclusions contained in it are protected by copyright. This information may not be reproduced without the prior express written consent of Scotiabank.
™ Trademark of The Bank of Nova Scotia. Used under license, where applicable.
Scotiabank, together with “Global Banking and Markets”, is a marketing name for the global corporate and investment banking and capital markets businesses of The Bank of Nova Scotia and certain of its affiliates in the countries where they operate, including; Scotiabank Europe plc; Scotiabank (Ireland) Designated Activity Company; Scotiabank Inverlat S.A., Institución de Banca Múltiple, Grupo Financiero Scotiabank Inverlat, Scotia Inverlat Casa de Bolsa, S.A. de C.V., Grupo Financiero Scotiabank Inverlat, Scotia Inverlat Derivados S.A. de C.V. – all members of the Scotiabank group and authorized users of the Scotiabank mark. The Bank of Nova Scotia is incorporated in Canada with limited liability and is authorised and regulated by the Office of the Superintendent of Financial Institutions Canada. The Bank of Nova Scotia is authorized by the UK Prudential Regulation Authority and is subject to regulation by the UK Financial Conduct Authority and limited regulation by the UK Prudential Regulation Authority. Details about the extent of The Bank of Nova Scotia's regulation by the UK Prudential Regulation Authority are available from us on request. Scotiabank Europe plc is authorized by the UK Prudential Regulation Authority and regulated by the UK Financial Conduct Authority and the UK Prudential Regulation Authority.
Scotiabank Inverlat, S.A., Scotia Inverlat Casa de Bolsa, S.A. de C.V, Grupo Financiero Scotiabank Inverlat, and Scotia Inverlat Derivados, S.A. de C.V., are each authorized and regulated by the Mexican financial authorities.
Not all products and services are offered in all jurisdictions. Services described are available in jurisdictions where permitted by law.