Next Week's Risk Dashboard
• Jobs: US, Canada, NZ
• CBs: BoE, RBA, Norges, Brazil…
• …Negara, BoT, Turkey
• PMIs: US, Canada, China, India…
• …Italy, Spain, Mexico, Brazil
• Inflation across LatAm, Asia-Pacific
• How jobs markets affect the BoC versus Fed dynamic
• Assessing BoE taper risk
Chart of the Week

JOBS—CANADA & US HEADED IN OPPOSITE DIRECTIONS, FOR NOW
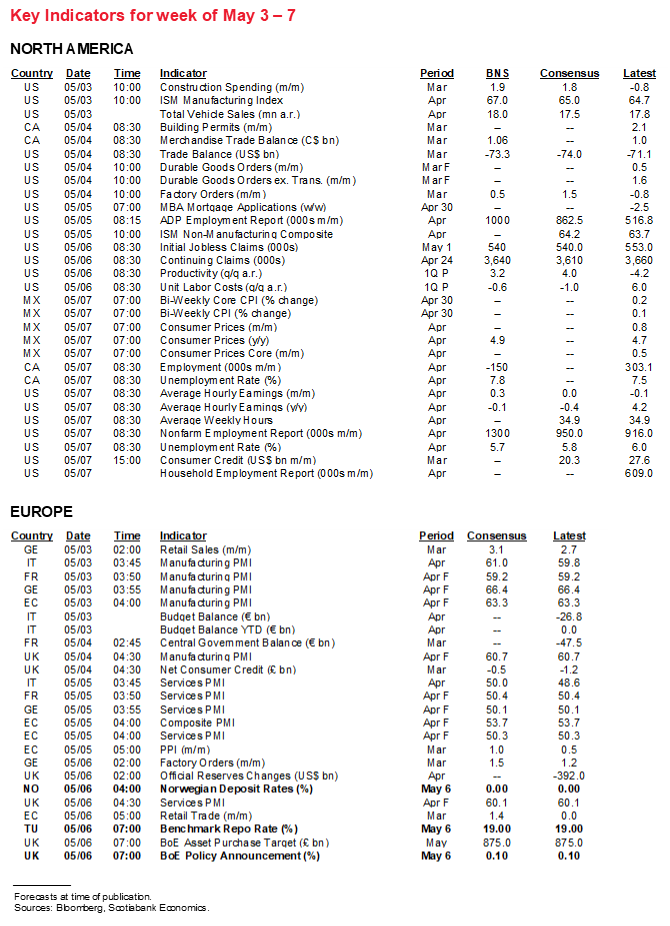
The US, Canada and New Zealand update jobs reports on Friday. Canada and the US could be going in starkly opposite directions this time. New Zealand’s figure is a lower frequency reading that lags for Q1 but it will probably garner relatively little attention amid expectations for little change. What follows is an explanation of how the US and Canadian jobs estimates were arrived at, but also how one should come to view the metrics for relative labour market performance and how they may influence Bank of Canada versus Federal Reserve policy.
US—THE FRUITS OF ‘AMERICA FIRST’
Rapidly easing restrictions and callback effects are expected to drive another strong payroll gain of around 1¼ million on Friday with the unemployment rate dipping to 5.7% from 6%. Distorted wage growth will perversely go from over 4% y/y to roughly nothing in a nanosecond and mainly due to the year-ago rebasing effect to when lower-income workers disproportionately dropped out of the wage readings and popped higher the April 2020 average wage of employed workers.
We won’t get several of the advance readings on labour market conditions that go into a nonfarm call until the coming week and therefore may revise these estimates. Wednesday’s ADP payrolls figure plus Monday’s ISM-manufacturing-employment and Wednesday’s ISM-services-employment figures could swing the nonfarm estimates around in either direction, though strength is expected in those readings as well.
What we can observe is the sharp easing of COVID-19 restrictions into the end of March and through April (chart 1) that should translate into a strong reopening effect on employment particularly in the most affected service industries like restaurants (chart 2). As a consequence to reopening, weekly jobless claims fell by ~200k between the March and April nonfarm reference periods (chart 3). We also know that consumers indicated the single biggest improvement in jobs availability from one month to the next on record which may have revealed possibly greater upside to hiring than estimated (chart 4).

What explains all of this? Deficits and vaccine hording. Simply put, after doing one of the world’s worst jobs at managing the pandemic, the US government is spending its way to medium-term growth while only now loosening its vaccine hording policies by sharing what it doesn’t approve for its own people.
CANADA—A TEMPORARY PULLBACK
Canada, on the other hand, is likely to shed jobs on Friday and there will be four considerations behind the estimated 150,000 drop.
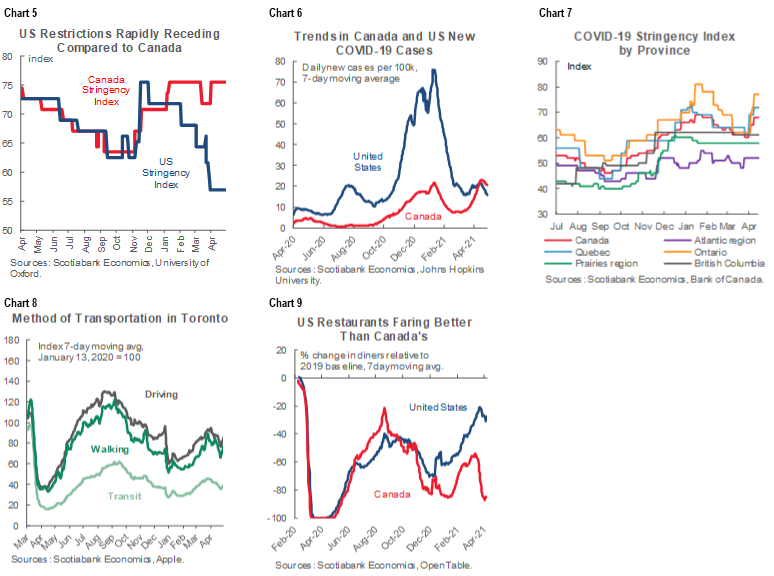
First, unlike the US, Canada has tightened restrictions to counter a third wave of COVID-19 cases (chart 5). The cumulative case rate per capita remains a fraction of the rate in the US, but new cases per capita took off in Canada while continuing to decline overall in the US though the differential between the two countries is nowhere nearly as large as one might think (chart 6). Tightened restrictions became particularly acute in the most population-dense regions of the country, like Ontario, Quebec and BC (chart 7). Mobility readings in the country’s biggest city did about what one would have expected (chart 8). Restrictions, lockdowns and stay at home orders have had obvious effects on sectors like restaurants during April (chart 9). Expect categories like accommodation and food services, retail, information, culture and recreation to show significant retrenchments.
Second, Ontario’s delayed ‘Spring break’ may drive lost jobs in the education sector. Ontario registered an unusual gain in education sector jobs during March that drove the national education jobs total up by 35k because teachers and support workers worked through the week that would have traditionally been the break. The delayed break in April was the same week as the Labour Force Survey’s reference week and technically education sector employment will dip by probably ~30k this time around.
Third, Canada has been hiring 30–35k workers for the May 2021 Census. Enumerators and others may start to show up in April but with more of that transitory hiring likely in May. If so, then take out any surge in public administration employment in order to get a cleaner jobs reading.
There is also the matter of how employment performed outside of the service sectors that bear the brunt of the restrictions. We could continue to see some bright spots in resources and manufacturing to help guard against a much worse job reading.
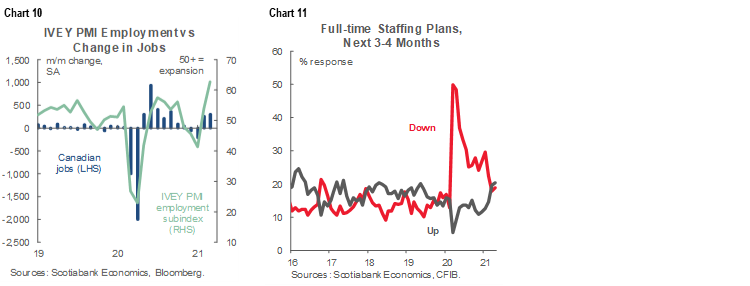
In any event, this should be a transitory hit for April and likely May given that in Ontario’s case the restrictions are expected to last through the next Labour Force Survey reference period. If Canada’s COVID-19 new case curve continues to bend, then we could see restrictions ease as soon as later in May while the vaccine curve continues to rip higher. So far, employers are indicating such expectations by looking through nearer-term disruptions as captured by hiring intentions (charts 10, 11).
If all goes well, Canada could therefore wind up back at full employment later this summer.
RELATIVE LABOUR MARKETS AND CENTRAL BANKS
One question I’m often asked of late concerns how Canada may be able to achieve such a full employment milestone so far ahead of the US and how that would jive with an unemployment rate that is still so much higher than the US. Wouldn’t that signal that Canada has much more labour slack than the US? If so, given inclusive full employment mantras across central banks these days, why would the BoC even dream of hiking before the Fed?
Let’s first tackle the differences in unemployment rates. Much of the official gap between the 8.1% Canadian rate and the 6.0% US rate is due to measurement differences as explained here and shown in chart 12. When Canada’s unemployment rate is measured in a way that is comparable to the US methodology, the Canadian rate measured along US lines drops to 6.9% (here). The US applies stricter criteria to defining who is in the labour force, who is unemployed, and who is not—on both counts; or perhaps the US undercounts the unemployed and this results in an artificially low unemployment rate—you pick! I think it’s a touch of both which might also help an American audience understand how the US job market could get so tight in past years at least when measured by the official unemployment rate without stoking wage pressures. In any event, that’s still a little higher unemployment rate in Canada than the US, but nowhere near the apparent 2.1 point spread in the official rates.

Going further, the so-called U-6 US measure of unemployment and underemployment stands at 10.7% versus the official Canadian R8 analog that stands at 11.4%. The 2.1 spread in official unemployment rates before adjusting to comparable concepts only translates into a 0.7% gap between the two countries’ underemployment rates. After accounting for measurement differences in the official unemployment rates, it’s likely that Canada’s underemployment rate measured along US lines could be lower than the US rate.
Another key is to acknowledge that Canada tends to have a higher natural rate of unemployment than the US even at the best of times. Canada’s NAIRU (non-accelerating inflation rate of unemployment) is higher than the US as shown in OECD estimates (chart 13). Canada’s NAIRU stands at 6.2% versus 4.1% in the US. Canada would be expected to witness full employment and begin to court faster wage growth and the cost-push variety of inflation at a higher unemployment rate than the US.

As for the separate issue of why Canada has experienced an apparent jobs miracle that has outpaced US jobs, perhaps don’t cheer quite as loudly as there may be a cost to having done so. There are at least four plausible explanations. One is that Canada implemented job market support programs and steadily extended them in more convincing fashion than the US did last year, though this relative outperformance has been changed by the last couple of enacted US stimulus bills. Second is that Canada applied much more stimulus as a share of the economy and as indicated by deficits during 2020 than the US and multiple other countries, though this is also changing as the US embraces a heavy spending bias. Third is that Canada also benefits from an upturn in the commodity cycle and more so than the US.
But chart 14 may be the ultimate explanation. Coming out of the GFC and pandemic, US employers tended to emphasize faster productivity growth than Canada experienced. I won’t attach a normative assessment of which approach is better, but where Canada may do a better job at regaining lost employment sooner than the US, the US may outperform on productivity growth and hence profits and stock market returns. You pick which system you like best. Still, the US advantage may well hold up better in the long run across all of these measures.

To bring this section full circle, the punch-line is this: Canada may recoup all jobs lost to the pandemic earlier than the US while achieving full employment sooner in relation to a lower standard before courting potential inflation. If that’s the case, then the BoC’s take on the relative performance of the job market could well have it hiking ahead of the Fed even independently of other arguments such as relative spare capacity.
CENTRAL BANKS—BAILEY’S CIRCUMSTANCES SHARPLY DIFFER FROM MACKLEM’S
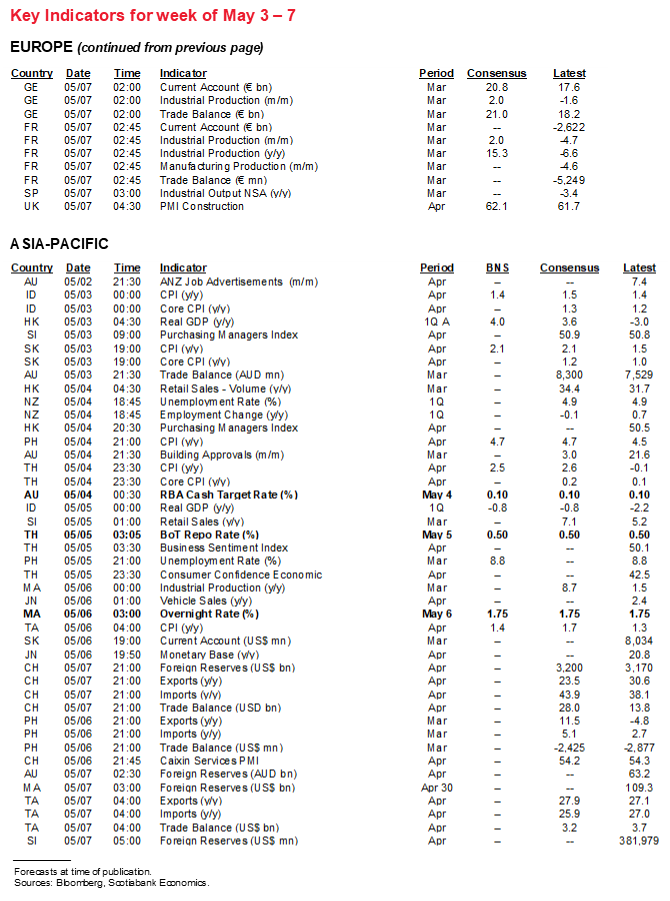
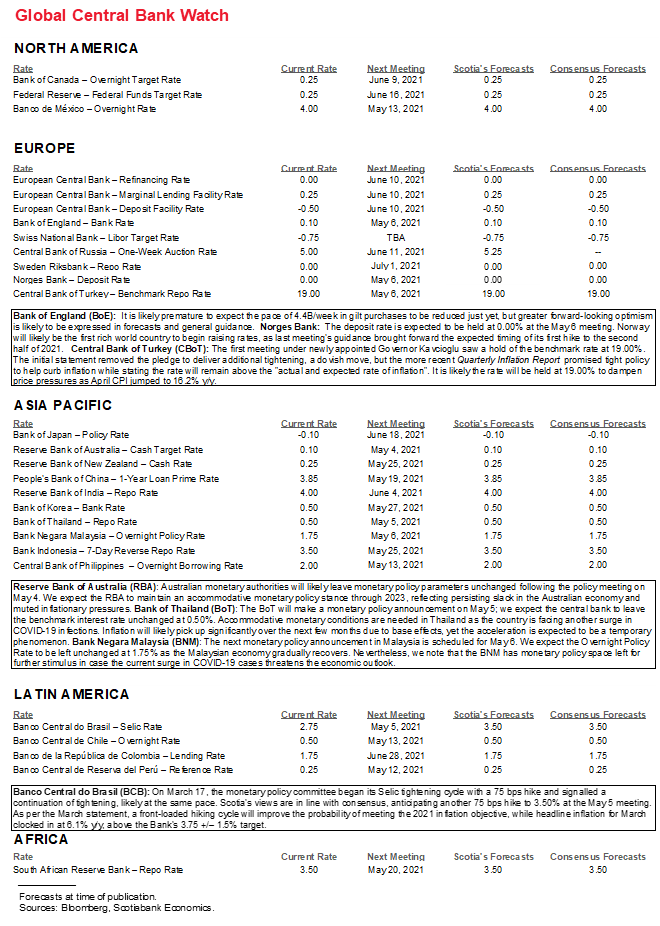
Seven central banks will deliver policy decisions over the coming week. The main event may be the Bank of England, but Brazil is expected to hike, there is a bit of buzz around the RBA, and Norges will be monitored for tweaks to a tightening bias. The other three should be largely non-events.
Bank of England—Why Now?
The Bank of England delivers its decisions on Thursday at 12pmGMT (7amET). The key is whether the BoE will join the Bank of Canada in reducing purchases of gilts, also known as tapering. It has been buying at a £4.4 billion pace per week (chart 15). There is a range of opinions on whether to taper now or at a subsequent meeting into the summer. One can’t rule out the possibility that the BoE does so now, but I just don’t see the parallels between conditions faced by the two central banks and so it seems premature to expect the BoE to become an early-taper central bank relative to others. My comfort zone is defined closer to the North American side of the pond, but it may be worth drawing parallels between circumstances in the UK and Canada.

For one thing, unlike Canada, the UK has not had a material jobs recovery to date with most of the plunge since the pandemic struck still largely and rather unfortunately intact (chart 16). That removes one fundamental argument that the UK economy no longer needs as much nonconventional monetary policy stimulus.

Furthermore, Governor Bailey must be terribly green with envy toward the kind of economic growth his counterpart in Governor Macklem is lapping up in Canada. The UK economy posted decent but much milder growth in Q4 than Canada, and the UK economy contracted again in 2021Q1 whereas Canada grew at an estimated 6–7% q/q annualized clip. As a consequence, the UK economy has a considerably wider output gap —and hence more slack—than Canada does at present.
As a partial reflection of more spare capacity, UK inflation remains at just over half the BoE’s 2% target on both a headline and core basis versus the higher core reading in Canada that serves as the operational guide to achieving the 2% headline target (chart 17). In short, I would think that Governor Bailey is likely to say that not enough progress has been achieved to merit pulling back on the throttle just yet.

On the plus side, however, the BoE is likely to upgrade forecasts because of vaccine progress, plunging new COVID-19 cases and the recent budget delivered by Chancellor of the Exchequer Rishi Sunak that added more nearer-term stimulus. Restrictions are easing at a quicker pace than the BoE incorporated into expectations for Q2 and Q3 GDP growth averaging around 5%, so watch for possible upgrades. That leaves the door open for Bailey to, say, sound like the BoC did on the path to when it eventually tapered by saying something like if the outlook were to evolve as we expect then it’s feasible we will be having a more serious discussion about reducing stimulus at a later date.
In any event, talk of negative rates is out the window (at least in the market’s mind) in favour of hike signals. Markets will keep a keen eye out for when the BoE signals it expects to durably achieve its inflation target in relation to market pricing for rate hikes (chart 18).

Brazil—Don’t Say We Didn’t Tell You!
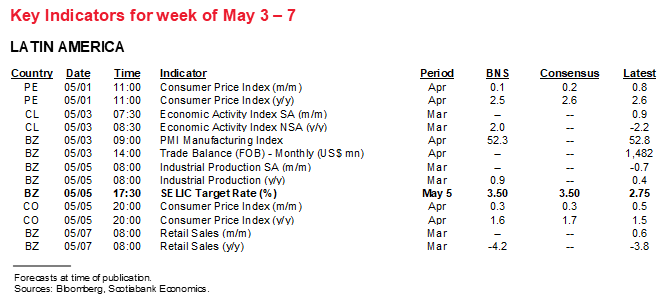
Consensus is unanimous in expecting a 75bps hike in the Selic rate to 3.5% on Wednesday. What conviction during unusual times! Why? Well, you see, it helps when the central bank tells you in advance what they will do which removes much of the intrigue and mystique that often surrounds the game. In its last statement when they hiked 75bps to 2.7% on March 17th (here) they said:
“For the next meeting, unless there is a significant change in inflation projections or in the balance of risks, the Committee foresees the continuation of the partial normalization process with another adjustment, of the same magnitude, in the degree of monetary stimulus. The Copom emphasizes that its view for the next meeting will continue to depend on the evolution of economic activity, the balance of risks, and inflation projections and expectations.”
If there is much intrigue left, then it centers upon how to define “partial normalization” as a guide to the magnitude and pace of future hikes and that’s the part that may be watched the most closely.
Norges Bank—Ah, if Only Others Were as Clear!
Norges is not expected to alter policy on Thursday, but timing potential rate hikes may be further informed by the tone of the communications and any alterations to forward rate guidance. Recall that it brought forward rate hike guidance at the March meeting when it said that “The policy rate forecast implies a gradual rise from the latter half of 2021.” Norway’s much greater reliance upon oil than Canada coupled with the fact that proxies like Brent crude have nearly doubled since the pandemic low leaves a greater share of its economy more exposed to greater upside risk.
RBA—Also Not Looking Very Canadian
Tuesday’s decision may inform expectations in the market that the central bank may be predisposed toward extending its nonconventional monetary policies—including bond buying and yield curve control—in subsequent meetings. For now, the main risk is whether it alters the benchmark bond used to implement its 3 year yield target of 0.1% perhaps toward the November 2024 note which would imply slightly greater reach up the curve by its target. Unlike the BoC that tapered a second time this past month, the RBA faces somewhat different circumstances including less direct exposure to the booming US economy, a different commodity cycle, and the recent weaker-than-expected Q1 inflation reading. Inflation only climbed two-tenths to 1.1% y/y (1.4% consensus) with trimmed mean and weighted median measures at 1.3% and 1.3% which results in a more significant shortfall to a 2–3% inflation target than is the case for Canadian inflation in relation to the BoC’s theoretically symmetric 2% inflation target as the midpoint of a 1–3% range.
The Bank of Thailand (Wednesday), Bank Negara Malaysia (Thursday) and Turkey’s colourful central bank (Thursday) are all expected to stay on hold.
GROWTH AND INFLATION SIGNALS
While there will be a multitude of macro reports released by countries across the world over the coming week, the main batches of potential consequence to global and regional markets will be purchasing managers’ indices and inflation readings.
PMIs—Divergent Growth Prospects
The US updates ISM manufacturing (Monday) and services (Wednesday) for April. Both are expected to increase and be driven by reopening of the US economy. Monday’s manufacturing reading should follow higher the gain in regional surveys (chart 19) that under-represent auto sales that are expected to climb to 18 million. The services PMI should benefit from relaxed restrictions as previously noted.

India’s tragic experience with soaring COVID-19 cases is a human toll that cannot be described by mere statistics. There is likely to be downside risk to purchasing managers’ indices that are due out on Monday and Wednesday. Chart 20 shows the connection to Indian GDP growth.

Eurozone PMIs will be revised on Monday for the month of April by including estimates from Italy and Spain plus any revisions to German and French figures.
China completes the round of PMIs with the missing private services and composite readings on Thursday night (eastern time as usual). They will be watched for further signs of cooling as indicated by the state’s PMIs but not the private manufacturing PMI.
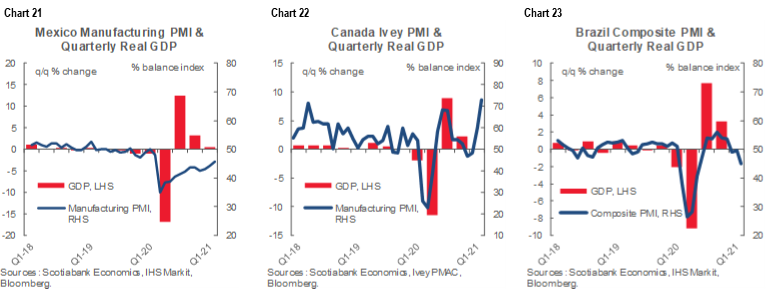
Mexico will update its manufacturing PMI that has been edging closer toward growth as shown in chart 21 (Monday), Canada updates its manufacturing PMI (Monday) and its Ivey gauge (Friday, chart 22) and Brazil will round out the suite of readings with estimates on Monday and Wednesday set against the backdrop of a tumbling PMI (chart 23)
Inflation
A round of inflation reports arrives mainly from across Asia-Pacific and Latin American economies. Peru kicks it off over the weekend, followed by South Korea and Indonesia on Monday, Thailand on Tuesday, Switzerland and Colombia (Wednesday), Taiwan on Thursday and then Mexico and Chile on Friday.


DISCLAIMER
This report has been prepared by Scotiabank Economics as a resource for the clients of Scotiabank. Opinions, estimates and projections contained herein are our own as of the date hereof and are subject to change without notice. The information and opinions contained herein have been compiled or arrived at from sources believed reliable but no representation or warranty, express or implied, is made as to their accuracy or completeness. Neither Scotiabank nor any of its officers, directors, partners, employees or affiliates accepts any liability whatsoever for any direct or consequential loss arising from any use of this report or its contents.
These reports are provided to you for informational purposes only. This report is not, and is not constructed as, an offer to sell or solicitation of any offer to buy any financial instrument, nor shall this report be construed as an opinion as to whether you should enter into any swap or trading strategy involving a swap or any other transaction. The information contained in this report is not intended to be, and does not constitute, a recommendation of a swap or trading strategy involving a swap within the meaning of U.S. Commodity Futures Trading Commission Regulation 23.434 and Appendix A thereto. This material is not intended to be individually tailored to your needs or characteristics and should not be viewed as a “call to action” or suggestion that you enter into a swap or trading strategy involving a swap or any other transaction. Scotiabank may engage in transactions in a manner inconsistent with the views discussed this report and may have positions, or be in the process of acquiring or disposing of positions, referred to in this report.
Scotiabank, its affiliates and any of their respective officers, directors and employees may from time to time take positions in currencies, act as managers, co-managers or underwriters of a public offering or act as principals or agents, deal in, own or act as market makers or advisors, brokers or commercial and/or investment bankers in relation to securities or related derivatives. As a result of these actions, Scotiabank may receive remuneration. All Scotiabank products and services are subject to the terms of applicable agreements and local regulations. Officers, directors and employees of Scotiabank and its affiliates may serve as directors of corporations.
Any securities discussed in this report may not be suitable for all investors. Scotiabank recommends that investors independently evaluate any issuer and security discussed in this report, and consult with any advisors they deem necessary prior to making any investment.
This report and all information, opinions and conclusions contained in it are protected by copyright. This information may not be reproduced without the prior express written consent of Scotiabank.
™ Trademark of The Bank of Nova Scotia. Used under license, where applicable.
Scotiabank, together with “Global Banking and Markets”, is a marketing name for the global corporate and investment banking and capital markets businesses of The Bank of Nova Scotia and certain of its affiliates in the countries where they operate, including; Scotiabank Europe plc; Scotiabank (Ireland) Designated Activity Company; Scotiabank Inverlat S.A., Institución de Banca Múltiple, Grupo Financiero Scotiabank Inverlat, Scotia Inverlat Casa de Bolsa, S.A. de C.V., Grupo Financiero Scotiabank Inverlat, Scotia Inverlat Derivados S.A. de C.V. – all members of the Scotiabank group and authorized users of the Scotiabank mark. The Bank of Nova Scotia is incorporated in Canada with limited liability and is authorised and regulated by the Office of the Superintendent of Financial Institutions Canada. The Bank of Nova Scotia is authorized by the UK Prudential Regulation Authority and is subject to regulation by the UK Financial Conduct Authority and limited regulation by the UK Prudential Regulation Authority. Details about the extent of The Bank of Nova Scotia's regulation by the UK Prudential Regulation Authority are available from us on request. Scotiabank Europe plc is authorized by the UK Prudential Regulation Authority and regulated by the UK Financial Conduct Authority and the UK Prudential Regulation Authority.
Scotiabank Inverlat, S.A., Scotia Inverlat Casa de Bolsa, S.A. de C.V, Grupo Financiero Scotiabank Inverlat, and Scotia Inverlat Derivados, S.A. de C.V., are each authorized and regulated by the Mexican financial authorities.
Not all products and services are offered in all jurisdictions. Services described are available in jurisdictions where permitted by law.