Risk Dashboard for August 5th to 16th
- What’s driving market moves? It’s complicated.
- Markets wildly overreacted to distorted US payrolls
- Forecast US-Canada spread compression is underway
- Geopolitical risk may figure prominently
- US CPI could be another soft one
- US ISM-services, retail sales may rebound
- Canadian jobs to stabilize?
- RBA hikes on ice
- RBI could deliver a dovish pivot
- Banxico’s path complicated by the peso
- BCRP expected to hold
- RBNZ could pull forward easing
- PBOC may delay as it shifts benchmarks
- Norges to buy time until September
- BSP expected to cut
- UK jobs, wages, CPI to inform next BoE decision
- Japanese real wages gaining traction?
- Australian jobs and wages pose post-RBA risk
- Chinese Q3 growth tracking
- Canadian home sales going for two in a row
- Other global macro
Chart of the Week
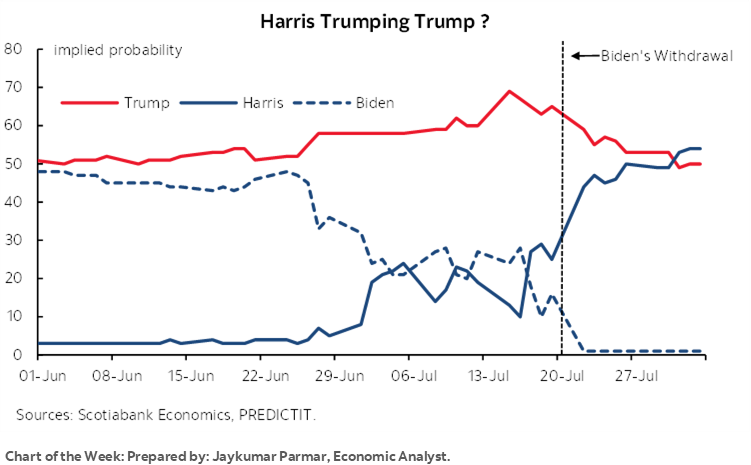
This is a two-week edition of the publication that will highlight the main expected developments over the first half of August. That will take markets closer to the KC Fed’s Jackson Hole Symposium on August 22nd–24th at which point markets are likely to be eager to hear stronger guidance in favour of a rate cut at the September meeting and potential guidance beyond. Most of the coverage will be in terms of calendar-based developments while geopolitical risks could be destabilizing including via the risk of escalating tensions in the Middle East.
Having said that, markets are volatile and overreacting to data. We saw this around the market reaction to nonfarm payrolls that I continue to believe to have been misplaced. July payrolls were soft because of ongoing issues with seasonal adjustments as argued here.
In a broader context, I’ll offer some reasons to be careful toward overinterpreting market developments of late.
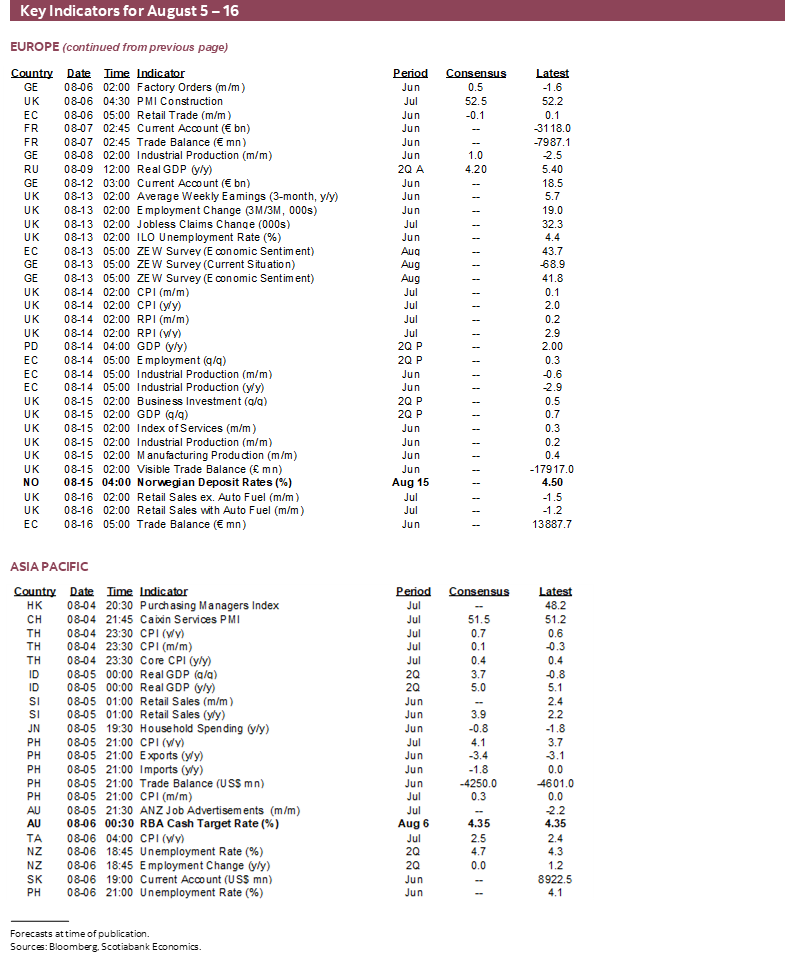
In the meantime before Jackson Hole, the next two weeks will be dominated by US CPI for one thing. There will also be eight central bank decisions over this period. Just about every major region of the world economy faces significant macro data releases. Off-calendar risk may also be high including focal points such as the Middle East and developments along the path toward the US election.
Before turning to all of that I wanted to share a few high level thoughts on developments in market risk appetite given faltering equities, rallying sovereign bonds, instability in credit, and turmoil across FX land.
WHAT’S CAUSING MARKET MOVES?
So what’s driving negative sentiment in equities and lower bond yields? It’s complicated.
It’s August. Chill a Little.
For one thing, always be careful toward month-end effects into thinning August volumes and liquidity. As PMs and other market professionals enter peak summer vacation periods in N.A. and Europe, they may well be playing it safer on their positions. You’d think we would all know better by now than to overreact to volatility around this time of year.
Exaggerated Tech Optimism Being Reined In
Mostly negative earnings from big US tech firms in yesterday’s after-market are also clearly driving some of the negative sentiment perhaps having more to do with how exaggerated the tech craze and AI sentiment had become. The market is also differentiating between winners and losers in tech, and may also be behaving in short-sighted fashion by looking only at the bottom line and ignoring investment surges that drove some of it and that could pay off handsomely over time.
Even on a personal level, do I really want to pay double for an AI laptop compared to a very good regular one when at present—and for probably quite a while yet—the benefits are either miniscule in a practical sense or downright absent? Do I really want to pay $2k+ for a new iphone when as near as I can tell the benefits are extraordinarily marginal?
Cherry-Picking and Misinterpreting US Macro Data
On that note, there is cherry-picking of US data and with debatable interpretations along the way.
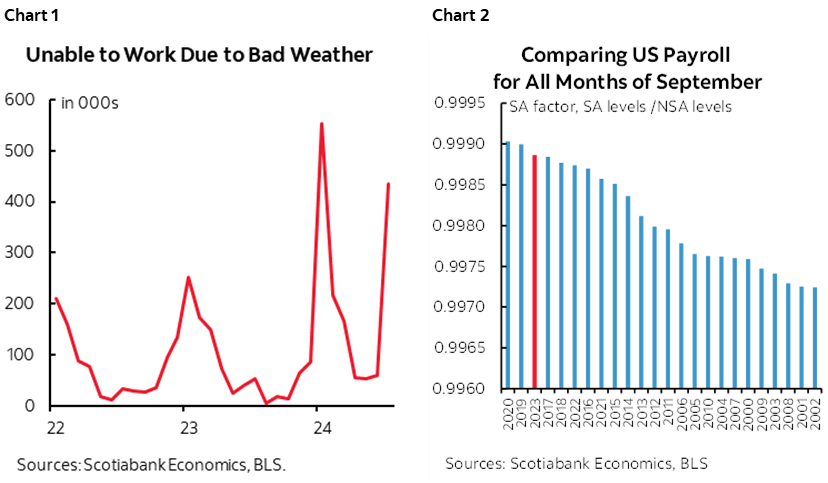
I’ve already given the example of the market reaction to nonfarm payrolls with the link repeated here. The crux of that argument—aside from it being only one report—was that the timing of the pandemic and its effects heavily distorted seasonal adjustments and if we were to use pre-pandemic seasonal adjustments then July’s job gain would have been more impressive. Further, weather may have played an uncertain role via Hurricane Beryl. The BLS dismissed it as a factor, but ’unable to work due to bad weather’ soared in July (chart 1). To drop off nonfarm payrolls you have to be unable to work and with no pay for the entire reference period which depends on the frequency of pay, but you would still count as employed in the household survey unless let go. Note that from September payrolls onward through the rest of the year, the SA factors for monthly nonfarm payrolls tend to be higher in the pandemic era which could be a contributing factor toward a rebound as dubious in nature as the softness in the July report (chart 2).
ISM-manufacturing reflects a small 10% direct share of US GDP and yet its decline sparked concern toward the health of the US economy while ignoring that its sentiment-based production gauge is misaligned with actual hard data on manufacturing output in the Federal Reserve’s figures for industrial production. We’ll see about next week’s ISM-services that is expected to rebound and that reflects a much bigger share of the modern US economy than manufacturing. Ditto for the following week’s US retail sales that are expected to post solid growth.
Markets ignored the lift to US productivity and soft unit labour costs yesterday despite their contribution toward a disinflationary backdrop for constructive Fed easing. They also ignored the solid gain in US vehicle sales despite being smaller than industry guidance.
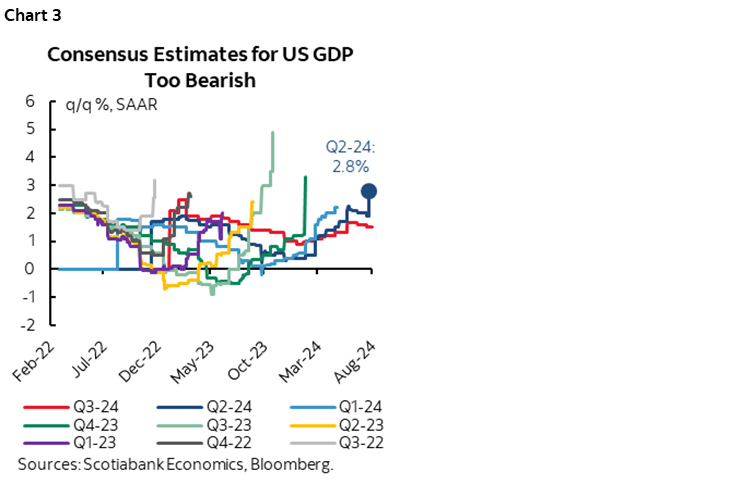
They are also ignoring solid—but highly tentative—nowcasts for Q3 US GDP on the heels of 2.8% q/q SAAR Q2 GDP growth. This is not an economy tracking a recession versus a soft landing. Markets have assumed a recession lies right around the corner and economists have under-predicted growth in the US economy for ages now and been wrong in serial fashion while spending each quarter chasing the numbers higher over and over again (chart 3).
The US Treasury Curve is Finally Waking Up to Fed Easing
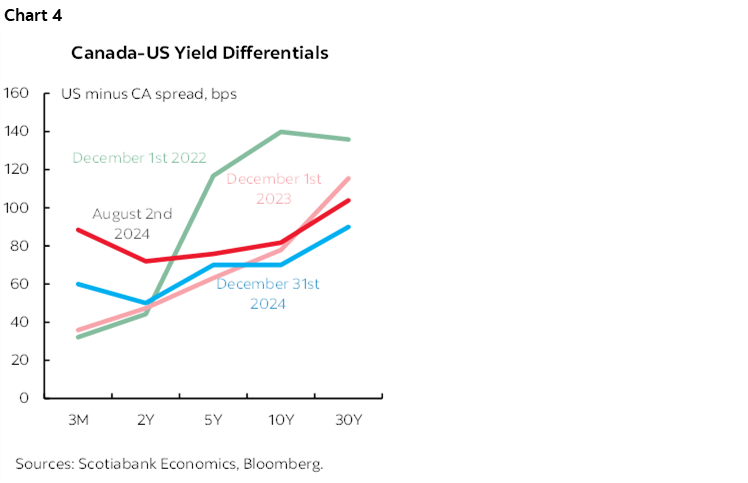
And on rates, the US curve is coming back into alignment toward something more reasonable but with still some way to go in narrowing spreads over other global benchmarks. I’ve long argued that the US front-end is too cheap unless neutral rate estimates are off by massive amounts. The Treasury curve should be rallying as Fed easing comes into clearer sight. The first round spillover effects are putting downward pressure on yields elsewhere such as Canada, but it’s debatable whether this will persist as the Canada curve is getting very richly priced in 5s.
Chart 4 shows our longstanding forecast in favour of US spread compression over Canada.that is coming on side.
The BoJ’s Questionable Moves
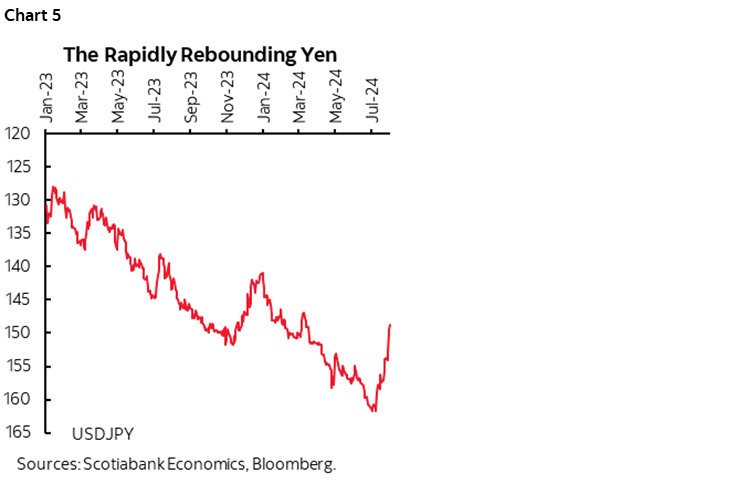
The BoJ’s tightening combined with the Fed providing clear signals that it is moving toward easing are disrupting the carry trade for now, but I’m still not convinced that the BoJ knows what it’s doing and it has a history of zigging when others are zagging. For now, the effects on the yen (chart 5) are hitting the Nikkei hard given its 15$ drop from the all-time high on July 10th that corresponded to the peak weakness in the yen when it was pushing toward 162. The Nikkei is taking out this overshooting of risk appetite that should have never happened in the first place as it was predicated upon the assumption that the yen’s fall would persist and build further.
Geopolitical Risks
We also clearly cannot dismiss geopolitical risk as markets watch rising tensions in the Middle East, and yet far more often than not this is not usually a durable weight against risk appetite.
US Election Volatility
There could also be a repricing of US election effects, assuming markets have the foggiest idea of how to do that. That’s likely to continue for quite a while.
CANADIAN JOBS—TREND WAGE GROWTH IS ACCELERATING
After returning from the long weekend, Canada releases figures for job growth, wage growth and sundry other labour market readings during the month of July on Friday. I maintain that markets did not understand the prior month’s job report that was much better than the flat headline reading suggested (here). At the heart of the matter are the challenges in the youths and temps category, and the counterfactual to the BoC’s odd assertion that wage growth is decelerating.
My guesstimate is 30k for job growth in July on the expectation that the youth category stabilizes and the rest of the job market continues to be resilient. I wouldn’t be surprised to see softer wage gains in month-over-month terms, but I thought that would happen in the prior report and did not and the trend remains quite warm.
Key is the youth category. Youths aged 15–24 saw 24k fewer jobs in June which offset the 23k rise in employment among those aged 25+. The youth category had been up by a similar amount in May and so the two months taken together were flat at the start of the summer job season. Employment in the 25+ category is more important to the housing and consumer markets.
Nevertheless, the youths category is in turmoil. The employment rate for youths is 46.8% which is the lowest in twenty-six years. The youth unemployment rate is up by 3.8 ppts over the past year. Part of the reason for this is the surge of temporary residents comprised of international students, temporary foreign workers and asylum seekers who are competing for jobs in categories traditionally dominated by youths.
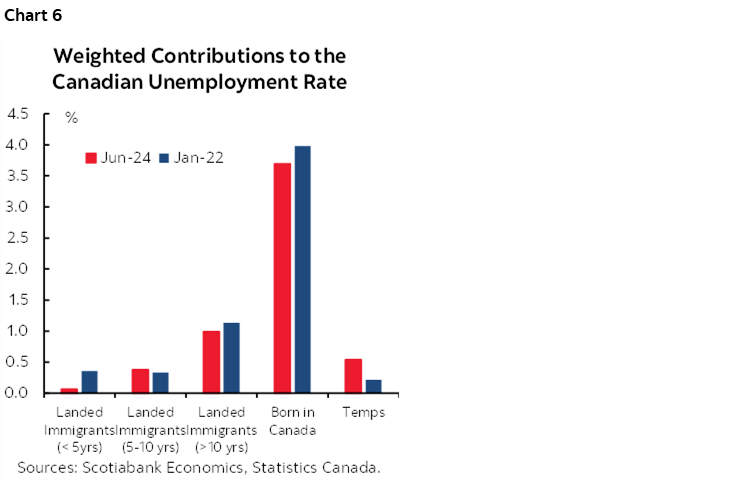
The temps category is experiencing its own challenges. Basically all of the rise in the unemployment rate since the surge of immigration truly began in 2022 has been driven by the temps category (chart 6). This is because immigration remains far too high especially in the non permanent residents category as the federal government drags its feet toward eventual efforts to curtail this category.
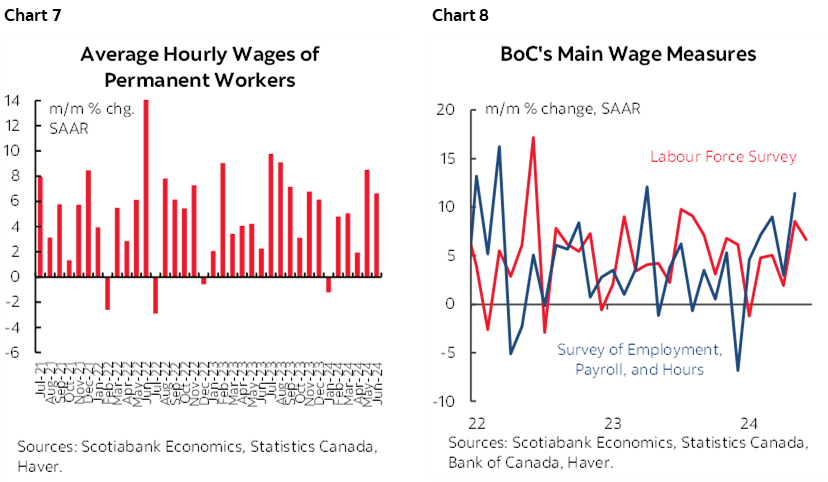
A bigger issue is wage growth. The BoC has asked us to believe that there are some signs it is moderating. No it’s not folks. Not by any meaningful yardstick. Growth in average hourly earnings derived from the Labour Force Survey has accelerated in high frequency m/m terms at a seasonally adjusted and annualized rate (chart 7). In year-over-year terms it has accelerated to 5.6% from 4.8% a couple of months ago. Average weekly earnings derived from the lagging payrolls survey has also accelerated to the fastest pace since early last year (chart 8). Two other wage measures that are available on a lagging quarterly basis are derived from national income accounts (somewhat softer in the past couple of quarters) and productivity accounts (accelerating).
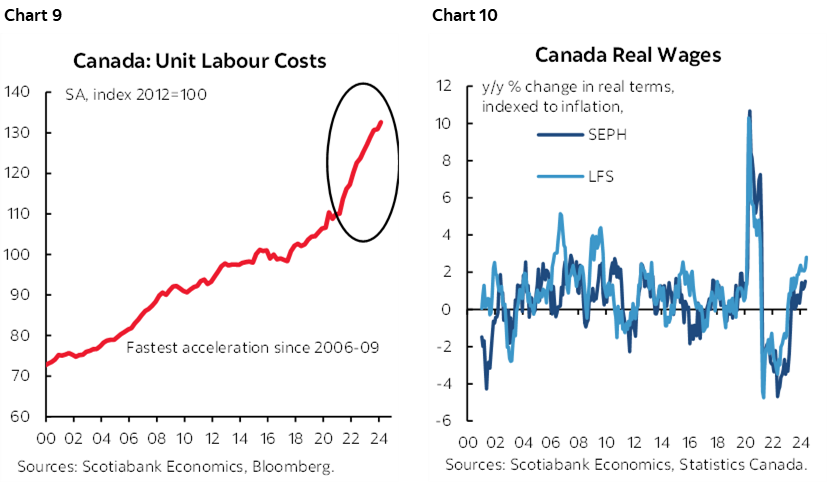
Unit Labour Costs measure productivity-adjusted employment costs continue to soar (chart 9). Further, inflation has eased while nominal wage growth is accelerating according to the suite of measures and this is driving faster real wage growth (chart 10).
Enter the issue of whether this is just a lagging indicator or an indication of things to come. To help inform this, it’s useful to look at the wage settlements coming out of collective bargaining agreements that govern the roughly 30% of the workforce that is unionized in Canada (10% in the US). These contract gains will filter into wage readings over the months and years ahead. They had been soaring in terms of both the first-year wage change and the average wage change over the typical 3–4 year contract period. Their growth rates have eased more recently but remain above the BoC’s 2% inflation target at about 3%+ while productivity continues to tumble.
Shifting gears in a somewhat related point, the debate over the outlook for the Bank of Canada is not some dichotomous contrast between, on the one hand, a camp that says recession looms therefore the BoC should be slashing versus people arguing there should be no cutting. Or at least, that’s not what I’ve been arguing. I’ve argued that easing is appropriate to rebalance the risks from significantly restrictive policy, but that the steps should be pursued carefully. Cutting too fast and too aggressively with very dovish guidance risks resurrecting inflationary forces. The economy is resilient and inflation risk remains elevated, so be careful in crafting monetary policy.
US CPI—A HIGH BAR TO MATTER AT ALL
The first of two US CPI reports before the FOMC’s September 18th decision arrives on Wednesday August 14th. There will be one more reading for the Fed’s preferred PCE measure on August 30th. It would probably take a significant upside surprise—or more likely two—in order to knock the Federal Open Market Committee off course from delivering a cut at that meeting given Chair Powell’s recent guidance (here). The greater risk is if we get two very weak readings.
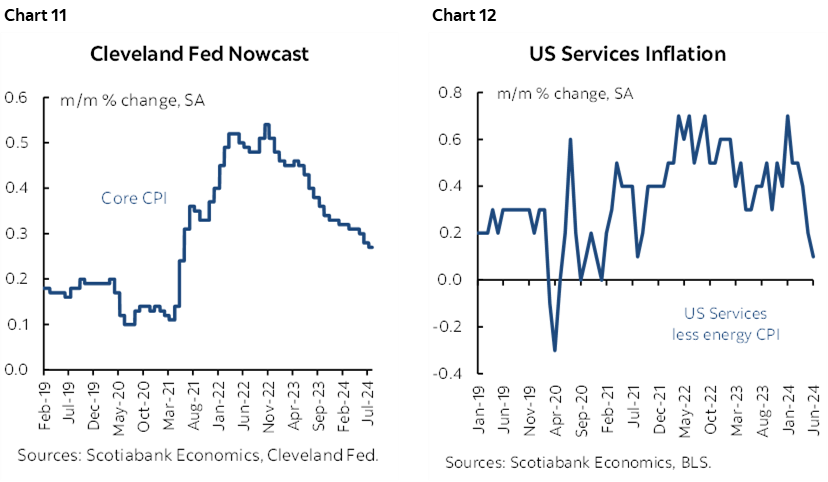
I’ve estimated a mild 0.2% m/m SA rise in headline inflation during July that would be accompanied by a further deceleration to 3.2% y/y from 3.3% the prior month. Core inflation is also projected to be 0.2% m/m SA higher which would drive the year-over-year rate down a tick to 3.2% while once again barring any revisions.
Both estimates are below the Cleveland Fed’s ‘nowcast’ measures that have been tracking too high of late (chart 11). Momentum has come out of core services inflation (chart 12) and housing service influences are expected to continue gradually moderating. Gas prices were little changed and so is tracking of food prices. Industry guidance points to declines over about 1% m/m SA in both new and used vehicle prices.
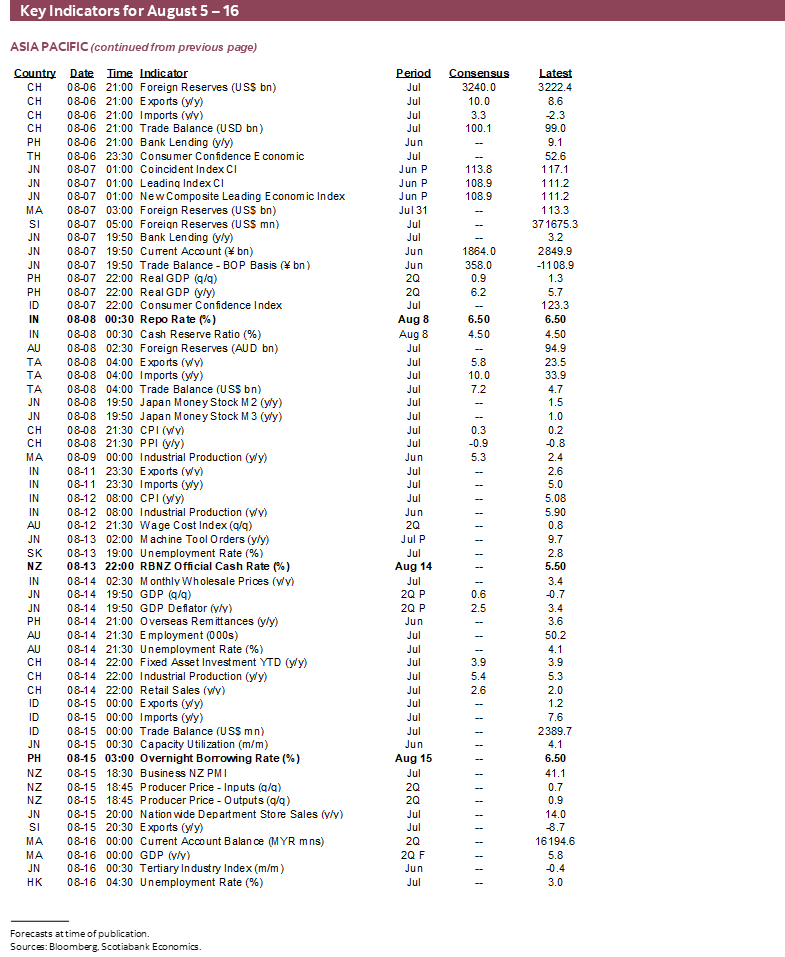
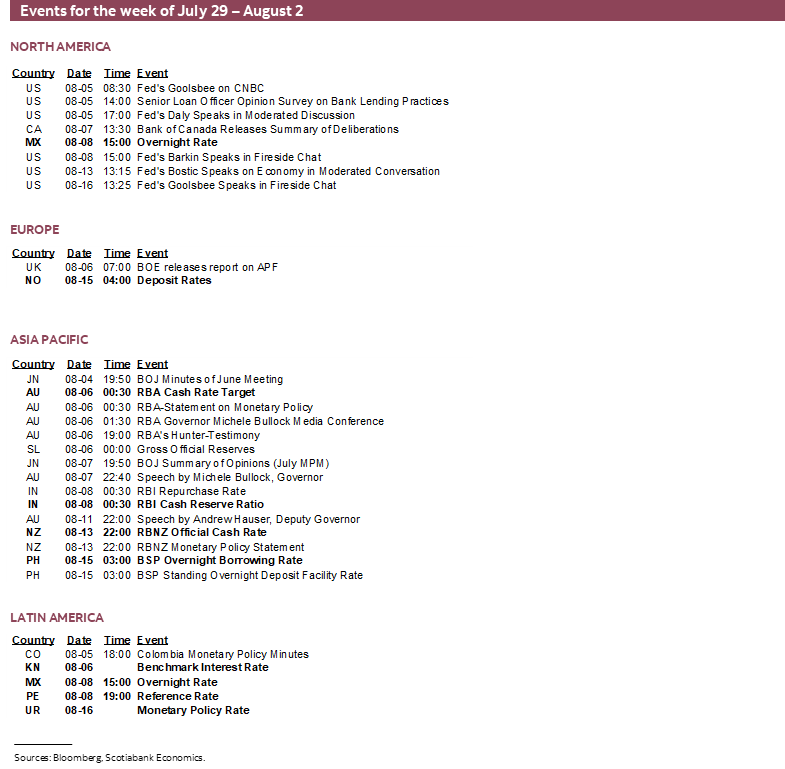
CENTRAL BANKS—HOW FOUR PLUS FOUR COULD EQUAL SEVEN
Four regional central banks will weigh in with decisions during the week of August 5th to 9th followed by four more the following week.
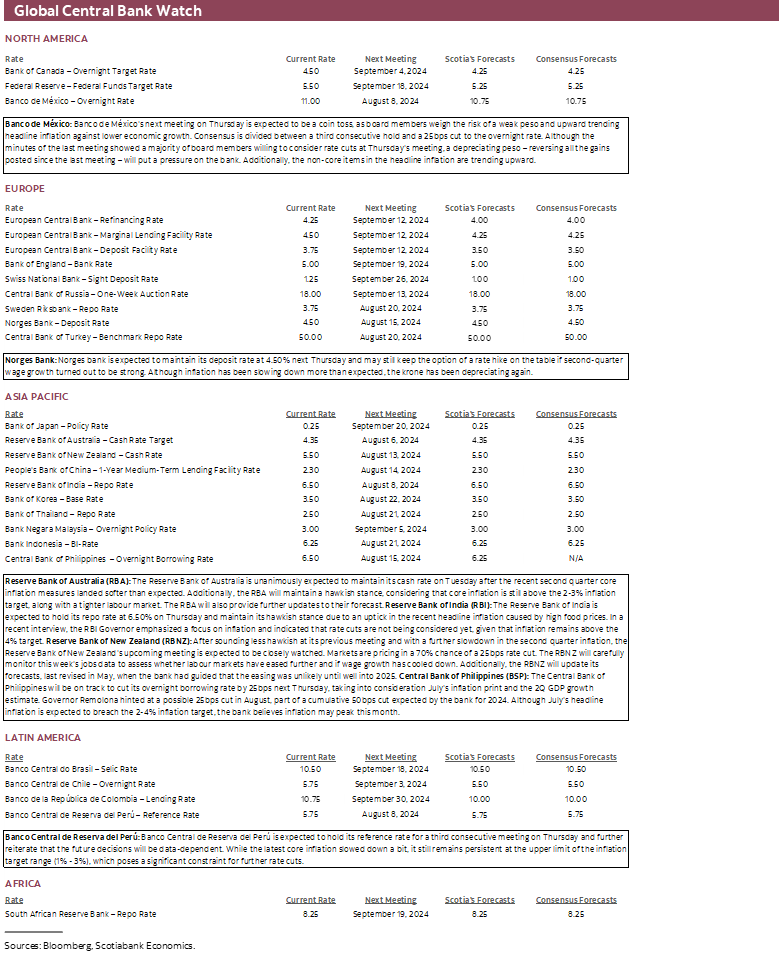
RBA—Hikes on Ice
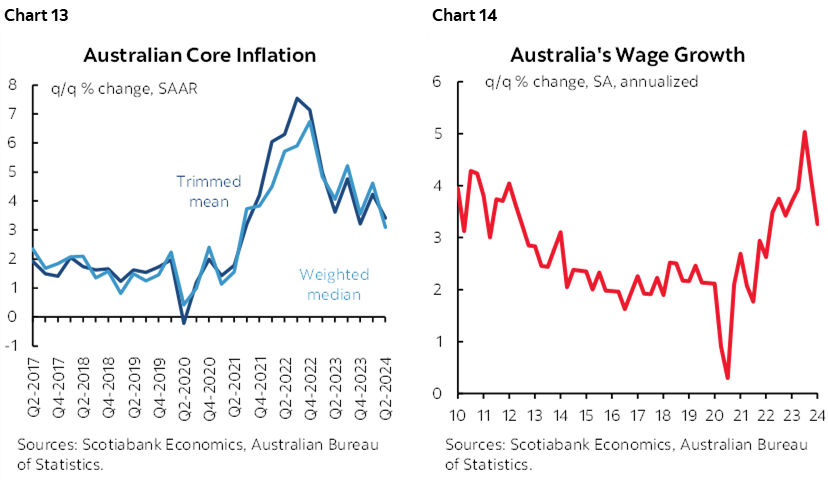
Australia’s central bank is expected to stand pat on Tuesday August 6th. Markets are priced for no change and consensus unanimously expects the cash rate target to stay put at 4.35%. The bias is likely to remain relatively hawkish, but the conditionality placed around the Q2 inflation to inform the risk of further tightening was instead met by a cooler than expected set of core readings (chart 13). Those readings remain above the RBA’s 2–3% headline target range, but the RBA may take comfort in the latest evidence and the deceleration of wage growth to a still solid pace (chart 14). Key may be the RBA’s updated forecast that will help to inform its bias.
RBI—Dovish Pivot?
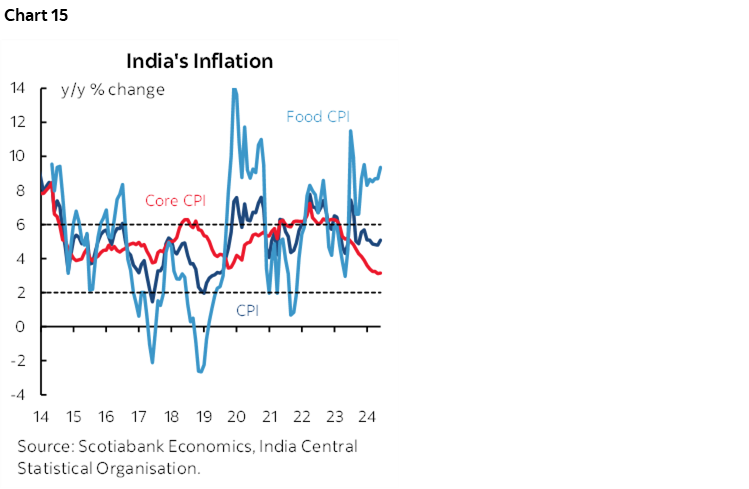
India’s central bank weighs in with its policy decision on Thursday August 8th. No change is expected to the repurchase rate of 6.5% and nothing is priced by markets. Key is whether they remain as hawkish on the bias or shift toward a somewhat more neutral stance. Inflation climbed to over 5% y/y in June, but core inflation ex-food and energy fell to 3.3% y/y (chart 15). With central banks elsewhere turning gradually more dovish including the Federal Reserve, ECB and BoE, India’s central bank may have more comfort to at least sound more circumspect at this meeting.
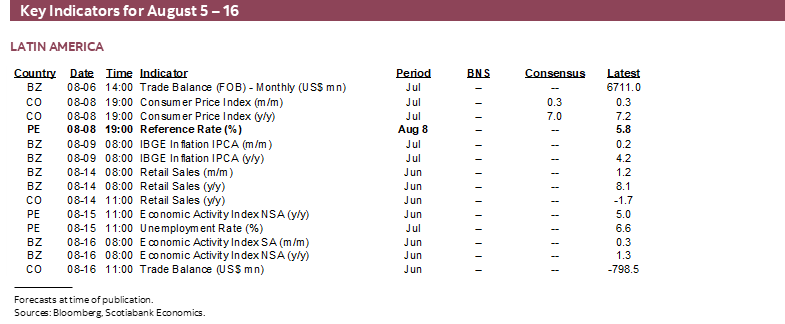
Banxico—Go Now, Or Wait for the Fed?
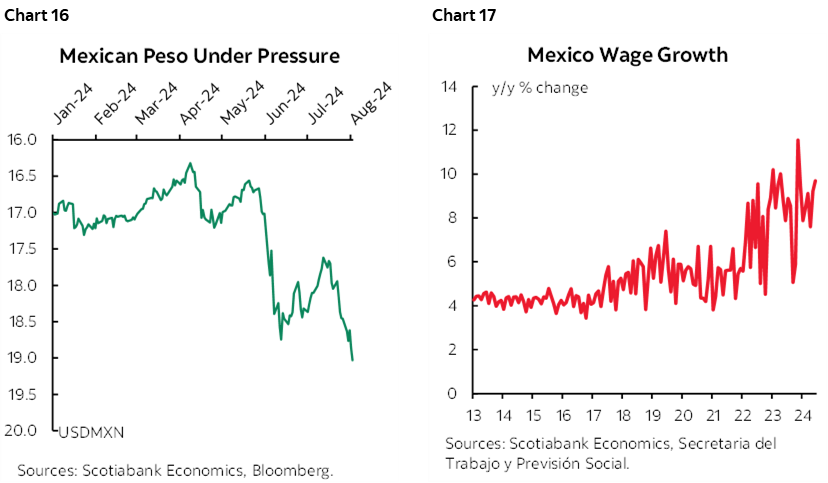
Mexico’s central bank is expected to cut by 25bps on Thursday August 8th according to our Mexico City-based economist Brian Pérez Gutiérrez. Core inflation has continued to ebb after a trio of roughly 0.2% m/m NSA readings drove the year-over-year rate down to 4.1%. Banxico has paused for the more recent two decisions after delivering a single quarter-point cut in March. At 11%, the overnight rate remains well into restrictive territory while the FOMC is turning more dovish. That said, what could well hold back Banxico is the tumbling peso and its potential consequences for imported inflation risk given high import propensities (chart 16), along with persistent wage pressure (chart 17).
BCRP—Earlier Easing Gives Room to Evaluate
Peru’s central bank has held its reference rate unchanged for the past two meetings in June and July. Their next decision on Thursday August 8th and our Lima-based economists expect another hold. Inflation eased in July to 2.1% y/y and lies inside the 1–3% target. Furthermore, the currency Sol has been stronger than MXN and BCRP has been easing more aggressively than Banxico to the tune of 200bps of cuts down to 5.75% to date.
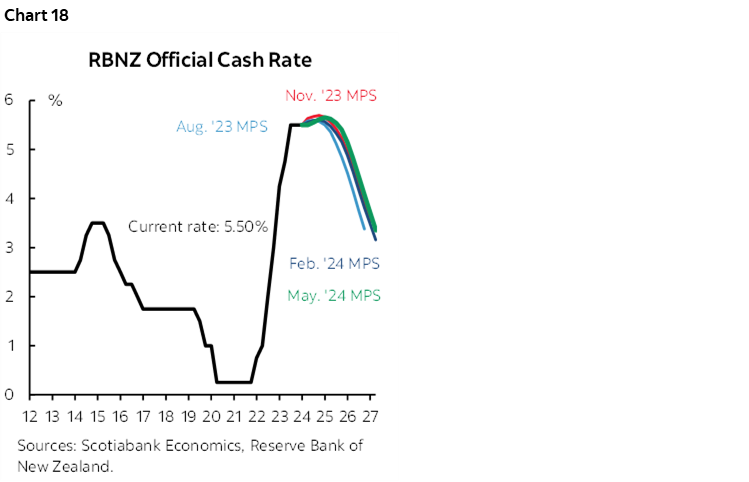
RBNZ—Pulled Forward Cutting
Markets are pricing a solid shot at a rate cut by New Zealand’s central bank on Tuesday August 14th—the second week of this report’s coverage. A more dovish pivot is expected at a minimum. The last statement in July noted that “inflation will return to within its 1–3 percent target range over the second half of 2024.” It went on to note that “there is now more evidence of excess productive capacity emerging” and that growth “has weakened” amid signs that “all point to declining activity.” A full forecast update including refreshed explicit forward policy rate guidance is due at this meeting. It is likely to pull forward the rate cut path that was published at the May meeting (chart 18).
PBOC—Unclear Decision Timing
It’s unclear whether the People’s Bank of China will weigh in with a decision on its 1-yr Medium-Term Lending Facility Rate on Wednesday August 15th as scheduled, or shift the decision toward the 25th of each month as early as this month in accordance with newswire guidance from “people familiar with the matter” at the central bank. Either way, the PBOC is shifting away from reliance on the MTLFR as its main policy rate tool and it may be unusual to expect back-to-back rate cuts from this central bank after reducing key rates in July.
BSP—Might Cut at This Meeting
Here we have a central bank that has been loathe to cut thus far. That could change as soon as this week. Bangko Sentral ng Pilipinas has held its overnight rate at 6.5% since October when it last hiked. The coming decision on Thursday August 16th will be closely monitored for signs of whether a bias shift is in play and whether that will be delivered with a rate cut. Governor Eli Remolona said after the latest CPI report “I think August 15 is still a possibility” in reference to a potential reduction. Key may be the recently more stable peso that has gently appreciated since early July to the USD after falling sharply since March. It may be too soon for such a shift, but an increasingly dovish Fed could give BSP comfort to be more dovish.
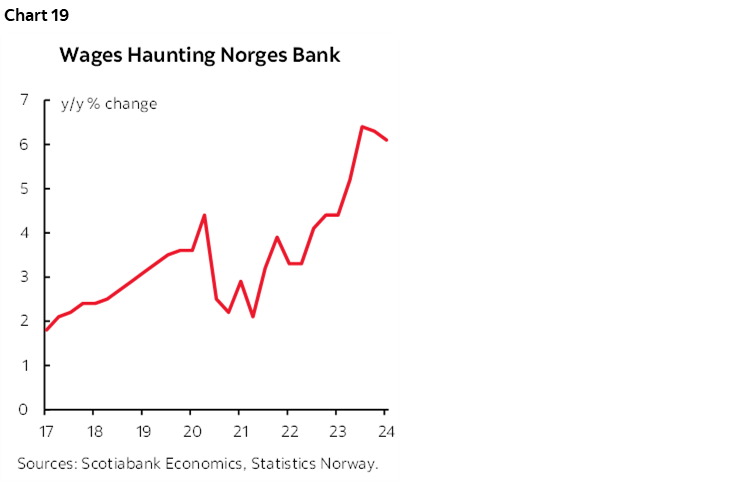
Norges Bank—Wait Until September
Norway’s central bank is expected to hold its deposit rate unchanged at 4.5% on Thursday August 15th. Markets are materially priced for a cut by the December meeting. Underlying inflation has been cut in half to 3.4% y/y. Wage growth remains hot (chart 19) and oil prices have been volatile. Explicit forward guidance in June’s forecasts leaned against a rush to cut with the focus upon whether that may change in the September round.
GLOBAL MACRO—WEEK 1
The rest of the first week of August’s line-up faces little by way of material calendar-based risks.
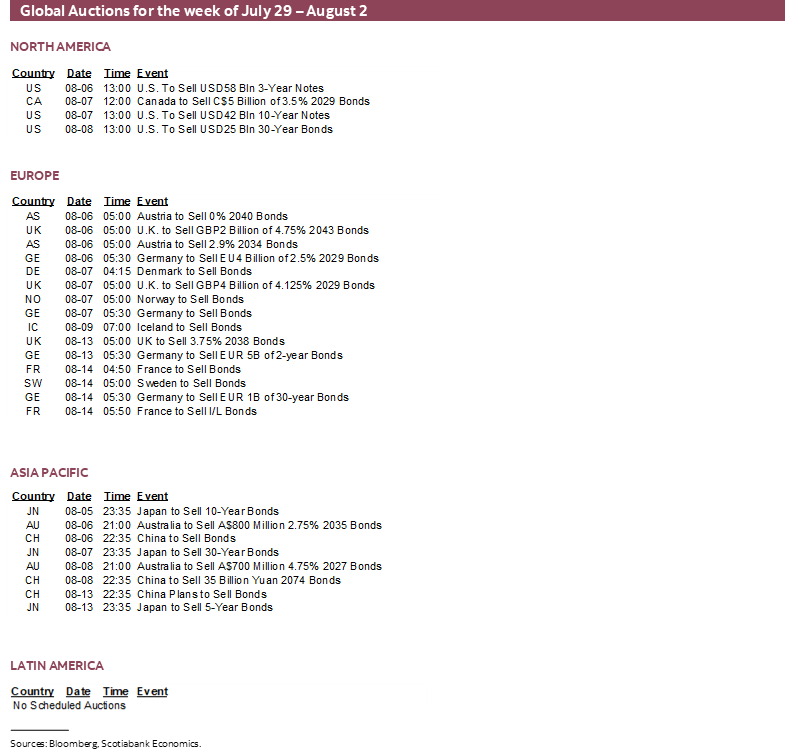
Canada—All About Jobs
Canadian markets face little calendar-based risk other than jobs and wages. Trade figures for June and PMIs for July are due out on Tuesday, the Ivey PMI will be refreshed on Wednesday and the BoC releases its not-minutes re-hash of the last decision (recap here) with its Summary of Deliberations on Wednesday.
US—Services to Rebound?
US calendar-based risks will be very light. ISM-services for July and the Fed’s lender survey (Monday), trade figures for June (Tuesday) and weekly claims (Thursday) are as exciting as it gets until the next week’s CPI. Most expect the services gauge to accelerate which would be more than an offset to weakness in ISM-manufacturing.
CPI Updates Aplenty
Several countries will update CPI inflation readings including the Philippines (Monday), Taiwan (Tuesday), each of Chile, Colombia and Mexico on Thursday, and then Brazil and Norway on Friday. New Zealand refreshes Q3 inflation expectation (Wednesday) the day after updating Q2 employment and wage growth that could inform the RBNZ’s bias into the following week’s decision.
Germany’s Sinking Industrial Base
Germany’s industrial base is reeling and updates for factory orders (Tuesday), exports (Wednesday) and industrial output (Thursday) will all follow steep declines in May after the economy contracted by -0.1% q/q SA nonannualized in Q2.
Building Breadth to Japanese Wage Gains?
Japanese real wages have been falling at a slowing pace of just over -1% y/y from a peak rate of decline of -4.1% in early 2023. June’s update might eke out small further improvement based upon stable national inflation of 2.8% y/y that month and any possible further traction stemming from annual Shunto spring wage negotiations as they filter through a part of the labour force. The reading won’t matter much to BoJ watchers on the heels of the recent rate hike and the announced path toward halving the rate of monthly JGB purchases that probably puts some distance ahead in terms of future potential policy moves.
Q2 GDP figures are expected from Indonesia (Monday), Philippines (Wednesday) and Russia (Friday).
GLOBAL MACRO—WEEK 2
The main focal points during week two of this edition (August 12th – 16th) that were covered so far include US CPI and several central bank decisions. There will be a few other gems in the global line-up.
US—Retail Sales Focus
US macro risk won’t only be about the week’s CPI reading. Retail sales during July (Thursday) could rebound from June’s flat print. Vehicle sales climbed by about 3½% m/m SA and new vehicle prices were down by over 1% m/m SA with the figures netting out to a weighted contribution to growth in nominal retail sales probably on the order of about 0.3% m/m. Gas prices were a relatively neutral influence. Key will nevertheless be sales ex-autos and gas and the retail sales control group that feeds more directly into consumption estimates within GDP accounts.
Other readings will extend the week’s US inflation watch with producer prices expected to be up mildly for headline and core (Tuesday). Industrial output (Thursday) and the Empire gauge’s kick-off toward another ISM-manufacturing reading (Thursday) are also due out. One thing to note is that ISM-manufacturing’s production gauge is not aligning well with hard data on manufacturing production. UofM sentiment and housing starts (both Friday) round it all out.
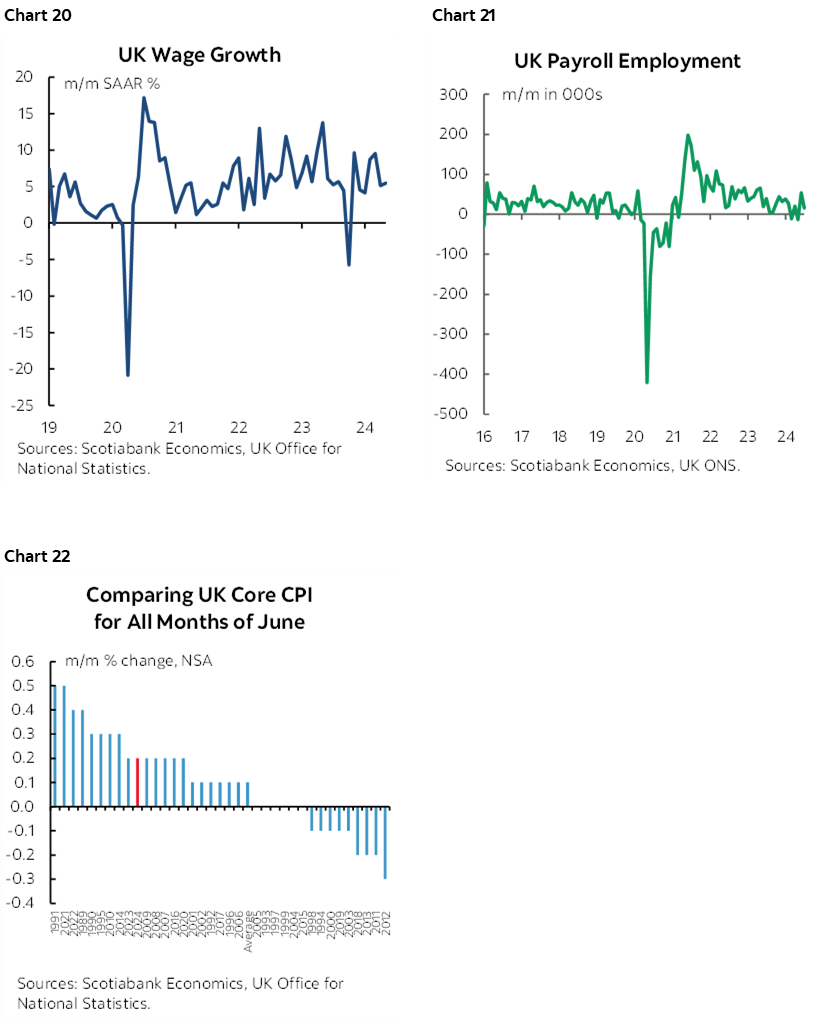
UK—Jobs, Wages and CPI to Inform the Path to the Next BoE Decision
This will be a big week for the UK. After delivering its first cut of the cycle in a close 5–4 vote to ease, the Bank of England faces an onslaught of readings that will help to inform the path to its next decision on September 19th. Tuesday’s readings on jobs and wages come in the context of strong trend wage growth (chart 20) and very volatile jobs (chart 21). Core inflation has been persistently stronger than usual in seasonally unadjusted m/m terms compared to like months in history such as chart 22. A continuation of such persistence could work against confidence to deliver another cut next month. There will also be updates for industrial production, services growth, retail sales and trade later in the week.
Canada—Home Sales Momentum?
Canadian markets will largely go dormant during week two of this publication. Existing home sales for July (Thursday) will seek to build upon the almost 4% m/m SA gain in June. Sales have been seesawing since December’s massive gain of almost 9% m/m SA and then January’s 3.7% gain pulled forward momentum from February through May. Manufacturing shipments are expected to post a drop of about 2½% m/m in June (Friday) based on Statcan ‘flash’ guidance.
LatAm—Growth in Colombia, Peru
LatAm markets go quiet with just Colombian Q2 GDP that is likely to accelerate in year-over-year terms, Peru’s monthly GDP gauge for June (Thursday), plus Argentina’s latest gazillion percentage point increase in CPI that at last count stood at 272% y/y (Wednesday). Not a typo.
Australia—Jobs and Wages Keeping Up Momentum
RBA watchers will shift their focus back toward the state of the job market with Q2 wages (Monday) and July’s job growth (Wednesday).
China—Slipping Consumers?
China’s readings for July (Wednesday) will help us to understand more about not only Q3 GDP tracking but also whether the consumer sector is more rapidly deteriorating. Retail sales had slipped a touch in June over May to set up a weak entry into June. An offset was industrial production that accelerated. If China hasn’t already released credit figures, then they are sure to be out by Friday or sooner.
Japan—A Vindicated BoJ?
Japan’s economy shrank by -0.7% q/q SA nonannualized in Q1 and yet the BoJ still tightened monetary policy through a rate hike and sharp curtailment of bond purchases at its recent meeting. They might be vindicated if growth rebounds in Q2 which is what economists generally expect to happen on Wednesday. Nevertheless, softening core inflation in m/m terms, little evidence that Shunto wage gains are filtering through the economy, and sharp yen appreciation lend caution to future moves.
DISCLAIMER
This report has been prepared by Scotiabank Economics as a resource for the clients of Scotiabank. Opinions, estimates and projections contained herein are our own as of the date hereof and are subject to change without notice. The information and opinions contained herein have been compiled or arrived at from sources believed reliable but no representation or warranty, express or implied, is made as to their accuracy or completeness. Neither Scotiabank nor any of its officers, directors, partners, employees or affiliates accepts any liability whatsoever for any direct or consequential loss arising from any use of this report or its contents.
These reports are provided to you for informational purposes only. This report is not, and is not constructed as, an offer to sell or solicitation of any offer to buy any financial instrument, nor shall this report be construed as an opinion as to whether you should enter into any swap or trading strategy involving a swap or any other transaction. The information contained in this report is not intended to be, and does not constitute, a recommendation of a swap or trading strategy involving a swap within the meaning of U.S. Commodity Futures Trading Commission Regulation 23.434 and Appendix A thereto. This material is not intended to be individually tailored to your needs or characteristics and should not be viewed as a “call to action” or suggestion that you enter into a swap or trading strategy involving a swap or any other transaction. Scotiabank may engage in transactions in a manner inconsistent with the views discussed this report and may have positions, or be in the process of acquiring or disposing of positions, referred to in this report.
Scotiabank, its affiliates and any of their respective officers, directors and employees may from time to time take positions in currencies, act as managers, co-managers or underwriters of a public offering or act as principals or agents, deal in, own or act as market makers or advisors, brokers or commercial and/or investment bankers in relation to securities or related derivatives. As a result of these actions, Scotiabank may receive remuneration. All Scotiabank products and services are subject to the terms of applicable agreements and local regulations. Officers, directors and employees of Scotiabank and its affiliates may serve as directors of corporations.
Any securities discussed in this report may not be suitable for all investors. Scotiabank recommends that investors independently evaluate any issuer and security discussed in this report, and consult with any advisors they deem necessary prior to making any investment.
This report and all information, opinions and conclusions contained in it are protected by copyright. This information may not be reproduced without the prior express written consent of Scotiabank.
™ Trademark of The Bank of Nova Scotia. Used under license, where applicable.
Scotiabank, together with “Global Banking and Markets”, is a marketing name for the global corporate and investment banking and capital markets businesses of The Bank of Nova Scotia and certain of its affiliates in the countries where they operate, including; Scotiabank Europe plc; Scotiabank (Ireland) Designated Activity Company; Scotiabank Inverlat S.A., Institución de Banca Múltiple, Grupo Financiero Scotiabank Inverlat, Scotia Inverlat Casa de Bolsa, S.A. de C.V., Grupo Financiero Scotiabank Inverlat, Scotia Inverlat Derivados S.A. de C.V. – all members of the Scotiabank group and authorized users of the Scotiabank mark. The Bank of Nova Scotia is incorporated in Canada with limited liability and is authorised and regulated by the Office of the Superintendent of Financial Institutions Canada. The Bank of Nova Scotia is authorized by the UK Prudential Regulation Authority and is subject to regulation by the UK Financial Conduct Authority and limited regulation by the UK Prudential Regulation Authority. Details about the extent of The Bank of Nova Scotia's regulation by the UK Prudential Regulation Authority are available from us on request. Scotiabank Europe plc is authorized by the UK Prudential Regulation Authority and regulated by the UK Financial Conduct Authority and the UK Prudential Regulation Authority.
Scotiabank Inverlat, S.A., Scotia Inverlat Casa de Bolsa, S.A. de C.V, Grupo Financiero Scotiabank Inverlat, and Scotia Inverlat Derivados, S.A. de C.V., are each authorized and regulated by the Mexican financial authorities.
Not all products and services are offered in all jurisdictions. Services described are available in jurisdictions where permitted by law.