Next Week's Risk Dashboard
- BoC to cut 25bps, defer to later forecast update
- Several perils to BoC upsizing…
- …include whether Canadian households are amassing pent-up demand via excess savings
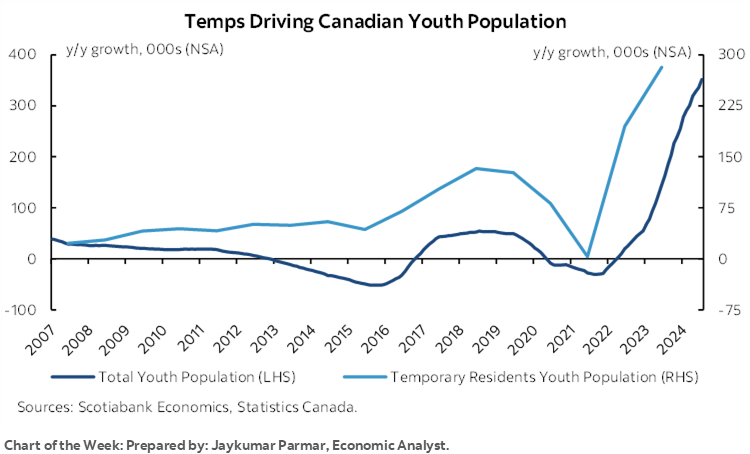
- Canadian jobs face a youth and temps problem…
- … as real wage growth accelerates
- US nonfarm payrolls could be soft again
- Will BCCh resume cuts?
- Bank Negara will probably hold…
- …but currency pivots may test multiple Asian central banks
- Global macro
- US and Canadian markets shut Monday
Chart of the Week
After US and Canadian market participants return from Labour Day holidays, they will quickly swing into higher gear ahead of significant macro risk. Keys will be the Bank of Canada’s latest decisions, dual jobs reports from both countries, decisions by the central banks of Chile and Malaysia, and a wave of global macro reports.
BANK OF CANADA— -25BPS, STABLE QT, SEE YA IN OCTOBER
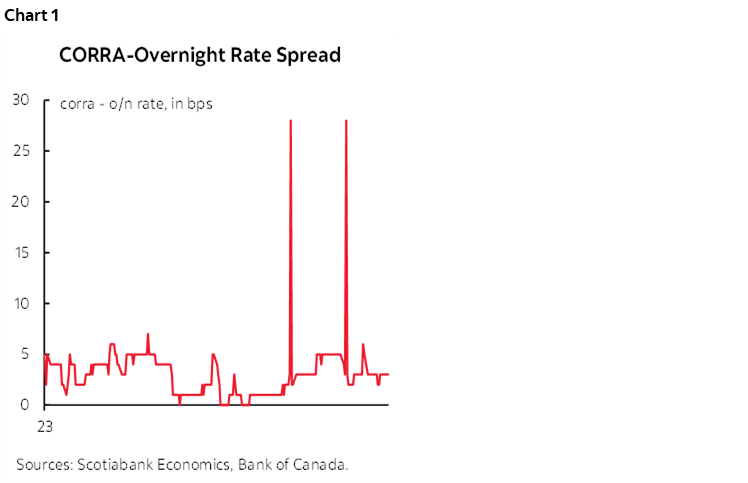
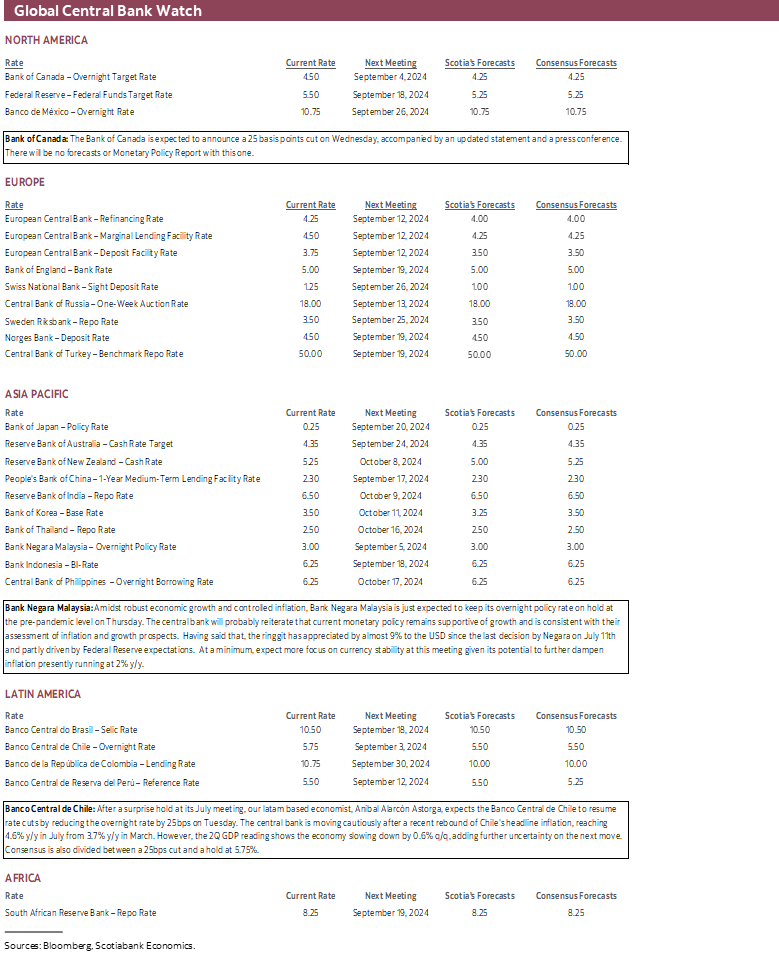
The Bank of Canada is expected to cut its overnight rate by another 25bps on Wednesday. The statement arrives at 9:45amET and will be followed by a press conference 45 minutes later. There will not be an MPR or forecast update with this one; the next forecasts will be offered at the October 23rd decision. No changes to quantitative tightening are expected; the BoC likely remains of the view that settlement balances are still too high and that the persistent CORRA spread over the policy rate is driven by factors other than QT (chart 1).
A quarter-point rate cut is widely expected and more than fully priced. So is another quarter point cut at the October meeting and then markets are pricing a further such move at the December meeting. If delivered, this would take cumulative easing to -125bps from a 5% policy rate peak to 3.75% by year-end.
Risks to this straight-line trajectory include the course of data and market developments, possibly the contents of the Federal government’s Fall fiscal update some time in November or December that may include election year goodies, plus US election aftermath. To paraphrase former Governor Poloz when he skipped between two cuts in early 2015, policy adjustments do not have to go in a straight-line and there is merit to keeping some powder dry.
The Canadian rates curve is generously priced for rate cuts and/or does not presently believe in applying term premia. OIS markets have the policy rate falling to 3% by next summer. The five-year Canada bond yield is priced at about 3% which is 15bps above the undershooting low in early August and in the ballpark of the lower end of the BoC’s estimated neutral rate range plus very little term premia. A recession with or without financial market dysfunction would drive a lower yield, but neither are in our forecasts.
In short, the Canadian rates curve is significantly priced for perfection in the delivery of aggressive rate cuts. What could add to this pricing would be bigger and sooner cuts compared to the 25bps per meeting pace that is roughly priced.
And yet, the case against up-sizing cuts such as delivering a half point or bigger move along the way includes the following points:
- Up-sizing cuts could send a negative signalling effect by way of saying to Canadians and markets that the BoC sees something it’s really worried about in order to merit picking up the pace.
- Up-sizing is an option the BoC should preserve for potentially more exigent circumstances.
- With markets already aggressively priced for easing, up-sizing even just once would have markets price another up-sized move and perhaps more. The BoC may not be comfortable with being pushed into this position by markets while presenting the risk of having to disappoint markets at some point. This should matter to Governing Council, though it tends to be aloof toward markets.
- The BoC’s forward guidance has said the path down wouldn’t be the same as the path upward. This means that the big hikes wouldn’t be followed by out-sized cuts and hence the paths up and down would not be symmetrical to one another. The BoC’s forward guidance has performed poorly over the years and violating current guidance would do nothing to improving guidance.
- Up-sizing cuts could be treated as a case to raise inflation forecasts over 2025–26 and potentially introduce erratic monetary policy.
- The last point involves repeating my take on recent GDP growth and the uncertainties going forward as argued here. The private economy is recently quite weak as Q2 GDP growth was largely only driven by government giving its workers retroactive wage increases. The BoC may wish to hold off against up-sizing until it can observe what happens as this effect on growth drops out and in the context of uncertainty toward whether horded savings get redeployed by consumers. See the charts in that GDP write-up that explain this hording phenomenon.
In my opinion, the BoC is not out of the woods when it comes to inflation risk and should proceed very carefully without overreacting to a handful of months of data. Immigration remains wildly excessive. Housing shortfalls that existed before the pandemic have grown more acute and are likely to remain that way throughout the decade and possibly beyond. Real wage growth is accelerating while productivity continues to tank. Fiscal policy is still adding to GDP growth and it’s reasonable to think there will be more stimulus applied into an election year given the Federal government’s poor polling. The potential combination of monetary and fiscal easing feeding off one another may well reignite inflation risk. It’s also very premature to conclude that serial supply chain shocks are over in light of geopolitical tensions, soaring shipping costs due to Red Sea tensions, and labour strife in Canada and the US.
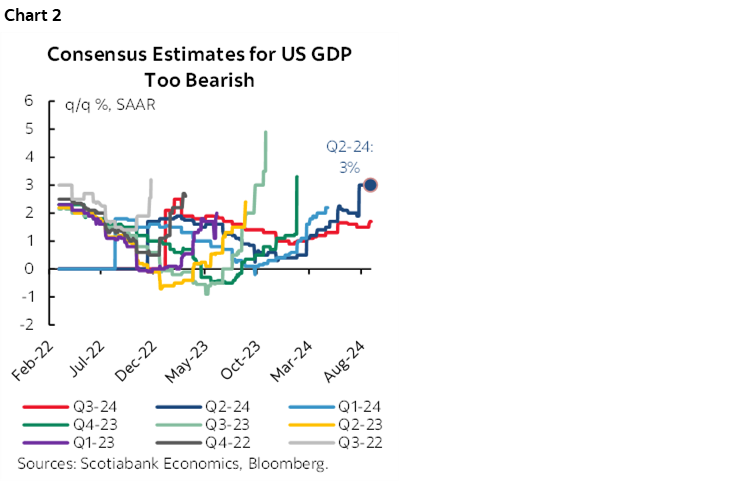
It's also not clear that the Federal Reserve will consistently have the BoC’s back into 2025. The US economy remains remarkably resilient in yet another quarter marked by consensus chasing strong growth higher after Q2 was revised up to 3% q/q SAAR (chart 2). I’ve tended to argue that seasonal adjustment factors are complicating the interpretation of recent inflation and jobs data. And the US election presents deeply uncertain effects on the outlook.
US NONFARM—MORE SEASONAL FACTOR DISTORTIONS?
Will nonfarm payrolls turn in another relatively soft performance? We’ll find out on Friday when August figures are released. I’ve gone with a gain in nonfarm payrolls of about 140k.
The unemployment rate is expected to tick down to 4.2% as employment in the companion household survey exceeds an expected softening in the prior month’s surge in the size of the labour force.
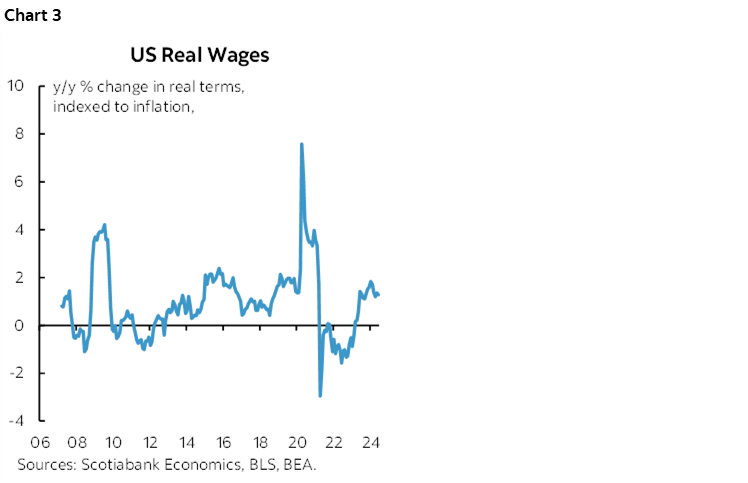
Wage growth is estimated at 0.3% m/m SA, or 3.7% y/y. Real wage growth has been accelerating as inflation has been falling faster than nominal wage growth (chart 3).
Additional labour market readings that may further inform expectations for payrolls will unfold before Friday, including the JOLTS measure of vacancies in July (Wednesday), Challenger job cuts in August and ADP private payrolls in August (Thursday).
This is probably going to be another month in which the seasonal adjustment factors over-correct for hiring in August relative to prior months of August. That was the case last year and four of the weakest months for August SA factors have been since the pandemic struck in 2020 while all six of the weakest months have been since 2018 (chart 4).
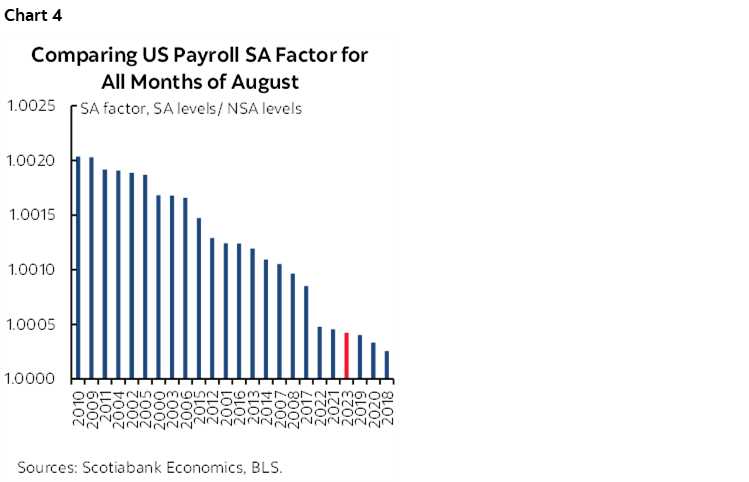
The catch is that September starts to swing in the opposite direction as SA factors during the pandemic era are generally among the strongest over past months of September. In fact, all months from September to December have tended to have relatively higher SA factors than prior like months in history. In short, payrolls could get a distorted boost from SA factors starting with September’s numbers in October.
For more about how US job readings appear to be plagued by ongoing seasonal adjustment problems last year and this year, please see this and this. In addition, this note explains why the Fed shouldn’t take the nonfarm revisions too seriously.
CANADIAN JOBS—NO SEASONAL EXCUSES HERE, BUT YOUTHS FACING CHALLENGES
Canada also updates labour market readings for August on Friday at the same time as the US numbers. That often complicates the market effects as Canadian markets interpret both sets of numbers together. I’ve guesstimated a gain of 30k jobs and a slight up-tick in the unemployment rate on the expectation that growth in the labour force rebounds from the first contraction in the size of the labour force in July since September 2022 and driven by an ongoing surge of immigration.
Since the figures arrive after Wednesday’s BoC decision they will play a role in shaping the potential policy bias into the October decision along with a wave of other releases between now and then. Governor Macklem will, however, have another opportunity to address the state of the labour market and the most recent figures when he speaks the following week on Tuesday September 10th in London. His main topic is supposed to be global trade and investment.
Canadian job growth has flat lined over the past two months, and yet much of this has been due to weakness in part-time jobs as full-time employment was powerfully higher by 62k in July. This conversion from p-t to f-t employment alongside broader workforce changes drove a strong 1% m/m jump in hours worked in July after a 2¼% q/q SAAR gain in Q2. Employers pumped hours worked over the body count.
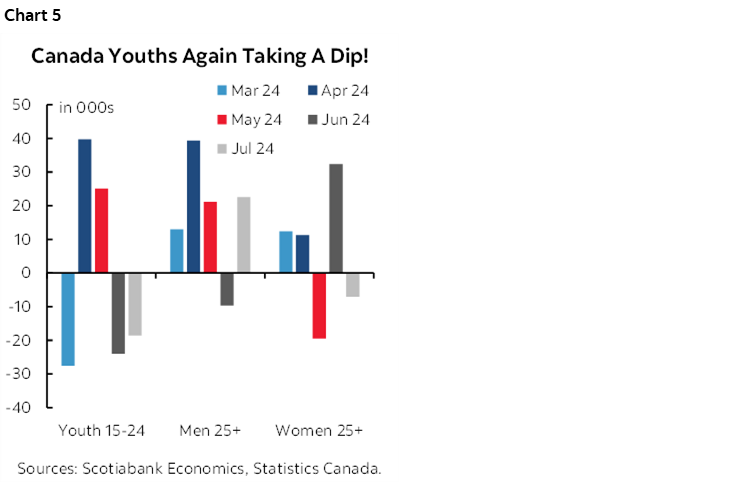
Much of the weakness in total job creation over the past two months has also been due to the youth category, aged 15–24 (chart 5). They saw 24k fewer jobs in June and then another drop of 19k in July for a total of about 43k fewer jobs. This could reflect a combination of a soft summer job market and/or the role that excessive numbers of non permanent residents—including temporary foreign workers— have had on the ability of youths to secure employment. If so, then that’s likely a temporary consideration in light of the federal government’s plans to curtail the number of non permanent residents.
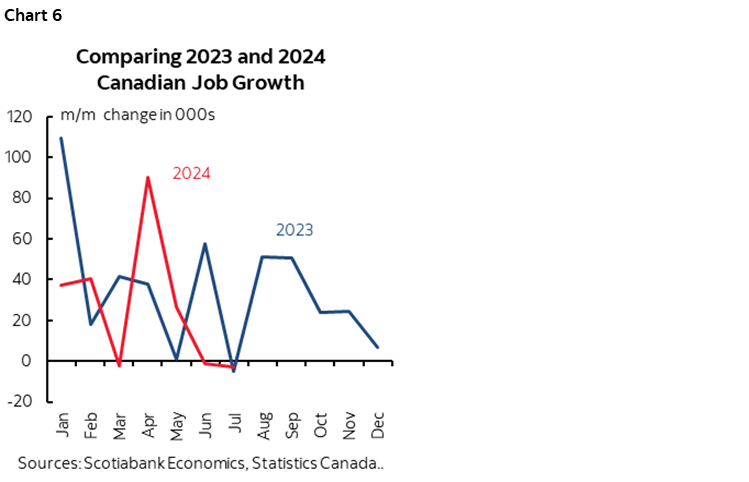
Canada does not appear to have the same potential issues with seasonal adjustment factors as the US where nonfarm payrolls and the household survey’s measure of US jobs exhibit the seasonal patterns observed during the past couple of years as described in the previous section. In fact, it may be the opposite.
- First, there is no pattern in Canada—unlike the US—of stronger employment gains toward the start of the year that wane toward mid-year (chart 6).
- Second, the SA factors that have applied to June and July this year have tamped down seasonally unadjusted employment by less than in any other prior like months of June and July on record (charts 7–8). Since June and July typically involve SA factors of less than 1.0 and this year’s June and July SA factors were closer to 1.0 than ever, this meant that SA jobs were relatively higher as a share of seasonally unadjusted jobs than prior like months.
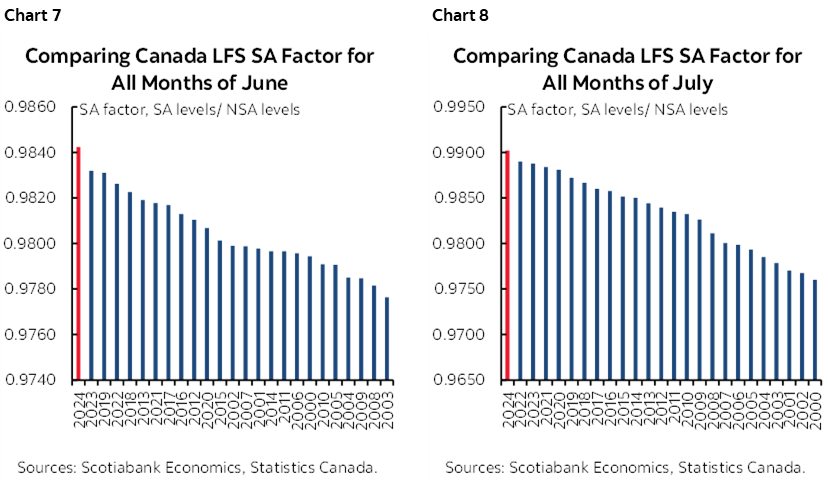
In other words, employment levels might have been weaker yet had this year’s seasonal adjustment factors not been so out of kilter with prior years.
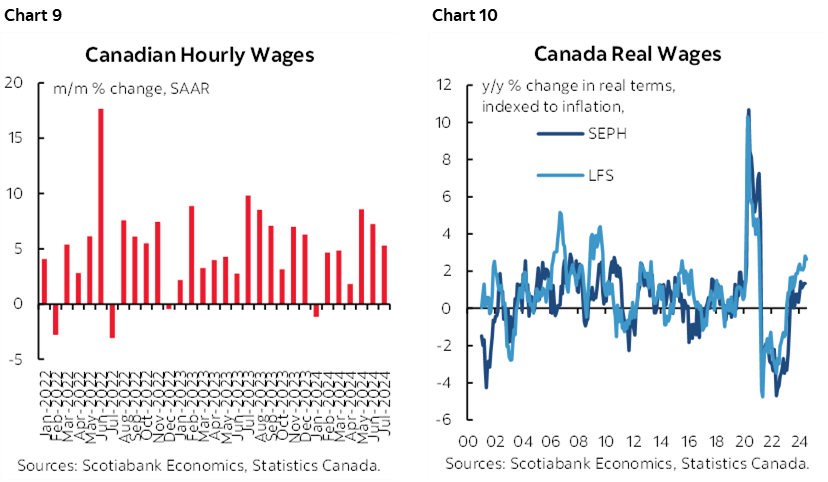
Key is nevertheless wages. Nominal wage growth definitely remains strong (chart 9) and in excess of inflation which means that real wage growth (ie: adjusted for inflation) has been accelerating (chart 10). When productivity figures for Q2 are released on Thursday they are likely to show that output per hour worked was little changed if not lower in which case strong real wage gains alongside tumbling productivity reinforce one another in making it more difficult to contain inflation.
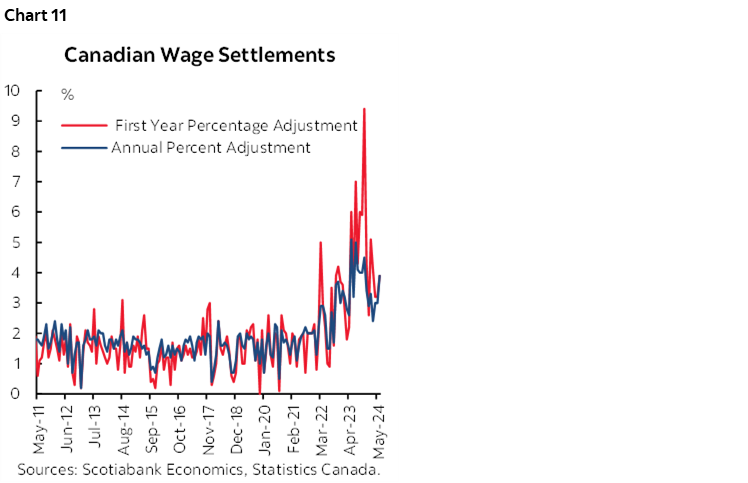
As opposed to viewing this pace of wage growth as a lagging indicator, it’s important to note that wage gains above the BoC’s targeted 2% rate of inflation continue to be registered in collective bargaining agreements that will be influencing future wage growth for a long while yet. First-year wage adjustments in contracts being signed remain trending about 3% and average wage adjustments over the 3–4 year average contract periods are also above 3% (chart 11). 30% of Canada’s workforce is unionized and with many workers on expiring contracts that keep labour strife a reality.
As for the effects of unfolding changes to immigration policy, I won’t repeat what can be referenced in this recent morning note.
OTHER CENTRAL BANKS
Two more regional central banks will deliver policy decisions this week.
Banco Central de Chile—Cutting to Resume?
After a surprise hold at its July meeting, our LatAm based economist, Anibal Alarcón Astorga, expects Banco Central de Chile to resume rate cuts by reducing the overnight rate by 25bps on Tuesday. Consensus is divided between a 25bps cut and a hold at 5.75%.
The central bank is moving cautiously after a recent rebound of Chile's headline inflation, reaching 4.6% y/y in July from 3.7% y/y in March. However, the 2Q GDP reading show the economy slowing down by 0.6% q/q, adding further uncertainty on the next move.
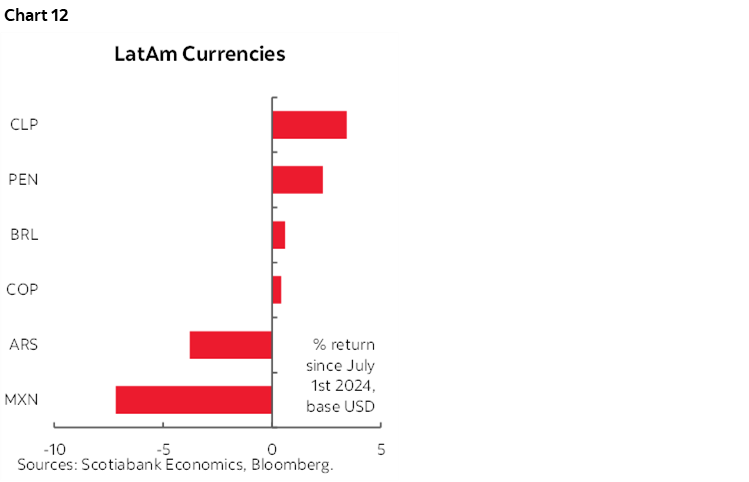
Currency developments could help tip the balance toward a cut since CLP has appreciated by about 3½% to the USD since the DXY began depreciating in early July. PEN in neighbouring Peru has experienced something similar, while MXN and everybody’s favourite ARS have gone the other direction (chart 12).
Bank Negara Malaysia—Ringg Ringg
Amidst robust economic growth and controlled inflation, Bank Negara Malaysia is expected to keep its overnight policy rate on hold at the pre-pandemic level on Thursday.
The central bank will probably reiterate that current monetary policy remains supportive of growth and is consistent with their assessment of inflation and growth prospects.
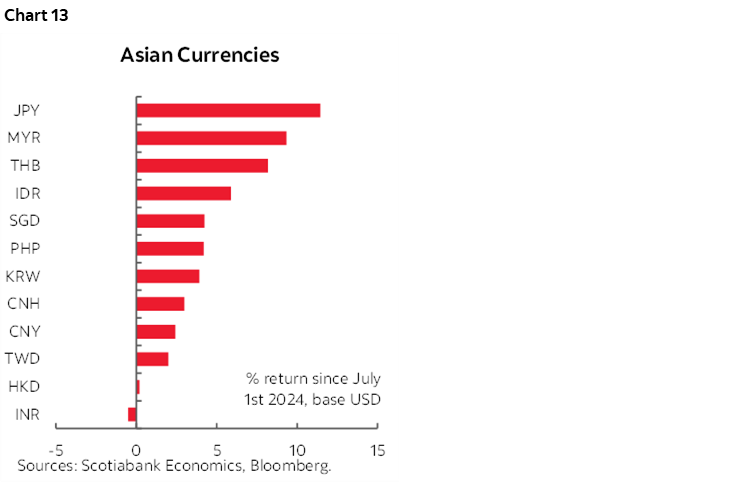
Having said that, the ringgit has appreciated by almost 9% to the USD since the last decision by Negara on July 11th and is being partly driven by Federal Reserve expectations. At a minimum, expect more focus on currency stability at this meeting given its potential to further dampen inflation presently running at 2% y/y. The same applies to numerous Asian central banks that have witnessed material currency appreciation to the USD since the DXY began to depreciate in early July (chart 13).
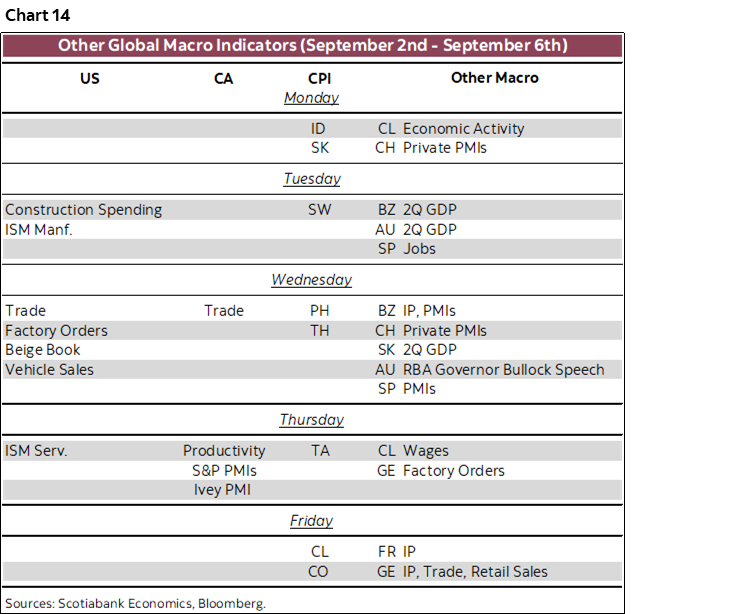
OTHER GLOBAL MACRO
A wave of other macro reports will be released this week. I’ll write about them as they come up in daily notes.
Please see chart 14 for a table that summarizes them in addition to indicator, auction and central bank tables in the rest of this report.

DISCLAIMER
This report has been prepared by Scotiabank Economics as a resource for the clients of Scotiabank. Opinions, estimates and projections contained herein are our own as of the date hereof and are subject to change without notice. The information and opinions contained herein have been compiled or arrived at from sources believed reliable but no representation or warranty, express or implied, is made as to their accuracy or completeness. Neither Scotiabank nor any of its officers, directors, partners, employees or affiliates accepts any liability whatsoever for any direct or consequential loss arising from any use of this report or its contents.
These reports are provided to you for informational purposes only. This report is not, and is not constructed as, an offer to sell or solicitation of any offer to buy any financial instrument, nor shall this report be construed as an opinion as to whether you should enter into any swap or trading strategy involving a swap or any other transaction. The information contained in this report is not intended to be, and does not constitute, a recommendation of a swap or trading strategy involving a swap within the meaning of U.S. Commodity Futures Trading Commission Regulation 23.434 and Appendix A thereto. This material is not intended to be individually tailored to your needs or characteristics and should not be viewed as a “call to action” or suggestion that you enter into a swap or trading strategy involving a swap or any other transaction. Scotiabank may engage in transactions in a manner inconsistent with the views discussed this report and may have positions, or be in the process of acquiring or disposing of positions, referred to in this report.
Scotiabank, its affiliates and any of their respective officers, directors and employees may from time to time take positions in currencies, act as managers, co-managers or underwriters of a public offering or act as principals or agents, deal in, own or act as market makers or advisors, brokers or commercial and/or investment bankers in relation to securities or related derivatives. As a result of these actions, Scotiabank may receive remuneration. All Scotiabank products and services are subject to the terms of applicable agreements and local regulations. Officers, directors and employees of Scotiabank and its affiliates may serve as directors of corporations.
Any securities discussed in this report may not be suitable for all investors. Scotiabank recommends that investors independently evaluate any issuer and security discussed in this report, and consult with any advisors they deem necessary prior to making any investment.
This report and all information, opinions and conclusions contained in it are protected by copyright. This information may not be reproduced without the prior express written consent of Scotiabank.
™ Trademark of The Bank of Nova Scotia. Used under license, where applicable.
Scotiabank, together with “Global Banking and Markets”, is a marketing name for the global corporate and investment banking and capital markets businesses of The Bank of Nova Scotia and certain of its affiliates in the countries where they operate, including; Scotiabank Europe plc; Scotiabank (Ireland) Designated Activity Company; Scotiabank Inverlat S.A., Institución de Banca Múltiple, Grupo Financiero Scotiabank Inverlat, Scotia Inverlat Casa de Bolsa, S.A. de C.V., Grupo Financiero Scotiabank Inverlat, Scotia Inverlat Derivados S.A. de C.V. – all members of the Scotiabank group and authorized users of the Scotiabank mark. The Bank of Nova Scotia is incorporated in Canada with limited liability and is authorised and regulated by the Office of the Superintendent of Financial Institutions Canada. The Bank of Nova Scotia is authorized by the UK Prudential Regulation Authority and is subject to regulation by the UK Financial Conduct Authority and limited regulation by the UK Prudential Regulation Authority. Details about the extent of The Bank of Nova Scotia's regulation by the UK Prudential Regulation Authority are available from us on request. Scotiabank Europe plc is authorized by the UK Prudential Regulation Authority and regulated by the UK Financial Conduct Authority and the UK Prudential Regulation Authority.
Scotiabank Inverlat, S.A., Scotia Inverlat Casa de Bolsa, S.A. de C.V, Grupo Financiero Scotiabank Inverlat, and Scotia Inverlat Derivados, S.A. de C.V., are each authorized and regulated by the Mexican financial authorities.
Not all products and services are offered in all jurisdictions. Services described are available in jurisdictions where permitted by law.