Next Week's Risk Dashboard
- BoC expected to cut again despite rising inflation risk
- Why the BoC won’t change QT
- Canada’s front-end is cheap to the US
- US Q2 GDP to inform the slowing debate
- US PCE inflation may be very soft…
- …and this time it might stick
- PMIs: EZ, UK, US, Japan, Australia
- Russian central bank expected to hike
- Turkey’s central bank likely to extend pause
- US earnings season intensifies
Chart of the Week
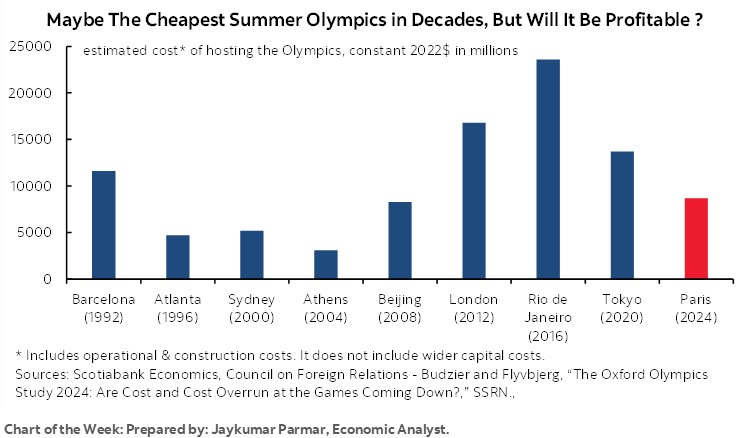
The proverbial canary in the coal mine among central bankers is the Bank of Canada that is expected to deliver another rate cut this week. To be sure, there were many others that eased before the BoC cut in June, but along with the SNB it was the first of the broadly defined club of majors to begin easing. Swiss inflation remains very low, but the BoC is the trial case, or the shock-control experiment for whether it was the right thing to do or a premature declaration of victory over inflation. Canadian core inflation has since bounced sharply higher for the past two months after a brief four month soft patch, thereby adding to the debate alongside persistent upside risks to inflation.
South of the border the focus will be upon the degree to which the US economy is slowing and core inflation is ebbing which may set up easing by the Federal Reserve. The Fed is no doubt watching the international experience including Canada’s with some consternation. So are markets as they continue to drive a considerably cheaper US front-end than in Canada where the latter is priced for perfection that may disappoint.
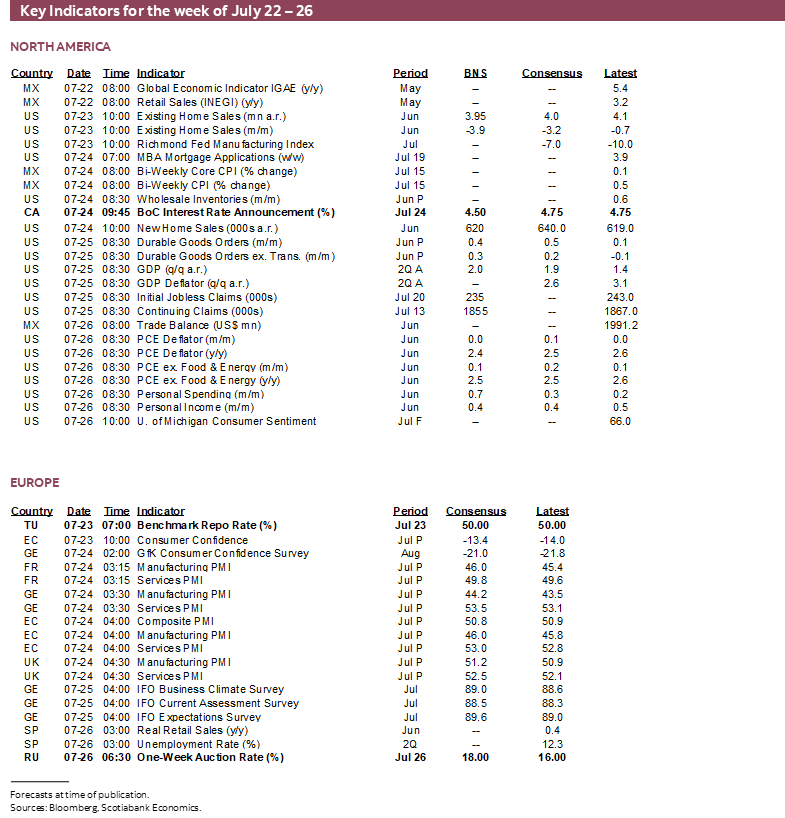
Added focal points will include the intensification of the US earnings season, Biden-watch, a pair of regional central bank decisions (Turkey, Russia), global purchasing managers and several other global macro readings.
BANK OF CANADA—ANOTHER CUT, DESPITE HOT INFLATION. QT ON AUTOPILOT
The Bank of Canada delivers a fresh policy decision with its statement on Wednesday at 9:45amET along with updated forecasts in the quarterly Monetary Policy Report. At 10:30amET, Governor Macklem and Senior Deputy Governor Rogers will deliver a press conference and then scoot away to enjoy a six-week summer break before the next decision on September 4th with no speeches or material communications due over that stretch.
Another Cut is Expected…
Another quarter point cut is widely expected. It is almost fully priced.
If the Bank of Canada does not cut on Wednesday, then this would tighten financial conditions and serve as a confidence-sapping admission that they shouldn’t have started to ease in June.
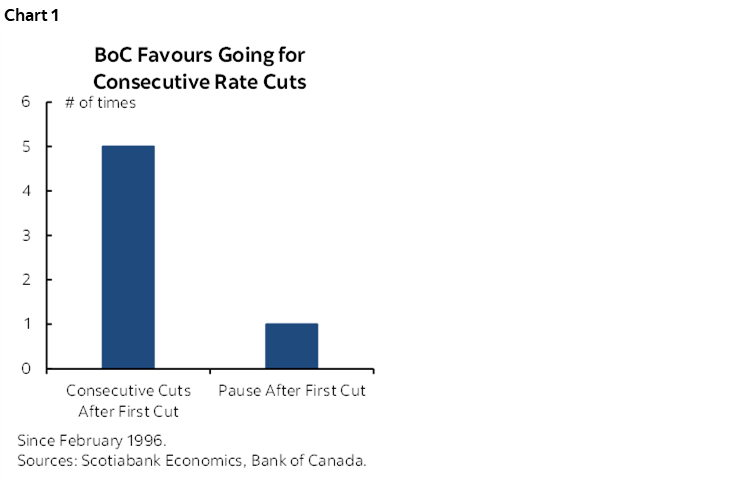
Over about the past three decades, the BoC has followed up the first cut of a cycle with another cut at the next meeting 5 out of 6 times (chart 1). The only exception was an unusual one in early 2015 when Governor Poloz cut in January in response to a drop in oil prices, skipped, then cut again for a small total of 50bps of cuts when the policy rate started at only 1% before the cuts.
If the June cut was well grounded in the first place, then it should be viewed by the BoC as the start of material easing at least up to a meaningful threshold at which point they can consider a pause and evaluate if circumstances at the time warrant doing so. It would be comedic if the BoC cut in June against Macklem’s guidance just a few weeks prior and then didn’t cut as it presents what are expected to remain dovish forecasts, when it is priced and when Governing Council has done nothing to try to dissuade markets from pricing such easing.
…as Forecasts Remain Dovish…
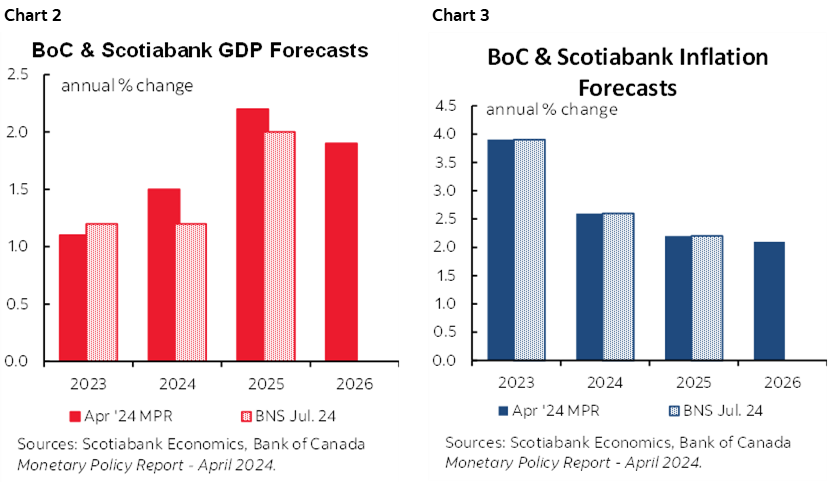
Since this is a full forecast update, it’s worth noting that we don’t expect major changes. Charts 2 and 3 compare our current forecasts for GDP growth and inflation to the BoC’s forecasts the last time they were issued in April. The July MPR doesn’t have to change much while reiterating that the BoC expects inflation to durably land on 2% next year. Watch their updated estimate for Q2 GDP growth that is tracking under 2% q/q SAAR and the BoC’s first attempt at forecasting Q3 growth (we have 2.2%).
…But there is One Wrench in the Works…
The main reason there is any doubt about the call whatsoever is that a four-month soft patch for the BoC’s preferred core inflation gauges has bounced higher over the past couple of months and injected renewed uncertainty (chart 4).
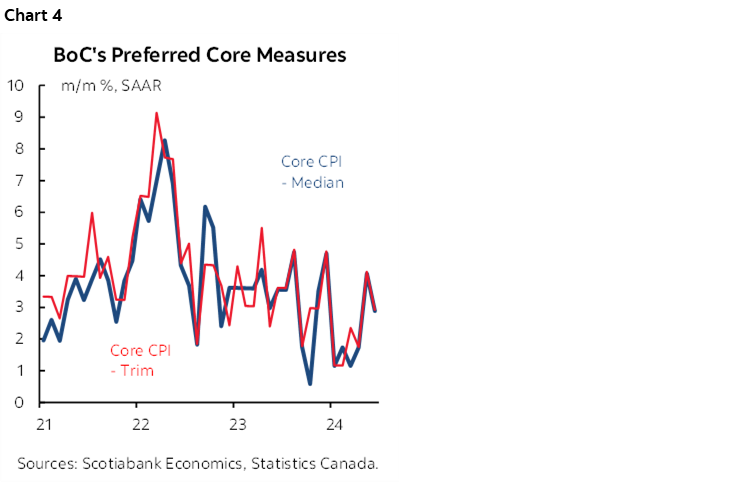
And yet the dominant opinion across competitor economists is that Canadian inflation continued to ebb in June. Horse pucks! I believe that’s confirmation bias and a wholly inaccurate reading of the numbers. After four one-handled readings in a row for trimmed mean and weighted median CPI, May’s readings popped higher by 4.1% m/m SAAR and then came in at 2.9% m/m in June.
It’s not the decelerating y/y headline CPI reading that matters since it is heavily influenced by year-ago base effects and energy prices. What matters is the evidence on underlying inflation at the margin which is why the BoC has come around to looking at the smoothed m/m trimmed mean and weighted median gauges.
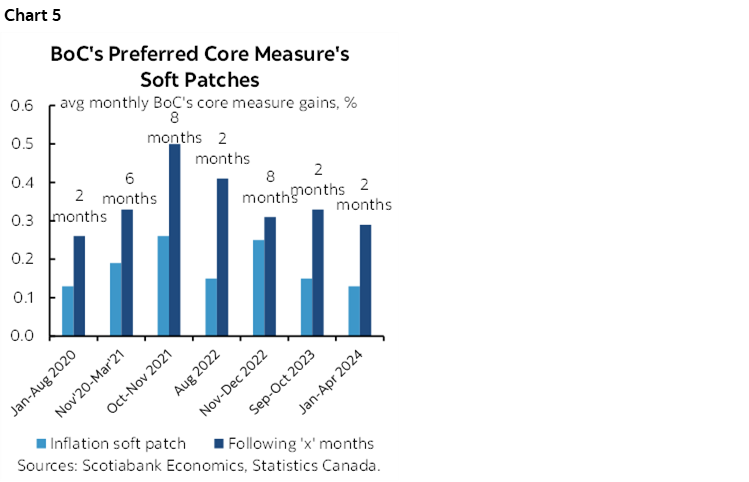
It's likely that the way the BoC plays this dilemma would be to remain adherent to its forecast while viewing short-term data as noisy along the way. That would mean they wouldn’t hold back from a cut this week. If a persistent trend of hotter readings follows, then they would take that into account into the Fall. That’s a real risk given the history of false dawns for inflation (chart 5)
…and Don’t Waste Time on Forward Guidance…
Macklem is unlikely to tee up September’s move, but he has spoken so dovishly that he probably doesn’t need to.
He has told Canadians it is reasonable to expect more cuts which he presumably would have only said in reference to this year since we’ll take next year’s uncertainties as it comes. He has also said that the BoC is “not close to the limits” of divergence from Federal Reserve policy and signalled indifference toward whatever may happen to the currency. My belief is that they are closer to the limits of undershooting the Fed in today’s day and age than Macklem lets on and that Macklem would get a profuse nosebleed if the currency punched materially weaker and long before the most bearish CAD opinions.
Then again, Macklem behaves erratically. His forward guidance is terribly unreliable as we’ve seen throughout his tenure. This is a central bank that wears it as badge of honour when it surprises markets on game day and I swear there is a mischievous element to doing so. This is not the Fed or the RBNZ or the Riksbank or Norges Bank or any central bank that provides explicit forward guidance. Don’t waste your time on it when it comes to the BoC.
…But Be Aware of Ongoing Inflation Risk…
It’s my continued belief that inflation risk remains high, higher in Canada than the US, and that it is premature to assume that inflation has been conquered.
- It may become increasingly difficult for monetary policy to ease as fiscal policy eases as the effects of both reinforce one another to raise inflation risk. Unlike the US, fiscal policy across all levels of Canadian governments is still adding to growth and this is likely to intensify with fiscal pump priming into an election year given that the left-wing Liberal-NDP government is performing so poorly in the polls. Watch for the Fall fiscal statement and next Winter budget alongside pre-election promises.
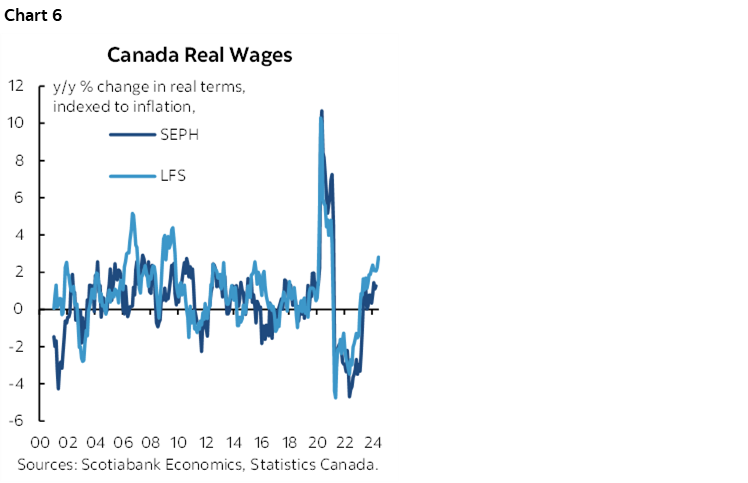
- Real wage growth is accelerating (chart 6) while labour productivity remains abysmal. The effects reinforce one another in terms of inflation risk emanating from labour markets.
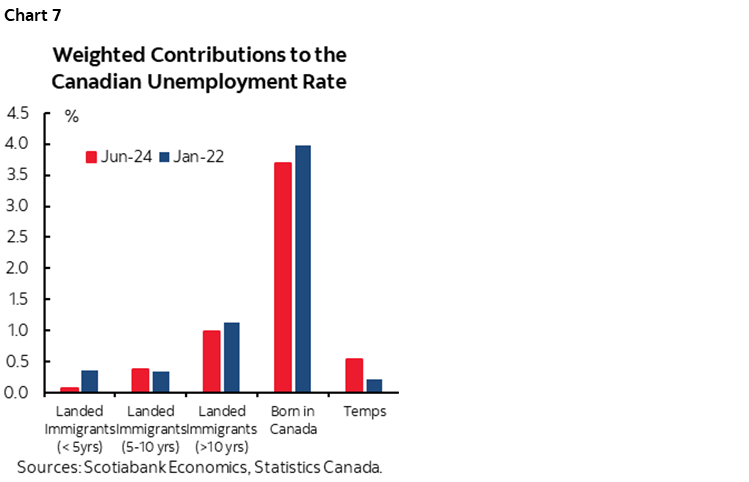
- Why is this happening? The job market remains tighter than the unemployment rate suggests since its modest rise has been overwhelmingly driven by temp residents—students, asylum seekers, and temporary foreign workers—that are poor substitutes if at all for the overwhelming majority of jobs in Canada (chart 7). Further, millions of Canadian workers face expiring collective bargaining agreements in an economy.
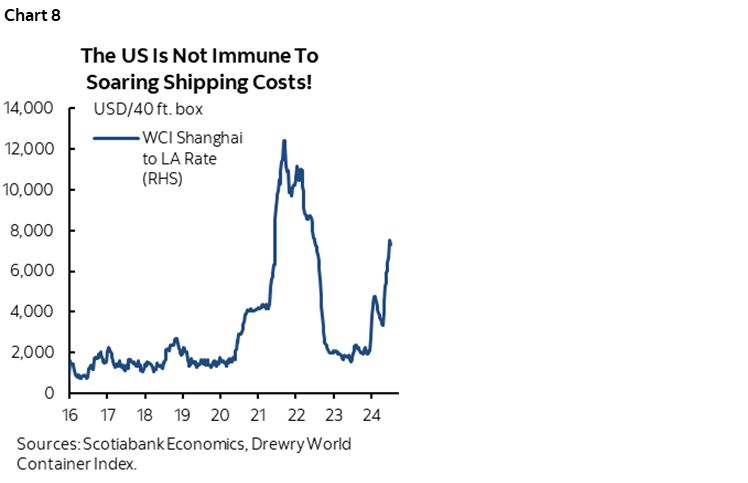
- Supply chains are deteriorating all over again which poses greater risk to a trade dependent economy like Canada (chart 8). Watch the evolution of how the large surge in shipping costs is absorbed in profit margins, producer prices and consumer prices with probably a bit of each.
- The economy is performing better than the BoC anticipated coming into the start of this year when it warned that peak pain would arrive over 2024H1. Progress toward building spare capacity has stalled which lessens downside risk to inflation. Consumption growth has remained strong at 3%+ q/q SAAR over Q4 and Q1 despite the gloom and pending Q2 readings. I think the BoC is overestimating potential GDP growth in the Canadian economy and thus potential future slack and it tends to use changes to its potential GDP forecasts to suit changes in its narrative.
- Inflation expectations remain above target. Financial market conditions have eased including the 5-year GoC bond yield and mortgage rates while CAD remains undervalued and vulnerable and Canadian oil prices (WCS) remain elevated.
…as Canada Looks Dear, US Cheap
Where the market challenge and opportunity lie are in terms of the US-Canadian sovereign bond yield spread. I’ve been arguing for a while that the spread was too wide at the front-end as some combination of excessive cheapness on the US side and dearness in Canada would likely be reduced. That’s come true on the US side as, for example, the US 2-year yield has rallied from the 5% peak to about 4½% now.
The Canada curve, however, has richened further and benchmarks like the 5-year Canada yield is arguably priced for perfection. At 3.35%, 5s are probably at about fair value given reasonable neutral rate and term premia assumptions. The risk of falling lower would be if the BoC faces a sudden deterioration in the outlook that is expected to persist and drives the policy rate below neutral. The risk of rising from here would be if the BoC is unable to deliver on its dovish rhetoric and encounters renewed inflation risk which I think is a material risk.
BoC Not Expected to Change QT—And Don’t Micromanage the Outcomes!
I would not look for any changes to the Bank of Canada’s policy of quantitative tightening in next week’s communications. The program will remain on autopilot.
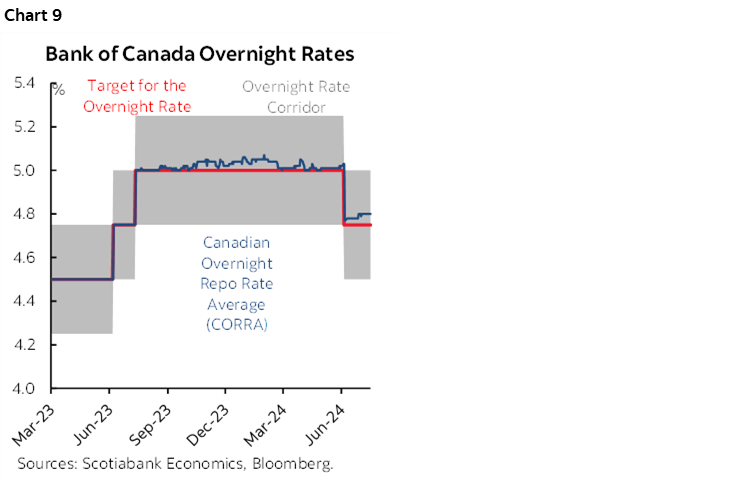
The spread between the Canadian Overnight Repo Rate Average (CORRA) and the BoC’s overnight rate began to widen in early June and hit about 5bps which is testing the limits of past deviations (chart 9). This can be thought of as the analog to if the effective fed funds rate were to materially deviate from where the Federal Reserve is targeting. This is a sign that the BoC’s ability to steer market rates toward the policy rate is being challenged as funding market pressures intensify.
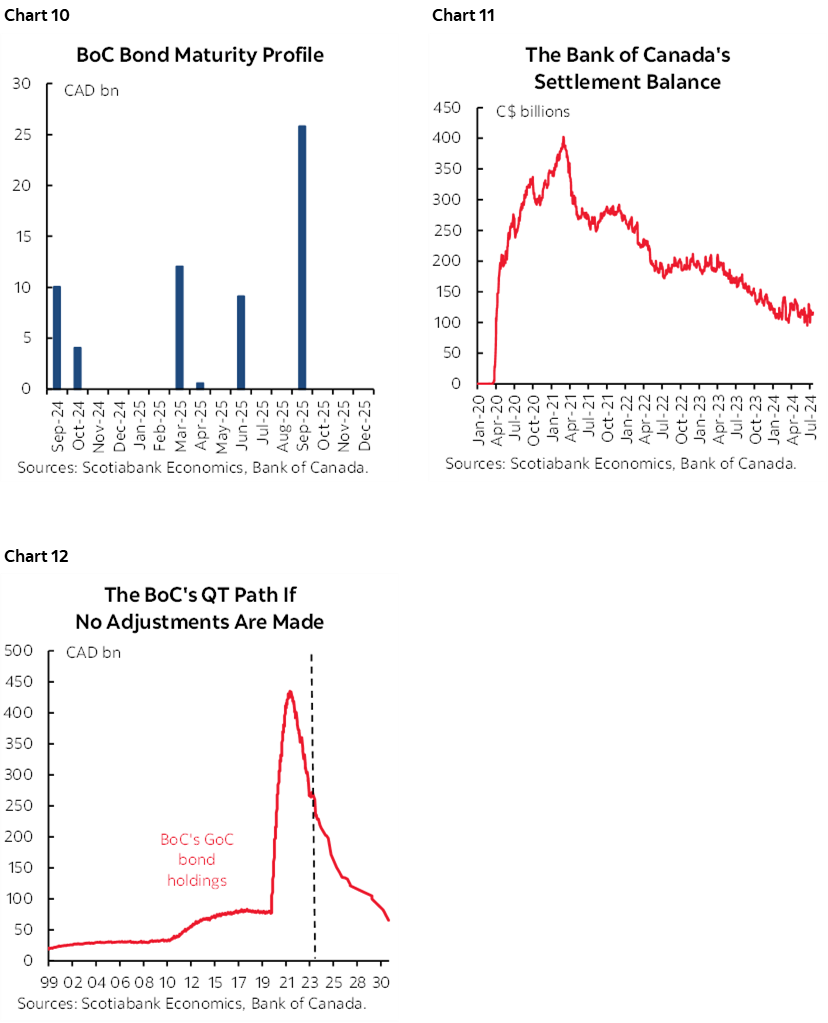
One driver of this intensification might be the BoC’s QT policy that allows its maturing bond holdings to drop off the balance sheet with zero reinvestment. This occurs in lumpy fashion because of the uneven distribution of its holdings (chart 10) and it drains Lynx settlement balances (chart 11). If the BoC retains its 100% roll-off rate, then its holdings of Government of Canada bonds are projected to decline as shown in chart 12. Less liquidity sloshing around the banking system is thought to be contributing to wider spreads, but this may not be true.
One reason why the BoC is very unlikely to alter QT plans at this meeting is because of its practice of communicating balance sheet intentions well in advance. The BoC would likely deliver a speech in advance of a material change rather than springing a surprise that could roil bond markets.
The second reason is that the BoC has previously dismissed QT as the root cause of such spread widening and may do so again now. When the spread widened over the final months of last year and earlier this year, they said that market positioning for expected rate cuts was the dominant driver (here). Market positioning has intensified once again and the BoC may be of a similar opinion on the drivers of wider spreads today.
The third reason is that the BoC is not close to its stated targets for settlement balances. Deputy Governor Gravelle delivered a speech in March that reiterated the goal of bringing down balances to between C$20–60 billion which would equate to somewhere between about ¾% and 2% of 2024 nominal GDP. The balance sits at $116 billion and at almost 4% of 2024 nominal GDP right now and therefore roughly double the BoC’s highest targeted estimate.
The BoC has also made it clear that they prefer using alternative tools for managing the CORRA-overnight rate spread. This has included using repo operations, introducing receiver general auctions, and cash management bills. The BoC just restarted repo operations for the first time since January yesterday with two operations which signals an ongoing preference toward using this tool. Watch how the CORRA-o/n spread evolves and whether the BoC continues to add to repo operations.
I think the BoC should remain neutral toward the narrow distribution of holdings of settlement balances. They should not seek to micromanage the distribution of settlement balances across individual firms or see that narrow distribution as a problem for the overall policy stance on QT. Different firms have different needs for settlement balances, different risks and risk tolerance, different opportunities, and different global funding operations. This guides different choices and the BoC’s job is to target broad conditions, not to pick winners and losers. The BoC has other tools to address potential problems in the system kind of like what we saw in the Fed’s responses to strains across regional banks last year while sticking to its guns on broader policy goals.
Lastly, let’s not lose sight of the BoC’s number one objective here: they want out of bond markets. They wish to normalize their portfolio of Government of Canada bond holdings to a level that is only suited toward what is needed for the normal conduct of monetary policy. There is a very high bar set against knocking them off this course even if it means having to lean on a convoluted and distorting patchwork of supports to funding markets along the way.
Having said all of that, I’ve tried to convey what I think the BoC will do based on their guidance. My personal belief is that they are trying to push settlement balances too low and that they are therefore courting problems in funding markets and possibly future accidents. The FOMC targets excess reserves at 10–12% of GDP and hence vastly higher than the BoC because the FOMC has greater experience and harsh memories of the last time they tried to push cash in the banking system so low. The BoC may face this lesson in future and should tread much more carefully. The one thing the BoC has in its favour, however, is that the FOMC has its back; at the end of the day, it’s how the FOMC manages excess reserves and liquidity that matters the most including its spillover effects into Canada.
US GDP GROWTH—A LITTLE LESS RESILIENT…
The US economy is expected to post mild Q2 GDP growth and very soft inflation using the Fed’s preferred gauge.
GDP arrives on Thursday. A figure around 2% q/q SAAR is expected. There are many uncertainties and tracking of key parts of the economy is difficult. For example, while we have alt-data at hand, a firm reading on service sector activity typically arrives by the second set of revisions to the first estimate when the Census Bureau releases its Quarterly Services Spending report. We also have incomplete inventory and trade figures for the quarter which limits the ability to estimate inventory contributions to growth and import leakage effects.
Because of this, consensus estimates vary from a low of 1.2% to a high of 2.6%. The Atlanta Federal Reserve’s ‘nowcast’ for Q2 growth is the highest of them all at about 2¾% although it also struggles with the services side of the economy. The New York Fed’s ‘nowcast’ is similar.
The GDP figures will help us to understand the degree to which the US economy may be slowing. Recall that growth super accelerated to 4.9% q/q SAAR in Q3 of last year and then 3.4% in Q4 which was part of what crushed the market’s rate cut pricing earlier this year. It slowed to 1.4% growth in Q1 and we’ll soon find out about Q2. Consumption has also slowed from 3%+ q/q SAAR growth in each of Q3 and Q4 to a probably one-handled pace in each of Q1 and Q2.
At the same time that GDP growth may be slowing, the supply side’s potential growth may be picking up. That may be lifting the economy’s noninflationary speed limit to growth, aka potential GDP growth. Whether this is sustained or not is uncertain especially with major policy risks overhanging the outlook in the aftermath of the coming US election. For now, we can probably guesstimate that faster population growth with 3½ million new arrivals in each of the past two years (here) and trend productivity may be boosting actual and potential GDP growth. If so, then combined developments suggest that the economy has probably stopped adding to inflationary excess aggregate demand as measured by output gaps and may be starting to chip away at this.
There should be more confidence that trend growth could slow than at other false dawns for this to happen in a way that reduces inflationary pressures and opens up greater potential for Fed rate cuts.
- Credit conditions continue to tighten and carry lagging effects on growth that may be arriving. The Federal Reserve’s Senior Loan Officer Opinion Survey is one indication of tighter terms for commercial and industrial and commercial real estate loans.
- The market has vastly reduced pricing for Federal Reserve cuts since earlier this year.
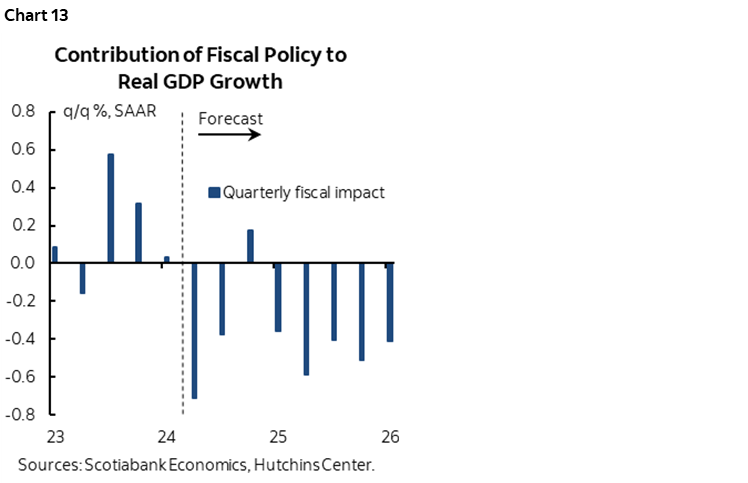
- Fiscal policy has shifted toward a net drag effect on growth (chart 13).
- The strong dollar carries notoriously long and variable lagging effects on the trade account and broader growth. These effects appear to be biting more aggressively now as net trade knocked 0.7ppts off Q1 GDP growth after contributing only 0.3 ppts in Q4 and nothing over the prior two quarters. Further trend softness is expected through more of a pull effect on imports and drag effect on exports.
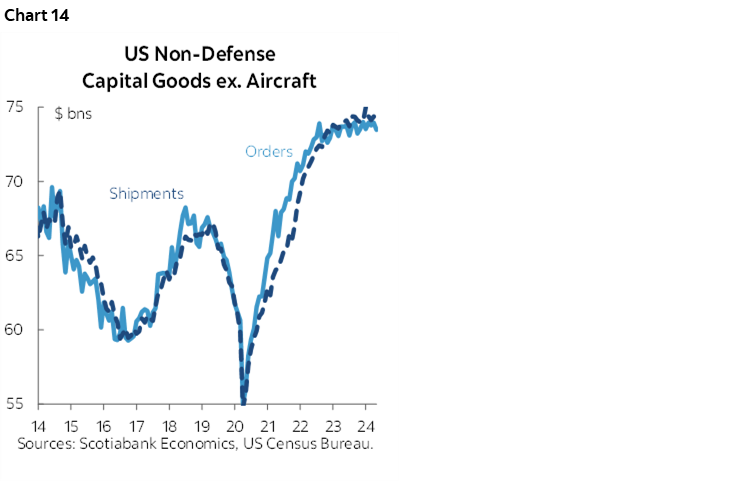
- The US election may dampen c-suite confidence to invest given uncertainty over the trade and investment rules to follow. We saw this happen as US-motivated trade wars were unfolding in Trump 1.0 and hence even before the pandemic and uncertainty may be holding back investment now even amid capacity pressures (chart 14).
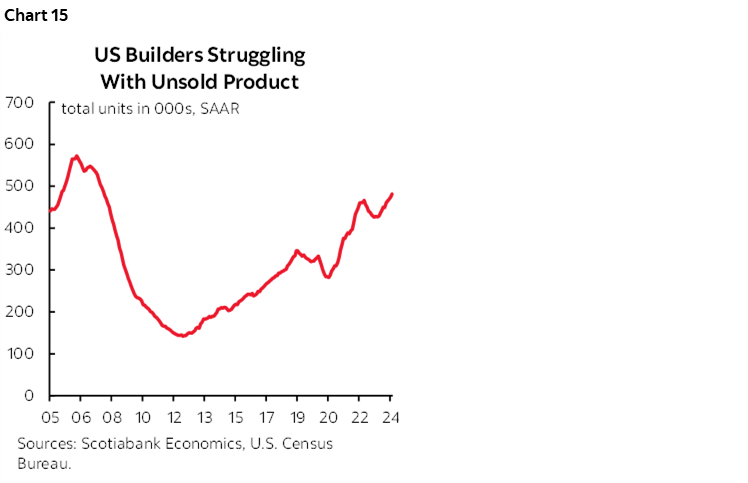
- Housing markets are expected to be a source of weakness for GDP growth given where mortgage rates are and uncertainty toward the outlook. Unsold new home inventories are already at their highest since the GFC which merits caution toward building more while challenging pricing power (chart 15).
- There is fairly compelling evidence that the labour market has moved away from net excess demand toward something more in line with equilibrium. As job vacancies have fallen and population growth has picked up, the breakeven rate of monthly job growth is likely over 200k per month which is around where the trend has been for nonfarm payrolls. This means continued support for consumption but not as powerfully as before.
If all of that rings true going forward, then the Federal Reserve may have greater confidence that the serial pattern of soft patches for core inflation giving way to renewed acceleration might face a weaker chance of occurring this time.
After we get the Q2 figures, Friday’s release for monthly income and spending figures during June will largely just fill in the blanks on the monthly pattern for Q2. The way Q2 ended for retail sales and particularly the core retail sales control group suggests that the quarter probably ended on a strong note for overall consumption.
…AS INFLATION COOLS
The Fed’s preferred core PCE measure of inflation will get a double-barrelled update this week when the Q2 estimate and possible earlier revisions arrive on Thursday and then the June estimate lands on Friday.
Q2 core PCE inflation is forecast to slow to 2.7% q/q SAAR compared to 3.7% in Q1. This includes an estimated 0.1% m/m rise in June. This would be the second 0.1% estimate in a row.
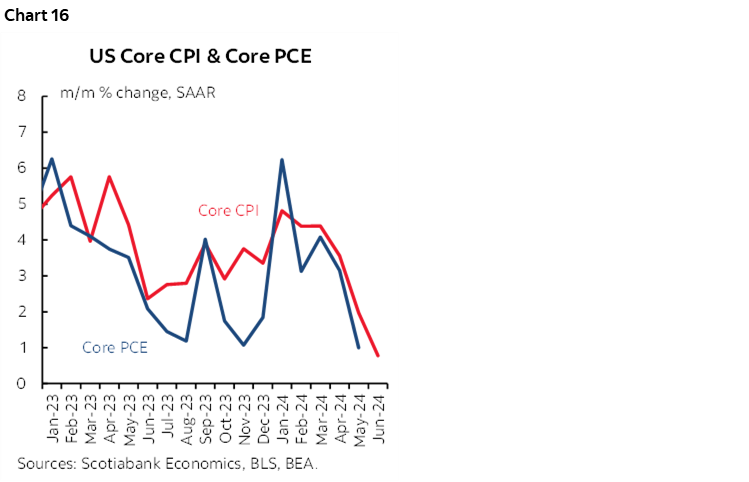
There are two-tailed risks to this June estimate given differences in how PCE is calculated versus CPI. Nevertheless, the usual pattern is for core PCE to undershoot core CPI that itself was a paltry 0.06% m/m SA in June (chart 16). It is not remotely inconceivable that core PCE will be even weaker than everyone’s within consensus.
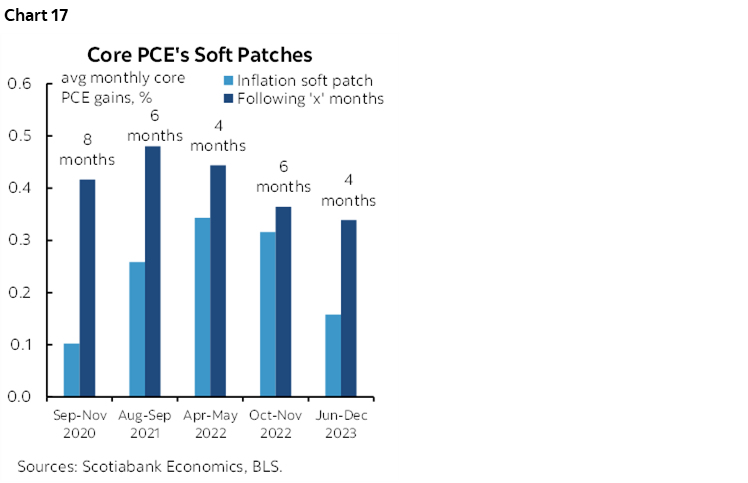
Obviously the debate is over whether this is just another temporary soft patch as shown in chart 17 that shows the varying lengths of prior soft patches and the varying lengths and magnitudes of subsequent rebounds. As the US economy starts to come back into better macroeconomic balance along with the labour market as previously argued, the volatile pattern of future core inflation reports may be under less pressure.
OTHER CENTRAL BANKS—A HIKE AND A HOLD ON THE FRINGES
Other than the Bank of Canada’s decision, the focus across central banks will be upon ECB-speak in the aftermath of the recent decision to stay on hold and a pair of decisions by regional central banks.
Central Bank of Russia to Hike
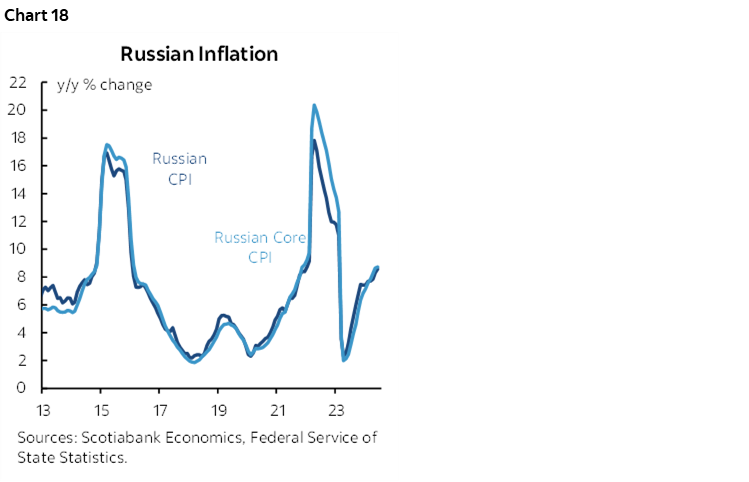
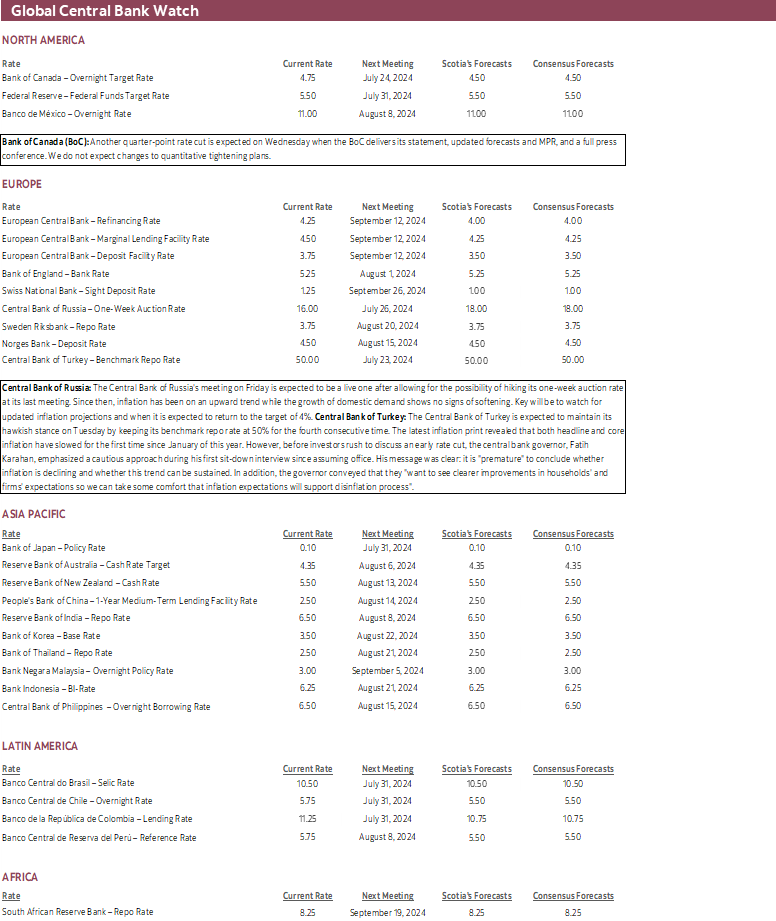
Russia’s central bank could deliver a doozie of a hike on Friday. The last statement on June 7th said that the central bank “holds open the prospect of increasing the key rate at its upcoming meeting.” Deferring at that meeting increased the odds of hiking at this one. Inflation has been on an upswing for some time and stands just shy of 9% y/y (chart 18). A large hike of 200bps is feasible.
Central Bank of Turkey to Hold
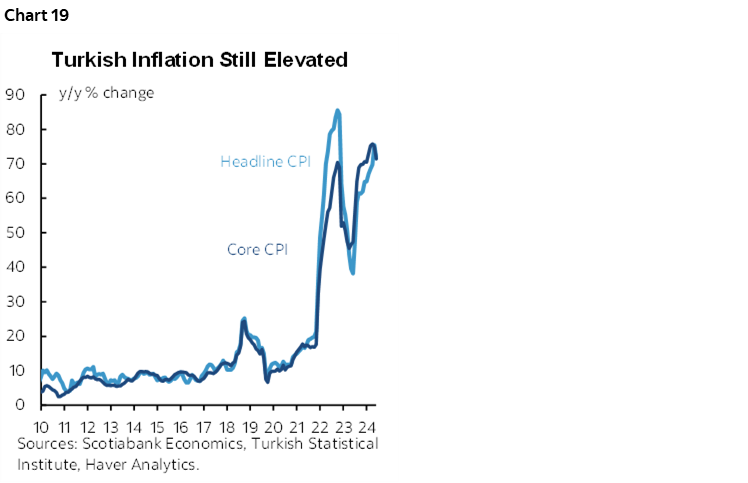
Turkey’s central bank is expected to hold its one-week repo rate unchanged again on Tuesday for the fourth straight meeting. Inflation remains in the stratosphere at 70% y/y for both headline and core CPI gauges (chart 19). Governor Fatih Karahan guided that it is premature to conclude whether inflation is declining based solely on a slight recent moderation and that he wants to see inflation expectations move lower.
OTHER GLOBAL MACRO
The rest of the global line-up will focus upon US earnings and light macro data, a potentially important report for the BoJ, global PMIs, a comparison of Canadian wage measures and the ECB’s inflation expectations.
US Earnings Risk Intensifies
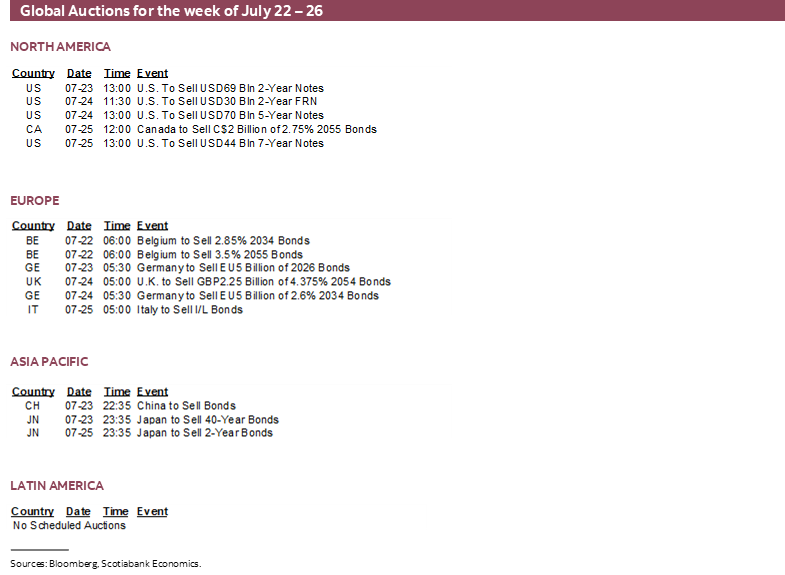
Earnings reports will dominate the rest of the US calendar beyond GDP and inflation. 132 S&P500 names will release including names like Alphabet, GM, Tesla, Ford, eBay, Visa and GE. Macro releases will focus upon an expected decline in existing home sales during June (Tuesday), little change in new home sales for the same month (Wednesday), and a gain in durable goods orders (Thursday). The US also auctions 2s, 5s, 2-year FRNs and 7s this week.
Inflation to Set the Stage for the BoJ
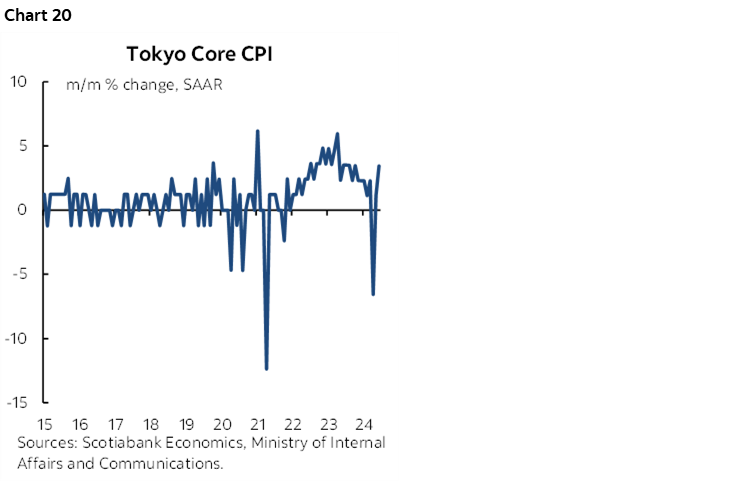
The last and freshest inflation gauge before the Bank of Japan delivers a potential rate hike on July 31st will be the Tokyo CPI measure on Thursday. Should core continue to rebound in m/m terms then it may add additional support for a 10bps hike as soon as the coming meeting (chart 20).
Comparing Canadian Wages
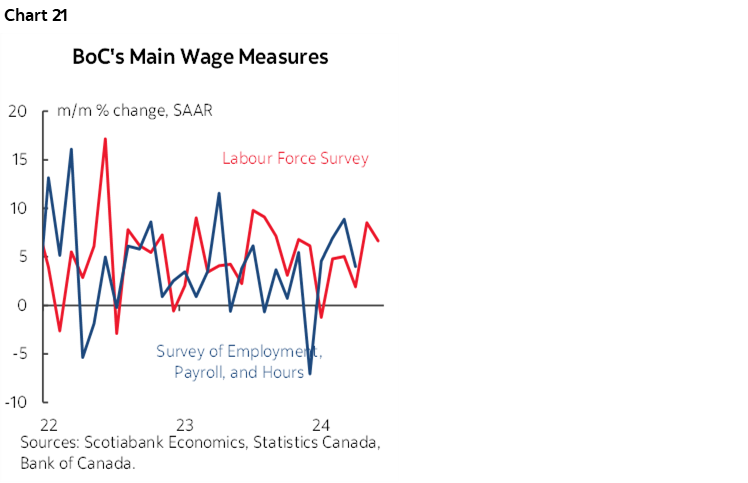
Other than the BoC, Canadian markets will face a very light calendar. Lagging payroll employment and related data for the month of May closes out the week on Friday, but markets tend to pay more attention to the more timely and detailed Labour Force Survey. A comparison of SEPH wage growth and LFS wage growth is shown in chart 21. Canada auctions 30s on Thursday.
Global PMIs
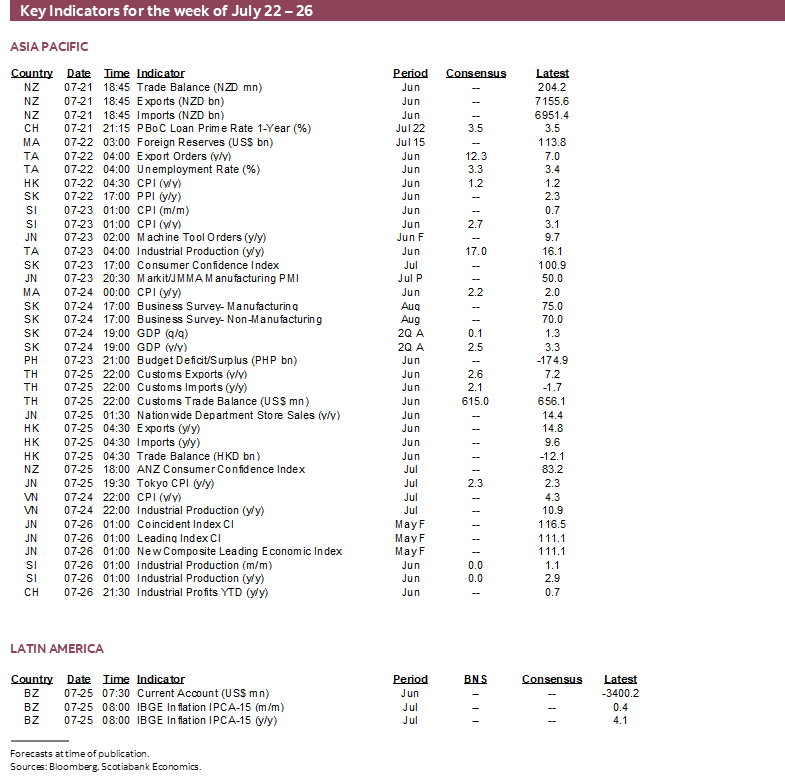
The monthly batch of purchasing managers’ indices for July starts to arrive in Australia and Japan on Tuesday and will be followed by the Eurozone, UK, US and India the next day.
ECB’s Inflation Expectations
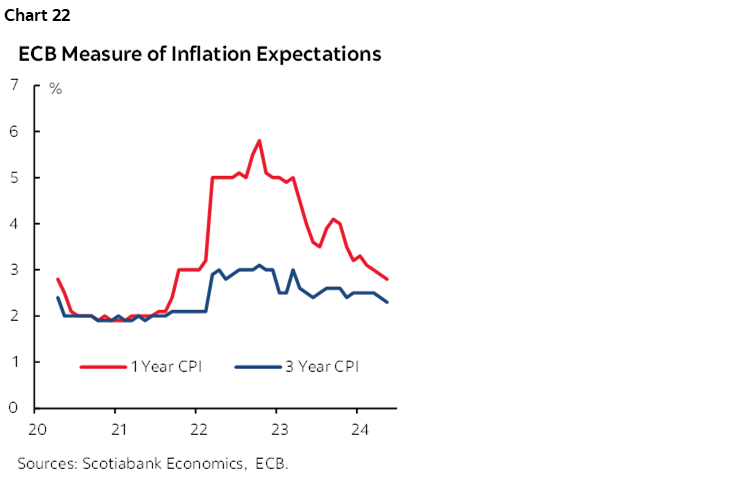
The ECB’s survey measures of 1- and 3-year inflation expectations for June arrive on Friday. ECB officials will be watching for further progress (chart 22) as one of the inputs to what they may do in September after President Lagarde said the meeting is “wide open.” The July 31st and August 30th CPI readings, the late August ECB inflation expectations, and negotiated wages for 2024Q2 on August 22nd will also figure prominently.

DISCLAIMER
This report has been prepared by Scotiabank Economics as a resource for the clients of Scotiabank. Opinions, estimates and projections contained herein are our own as of the date hereof and are subject to change without notice. The information and opinions contained herein have been compiled or arrived at from sources believed reliable but no representation or warranty, express or implied, is made as to their accuracy or completeness. Neither Scotiabank nor any of its officers, directors, partners, employees or affiliates accepts any liability whatsoever for any direct or consequential loss arising from any use of this report or its contents.
These reports are provided to you for informational purposes only. This report is not, and is not constructed as, an offer to sell or solicitation of any offer to buy any financial instrument, nor shall this report be construed as an opinion as to whether you should enter into any swap or trading strategy involving a swap or any other transaction. The information contained in this report is not intended to be, and does not constitute, a recommendation of a swap or trading strategy involving a swap within the meaning of U.S. Commodity Futures Trading Commission Regulation 23.434 and Appendix A thereto. This material is not intended to be individually tailored to your needs or characteristics and should not be viewed as a “call to action” or suggestion that you enter into a swap or trading strategy involving a swap or any other transaction. Scotiabank may engage in transactions in a manner inconsistent with the views discussed this report and may have positions, or be in the process of acquiring or disposing of positions, referred to in this report.
Scotiabank, its affiliates and any of their respective officers, directors and employees may from time to time take positions in currencies, act as managers, co-managers or underwriters of a public offering or act as principals or agents, deal in, own or act as market makers or advisors, brokers or commercial and/or investment bankers in relation to securities or related derivatives. As a result of these actions, Scotiabank may receive remuneration. All Scotiabank products and services are subject to the terms of applicable agreements and local regulations. Officers, directors and employees of Scotiabank and its affiliates may serve as directors of corporations.
Any securities discussed in this report may not be suitable for all investors. Scotiabank recommends that investors independently evaluate any issuer and security discussed in this report, and consult with any advisors they deem necessary prior to making any investment.
This report and all information, opinions and conclusions contained in it are protected by copyright. This information may not be reproduced without the prior express written consent of Scotiabank.
™ Trademark of The Bank of Nova Scotia. Used under license, where applicable.
Scotiabank, together with “Global Banking and Markets”, is a marketing name for the global corporate and investment banking and capital markets businesses of The Bank of Nova Scotia and certain of its affiliates in the countries where they operate, including; Scotiabank Europe plc; Scotiabank (Ireland) Designated Activity Company; Scotiabank Inverlat S.A., Institución de Banca Múltiple, Grupo Financiero Scotiabank Inverlat, Scotia Inverlat Casa de Bolsa, S.A. de C.V., Grupo Financiero Scotiabank Inverlat, Scotia Inverlat Derivados S.A. de C.V. – all members of the Scotiabank group and authorized users of the Scotiabank mark. The Bank of Nova Scotia is incorporated in Canada with limited liability and is authorised and regulated by the Office of the Superintendent of Financial Institutions Canada. The Bank of Nova Scotia is authorized by the UK Prudential Regulation Authority and is subject to regulation by the UK Financial Conduct Authority and limited regulation by the UK Prudential Regulation Authority. Details about the extent of The Bank of Nova Scotia's regulation by the UK Prudential Regulation Authority are available from us on request. Scotiabank Europe plc is authorized by the UK Prudential Regulation Authority and regulated by the UK Financial Conduct Authority and the UK Prudential Regulation Authority.
Scotiabank Inverlat, S.A., Scotia Inverlat Casa de Bolsa, S.A. de C.V, Grupo Financiero Scotiabank Inverlat, and Scotia Inverlat Derivados, S.A. de C.V., are each authorized and regulated by the Mexican financial authorities.
Not all products and services are offered in all jurisdictions. Services described are available in jurisdictions where permitted by law.