Next Week's Risk Dashboard
- Powell likely to retain cautious optimism on inflation
- US CPI: one of four before our September cut call
- FOMC: it’s all in the dots
- The Fed’s balance sheet is back on autopilot
- BoC’s Macklem to speak after violating own guidance, solid jobs
- BoJ may reduce bond purchases
- BCRP expected to cut again
- UK wages still running hot?
- Is Australia’s job market cooling?
- CPI: China, India, Brazil, Colombia, Norway, Sweden
- BoT, CBCT likely to hold
Chart of the Week
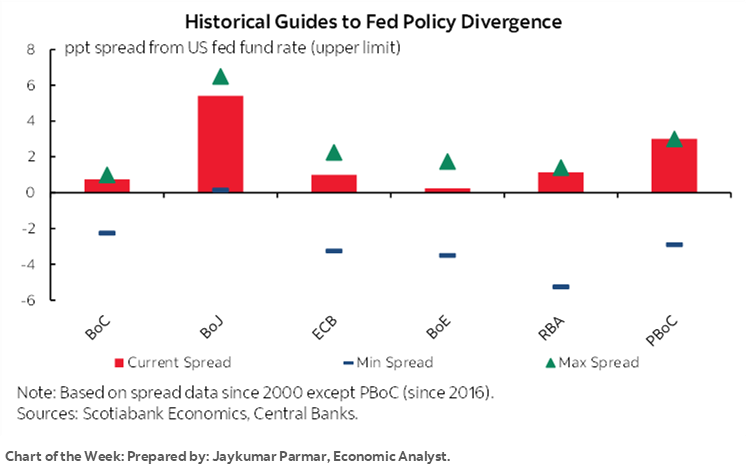
The Fed loves us, the Fed loves us not. Like the hopeless romantic’s exercise in futility, volatile markets keep picking petals off daisies while wistfully seeking an answer. They’ve swung from wildly exuberant cut pricing earlier in the year toward wiping out cuts, then reintroducing them, and now after US payrolls (recap here) they are reducing cut pricing once again to between 25–50bps of cuts later this year.
The week’s main events will probably only serve to supply more daisies for markets to pick while seeking answers that probably won’t arrive for some time yet. Wednesday will be the main focal point when US CPI arrives just hours ahead of the FOMC’s latest communications. Friday’s Bank of Japan decision could be impactful to the yen, JGBs, and potential spillover effects through global bond markets. Other more regional calendar-based influences will be scattered throughout the week.
US CPI—FOUR MORE TO GO!
More nail-biting time awaits rates traders on Wednesday as we go from another US CPI report straight into the full set of FOMC communications.
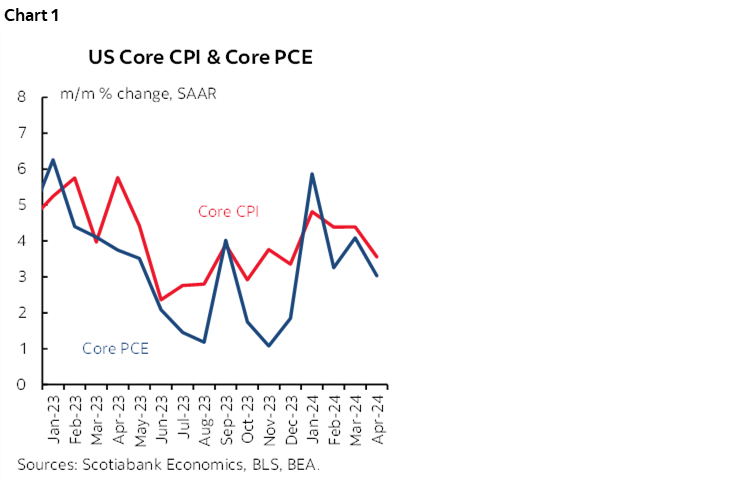
CPI for May arrives at 8:30amET. It arrives at a point when core CPI and core PCE have been running sticky (chart 1). I’ve estimated headline CPI at 0.2% m/m SA and core CPI excluding food and energy at 0.3% m/m SA. The year-over-year rates could see headline rise a tick to 3.5% and core decelerate a tick to converge with headline at 3.5%.
The Cleveland Fed’s ‘nowcast’ model estimates both headline and core at 0.3% m/m SA. One reason why I went lower for headline than core is that gasoline’s flat seasonally unadjusted change translates into a seasonally adjusted drop of about 3% and hence a small -0.1% weighted drag. Food prices are expected to make no weighted contribution to m/m CPI. Vehicle prices are likely to be a flat to slightly negative contributor. I expect shelter to continue to run fairly hot and the same for core services.
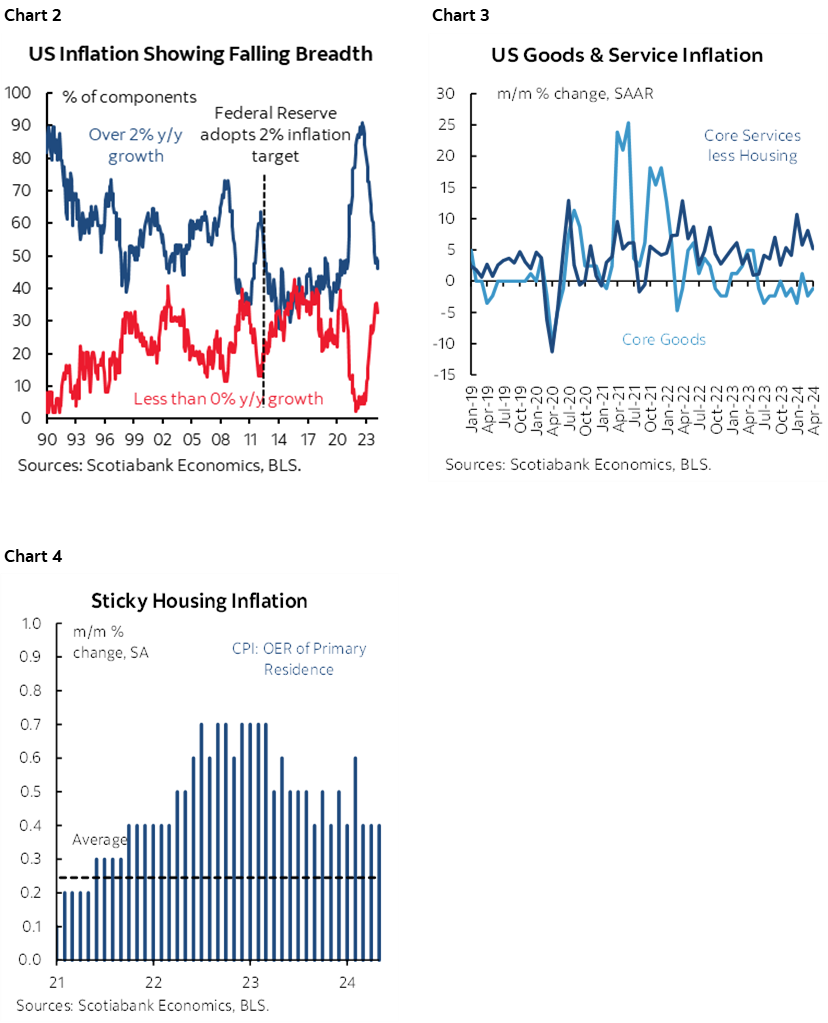
US inflation is nevertheless registering improved breadth (chart 2). Core goods prices have been falling for a while, but core services inflation remains hot (chart 3). So does housing inflation, although it is slowly coming off the prior peak (chart 4).
As for transitioning to FOMC implications, bear in mind that we get four CPI and three PCE inflation reports between now and our call for the first cut to be delivered at the September 18th FOMC decision. That’s a lot of compounded uncertainty throughout the summer. It seems imprudent at this point to give up on easing with so much data ahead of us alongside evidence of a slowing economy and trend decline in measures of excess demand for labour.
FOMC—WAITING AND WATCHING
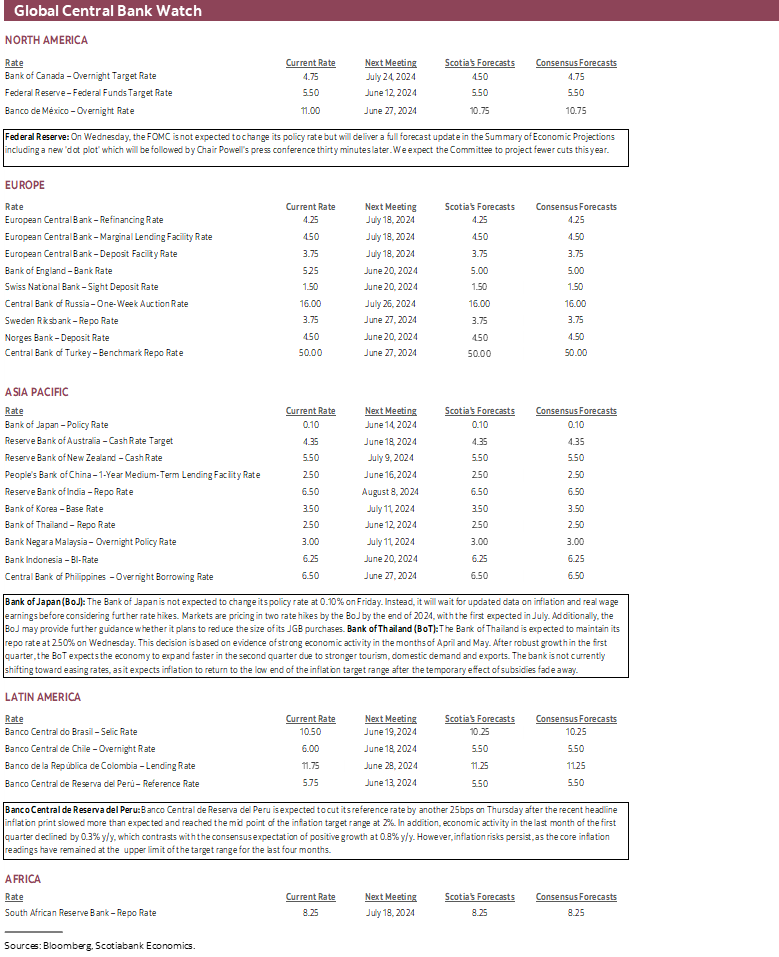
On Wednesday at 2pmET, the FOMC will release its fresh policy statement and the Summary of Economic Projections including the so-called dot plot of rate forecasts. Chair Powell’s press conference will begin at 2:30pmET. A fuller account of the meeting will be provided in the minutes three weeks hence.
No one expects policy adjustments at this meeting. The fed funds target range will remain at 5.25–5.5%. Key, however, may be the ‘dot plot’ aka the not-a-forecast forecast of where FOMC participants think the policy rate may head in future. The median participant’s forecast for rate cuts is likely to be reduced at least for this year compared to the previous forecast in March that showed 75bps of rate cuts in 2024. Nine participants were in that camp, one was at 100bps, five expected 50bps, 2 thought only a single 25bps cut would be delivered and two thought there would be no cuts. It would take very little to swing the median from 75bps to 50bps, but a lot of dots would have to shift to move to just one.
For instance, if just one participant moved from -75bps to -50bps and everyone else stayed unchanged, then it would swing the median call to -50bps. One scenario for swinging the median call to just -25bps for the year would require 8 out of 9 in the -75bps camp to move to -50bps, one to move to -25bps, and all five of the -50bps votes to shift into -25bps. That’s just one scenario, but it demonstrates the high bar to expecting so many Committee participants to change their views.
The centrist opinion is likely to land at 50bps of cuts in 2024. Chair Powell will probably repeat the main messages he shared during his last press conference on May 1st (here). At that time, he said “so far this year the data have not given us that confidence” that dual mandate goals have been achieved which “will take longer than expected.” He also shared cautious optimism that inflation would fall over the rest of 2024 and leaned against any appetite for resuming rate hikes.
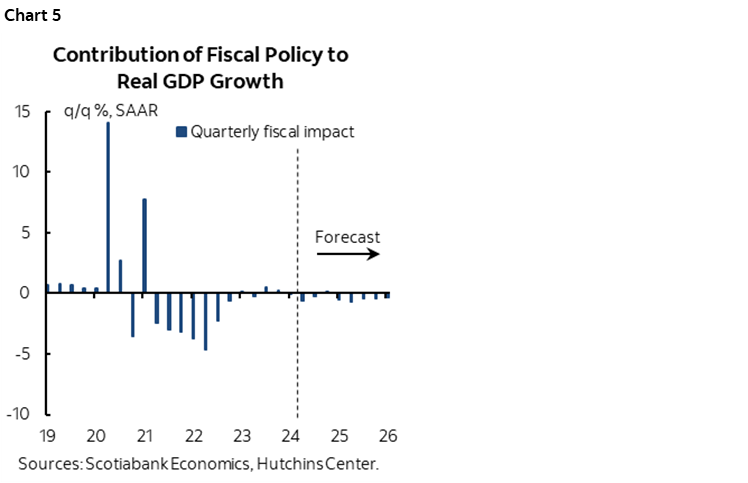
Powell’s cautious optimism has a case, which is the same case we are predicating our views upon. Reasons to expect slower US economic growth include the lagging effects of market tightening that reduced cumulative Fed easing from 150–175bps this year back in January to just 50bps now. Tighter credit standards indicated in the Fed’s Senior Loan Officer Survey should carry lagging negative effects on growth later this year into next. The strong dollar may crimp net trade. Fiscal policy across all levels of government on a net expenditure basis has already shifting toward being a drag effect on growth (chart 5). Election uncertainty may also dampen confidence and related investment and spending activities.
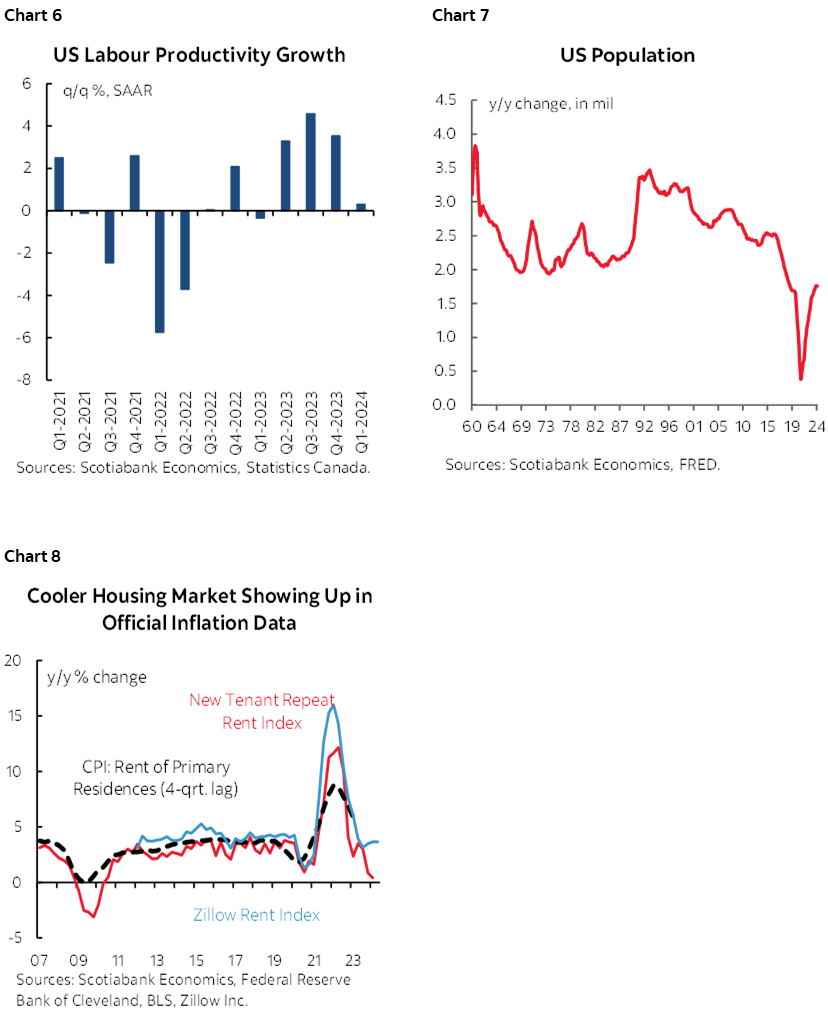
With cooling growth may come cooling inflation. Cooling inflation could also arrive because of shifting supply side drivers that are adding to capacity, such as trend productivity growth notwithstanding softness in Q1 (chart 6), and population growth (chart 7). An added driver of cooler inflation may be prospects for cooling measures of market rents to drive shelter cost inflation lower (chart 8).
With so much evidence on inflation ahead of us, it would be imprudent for FOMC officials to wipe clean prospects for at least two cuts this year and to then roll with the punches.
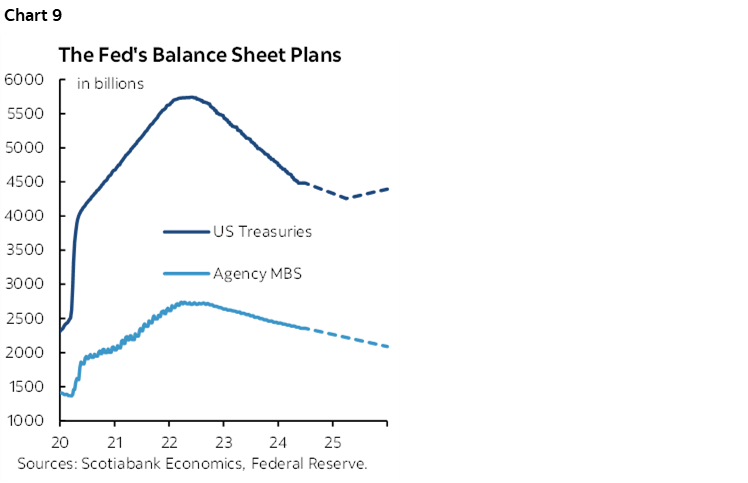
As for balance sheet plans, they are on autopilot for some time again. The reduction in the pace of quantitative tightening that was announced at the May 1st meeting only just began being implemented this month on June 1st (details here). That reduction of the pace of shrinkage of the Fed’s holdings included slowing the pace of decline in Treasury securities from $60 billion per month to $25B per month. The QT downshifting also involves maintaining the cap on agency debt and agency MBS that are allowed to roll off at $35B/mth while reinvesting maturing principal payments in excess of that cap into Treasury securities. In practice, the Fed has generally been unable to consistently achieve the agency/MBS cap. Chart 9 shows projected holdings until we think roll-off ends by about next Spring.
BANK OF JAPAN—FURTHER NORMALIZING STEPS?
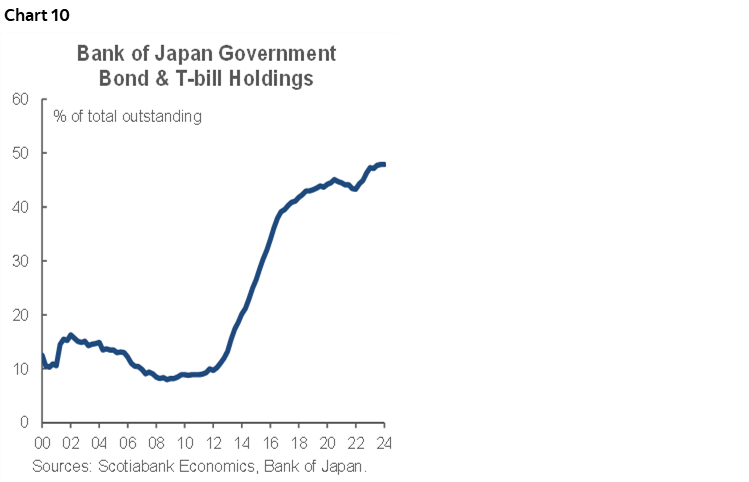
With the Fed out of the way the next major central bank on tap will be the Bank of Japan on Friday. No change is expected to the 0.1% target rate. There is speculation that the BoJ may announce a plan to gradually begin reducing its pace of buying of Japanese government bonds which would be consistent having moved away from yield curve control. It would also take a step toward establishing a ceiling on the Bank of Japan’s nearly 50% share of the market (chart 10).
We expect a generally hawkish tone to the meeting that leaves the door open to additional policy tightening in subsequent meetings and as soon as the July meeting.
One motive for reducing JGB purchases is to make a contribution toward addressing yen depreciation. The yen has depreciated from about 141 to the dollar at the start of the year toward almost 157 now.
Some think that it could be difficult or poor timing to reduce JGB purchases at this point given challenged market liquidity, and that not reducing purchases relative to considerable expectations could drive renewed weakening of the yen.
It is clear that Governor Ueda maintains a hawkish bias while placing emphasis upon two-tailed risks to the inflation outlook as evidenced by this speech. Further detailed insights into how the BoJ views yen depreciation and the outlook for prices was provided in this speech by BoJ Board Member Seiji Adachi.
He draws upon Canadian economist Robert Mundell’s impossible trinity that posits it is not possible to have independent monetary policy, a fixed exchange rate and no capital controls all at once. Something has to give. Adachi’s application of the ‘impossible trinity’ is to note that using monetary policy to address yen volatility can come at the expense of achieving price stability.
He nevertheless argues that expected and prolonged currency depreciation that affects price stability could ultimately require a monetary policy response. It can raise inflation risk through import prices into CPI with a lag of 6–9 months that may drive softer inflation over coming months before more recent yen depreciation drives renewed increases.
Adachi also notes that Shunto wage negotiations may drive higher wage growth with a lag of a few months and contribute to sticky inflation over the second half of this year. He explains that demographic changes may risk labour shortages that require higher wages over time.
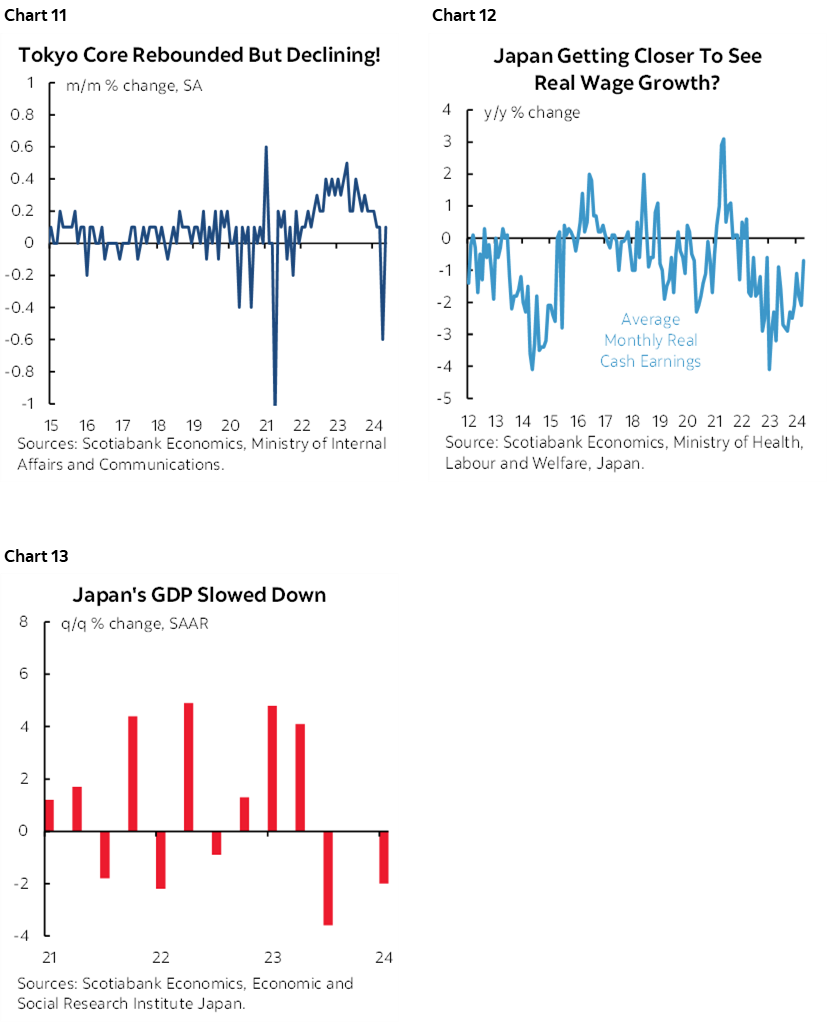
Still, the challenge confronting the BoJ is that core inflation has already been sharply waning (chart 11), two rounds of Shunto wage negotiations have yet to drive positive growth in real earnings although the trend is improving (chart 12), and the economy has contracted in two of the past three quarters and posted no growth in the other one (chart 13). The BoJ’s job is price stability, it’s not clear that upside risks should dominate its decisions on the policy rate given such evidence.
PERU TO HEADLINE THREE OTHER CENTRAL BANKS
Each of the central banks of Peru, Thailand and Taiwan will also deliver policy decisions this week.
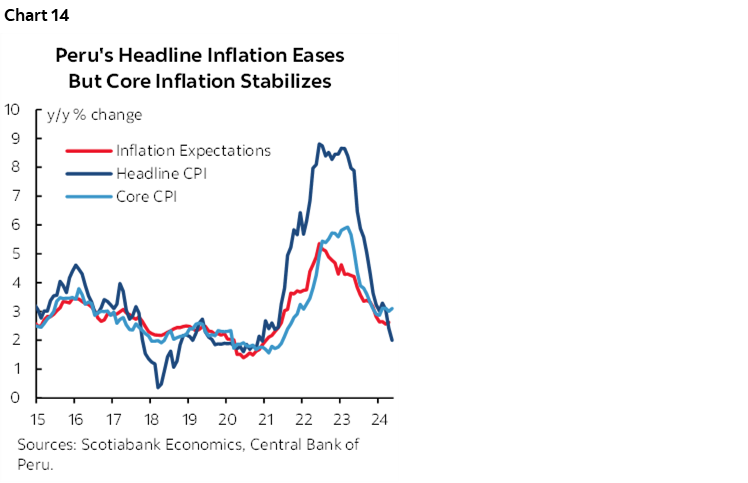
Banco Central de Reserva del Peru is expected to cut its policy reference rate by another 25bps on Thursday. That would bring cumulative easing to 225bps since cuts began in September. Inflation recently surprised lower at 2% y/y (2.4% prior, 2.2% consensus) for the lowest reading since December 2020 before global inflation really started to take off (chart 14). That takes inflation to the mid-point of the 2% +/-1% target range. Core inflation, however, remains sticky as it has been hovering around 3% y/y this year.
The Bank of Thailand is expected to hold its policy rate at 2.5% on Wednesday. Thailand’s inflation challenge has been opposite to elsewhere at very low rates. CPI only just recently popped back into the BoT’s 1–3% policy target range when it climbed by more than expected to 1.5% y/y. A minority believe that cut risk could still be in play at such low levels of inflation.
The Central Bank of China Taiwan (CBCT) is expected to hold its policy rate at 2% on Thursday.
A pair of ECB officials (Villeroy and Nagel) will appear on a panel along with Bank of Canada Governor Macklem at the Conference of Montreal on Wednesday afternoon at 3:30pmET. It’s likely to garner little attention given the close timing to the Fed, but guidance from the ECB officials on their appetite for nearer term easing maybe useful. Villeroy has already said that another cut in July is possible. Since Macklem violated his own forward guidance by cutting this past week (recap here), the only new information has been a solid Canadian jobs report (recap here) and strong US payrolls.
GLOBAL MACRO—REGIONAL GEMS
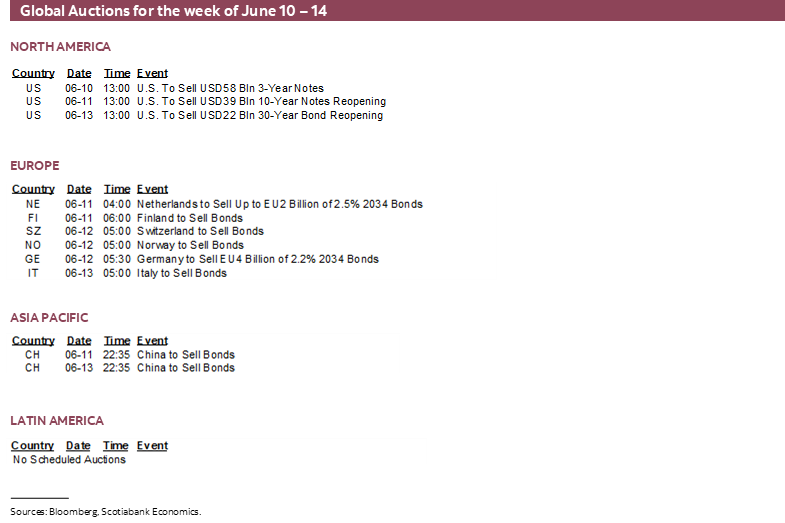
An absence of expected calendar-based macro developments at the global level will nevertheless be accompanied by several developments across local markets.
Canada Driven by External Factors
Canadian markets will follow external developments for the most part. An exception may be if the Federal Government rolls around to introducing implementing legislation for its much-maligned hike in capital gains taxes with the June 25th deadline fast approaching and little time for people to act if they wish to. Other than irresponsible public policy, Canada only takes down a couple of minor reports on manufacturing sales and wholesale trade, both for April and both on Tuesday. Statcan advance guidance pointed toward hefty nominal gains in both, but details like volumes will matter to tracking the Canadian economy.
US—Not Much Beyond the FOMC and CPI
Who among US watchers could ask for anything more than the FOMC and CPI? Apparently not many, or at least the cries for more are not being heard. The US only updates the University of Michigan’s consumer sentiment reading for May that is expected to follow the Conference Board’s gauge higher (Friday), and weekly readings like claims and mortgage applications.
Europe—UK Data Dump, Scandinavian Inflation
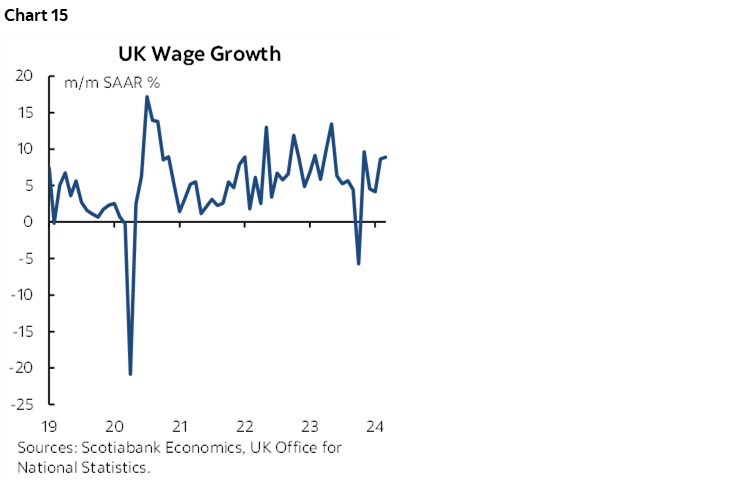
Europe takes down a UK macro dump and a pair of Scandinavian inflation readings as the main focal points. The UK packs almost everything you’d want to know about the higher frequency health of its economy into two days this week. Total employment growth in April, payroll growth for May, jobless claims in May, and wages for April are due out on Tuesday. Hot wage growth is among the factors holding the Bank of England back from easing (chart 15). Monthly GDP, industrial output, construction output, a services index and trade figures arrive the next morning. With the Bank of England priced to hold on June 20th with a partial cut priced for August, it will likely be the wages and job readings that matter most this week. Wage growth has been running at 6% y/y which poses upside risk to inflation as one among many inflation drivers.
Sweden’s Riksbank is priced for no action on June 27th with another cut priced for August 20th. Friday’s CPI for May could impact either call especially after the descent of core CPI stalled out at 2.9% y/y in April. Norway’s CPI reading on Friday Monday is expected to give reading to extend the hold by Norges Bank at a deposit rate of 4.5% until later this year at a minimum.
Is Australia’s Job Market Cooling?
Is Australia’s job market running out of steam? I wouldn’t say so in any alarmist fashion to this point, but recent figures have indicated some moderation and another update is coming on Wednesday. Employment is up by 162k so far this year, but much of that was due to the single month of February that was up by 118k. Since then, about 6k jobs were lost in March and while 38.5k jobs were gained in April they were all part time as full-time spots slipped a touch.
India Focused More on Politics than CPI
India is primarily focused upon the surprise election results that resulted in the loss of the Bharatiya Janata Party’s majority, forcing Narendra Modi to turn to coalition partners to form a government. Data risk may get lost in the shuffle with CPI on Wednesday the only major development that is due out. At 4.8% y/y the prior month with core at 3.25%, inflation is moving within the RBI’s 4% target range. It may not be judged to be there, while the Federal Reserve’s hold pressures the rupee along with the election outcome, such that the Reserve Bank of India is likely to hold on June 7th.
China to Update Low Inflation
China updates CPI and PPI for May on Tuesday and the figures are expected to remain soft. Headline inflation has been running at just above zero in y/y terms with core only a touch higher. Currency vulnerability relative to the Federal Reserve’s prolonged pause limits the ability of the PBOC to ease policy.
LatAm—A Pair of Inflation Readings
A pair of inflation prints may offer local market volatility in Brazil and Colombia on Tuesday. Brazil could witness the first up-tick in the year-over-year inflation rate since September and inch back toward 3.9% y/y while Colombia is expected to continue to slow its descent toward about 7.2% y/y.

DISCLAIMER
This report has been prepared by Scotiabank Economics as a resource for the clients of Scotiabank. Opinions, estimates and projections contained herein are our own as of the date hereof and are subject to change without notice. The information and opinions contained herein have been compiled or arrived at from sources believed reliable but no representation or warranty, express or implied, is made as to their accuracy or completeness. Neither Scotiabank nor any of its officers, directors, partners, employees or affiliates accepts any liability whatsoever for any direct or consequential loss arising from any use of this report or its contents.
These reports are provided to you for informational purposes only. This report is not, and is not constructed as, an offer to sell or solicitation of any offer to buy any financial instrument, nor shall this report be construed as an opinion as to whether you should enter into any swap or trading strategy involving a swap or any other transaction. The information contained in this report is not intended to be, and does not constitute, a recommendation of a swap or trading strategy involving a swap within the meaning of U.S. Commodity Futures Trading Commission Regulation 23.434 and Appendix A thereto. This material is not intended to be individually tailored to your needs or characteristics and should not be viewed as a “call to action” or suggestion that you enter into a swap or trading strategy involving a swap or any other transaction. Scotiabank may engage in transactions in a manner inconsistent with the views discussed this report and may have positions, or be in the process of acquiring or disposing of positions, referred to in this report.
Scotiabank, its affiliates and any of their respective officers, directors and employees may from time to time take positions in currencies, act as managers, co-managers or underwriters of a public offering or act as principals or agents, deal in, own or act as market makers or advisors, brokers or commercial and/or investment bankers in relation to securities or related derivatives. As a result of these actions, Scotiabank may receive remuneration. All Scotiabank products and services are subject to the terms of applicable agreements and local regulations. Officers, directors and employees of Scotiabank and its affiliates may serve as directors of corporations.
Any securities discussed in this report may not be suitable for all investors. Scotiabank recommends that investors independently evaluate any issuer and security discussed in this report, and consult with any advisors they deem necessary prior to making any investment.
This report and all information, opinions and conclusions contained in it are protected by copyright. This information may not be reproduced without the prior express written consent of Scotiabank.
™ Trademark of The Bank of Nova Scotia. Used under license, where applicable.
Scotiabank, together with “Global Banking and Markets”, is a marketing name for the global corporate and investment banking and capital markets businesses of The Bank of Nova Scotia and certain of its affiliates in the countries where they operate, including; Scotiabank Europe plc; Scotiabank (Ireland) Designated Activity Company; Scotiabank Inverlat S.A., Institución de Banca Múltiple, Grupo Financiero Scotiabank Inverlat, Scotia Inverlat Casa de Bolsa, S.A. de C.V., Grupo Financiero Scotiabank Inverlat, Scotia Inverlat Derivados S.A. de C.V. – all members of the Scotiabank group and authorized users of the Scotiabank mark. The Bank of Nova Scotia is incorporated in Canada with limited liability and is authorised and regulated by the Office of the Superintendent of Financial Institutions Canada. The Bank of Nova Scotia is authorized by the UK Prudential Regulation Authority and is subject to regulation by the UK Financial Conduct Authority and limited regulation by the UK Prudential Regulation Authority. Details about the extent of The Bank of Nova Scotia's regulation by the UK Prudential Regulation Authority are available from us on request. Scotiabank Europe plc is authorized by the UK Prudential Regulation Authority and regulated by the UK Financial Conduct Authority and the UK Prudential Regulation Authority.
Scotiabank Inverlat, S.A., Scotia Inverlat Casa de Bolsa, S.A. de C.V, Grupo Financiero Scotiabank Inverlat, and Scotia Inverlat Derivados, S.A. de C.V., are each authorized and regulated by the Mexican financial authorities.
Not all products and services are offered in all jurisdictions. Services described are available in jurisdictions where permitted by law.