Next Week's Risk Dashboard
- Housing’s role in the global productivity problem
- Canadian fiscal easing negates monetary easing
- Are US nonfarm payrolls still resilient?
- Was the soft patch for US wages an anomaly?
- Eurozone inflation is hotter than realized pending an update
- Sticky Eurozone inflation expectations poised for an update
- Canada’s explosive job growth looks to repeat
- The long and the short on Canadian wage growth
- Canada’s economy is rebounding amid excessive pessimism
- BoC surveys will probably show slightly lower inflation expectations…
- …as small businesses continue to signal price hikes while flying under the radar
- A heavy week for Fed-speak
- Europe’s Easter travel plans still aren’t what they used to be…
- …but they are in the US and Canada!
- Banco Central de Chile to cut by another 100bps
- The RBI is expected to hold again
- Other global releases
Chart of the Week
Housing has become a global obsession and like any obsession this carries unwanted side effects. This didn’t just happen overnight as this mania has been building to a crescendo over many years and presenting profound dilemmas to governments and central banks.
There isn’t enough of it, or we over stimulate its demand. It’s a source of good jobs and major part of household wealth, but constantly seeking to stimulate its demand carries consequences that may be incongruent to achieving progress on other fronts. The housing beast sucks in resources from all around it, leaving less for other purposes. There has to be some market discipline, but a fair society can’t have reams of homeless people sleeping on sewer grates and park benches. Homes need to be built, but the environmental consequences can be stark. Governments make a lot of money off of housing, but it costs them a lot too. People like their low-density space but committing to this involves vast sums spent connecting and moving them. These are among the many conundrums facing policymakers as they come under intensifying pressure to address housing affordability.
Perhaps the most important conundrum of all is the evidence on what this preoccupation with housing may be doing to productivity. There is a fairly well-developed literature that posits this obsession with housing—bigger, nicer, with fewer people in each one, and more of it—helps to understand waning productivity across multiple economies over the years since the late 1990s. Some are worse than others, but countries experiencing particularly bad figures of late—like Canada—can at least point to a global phenomenon.
The core issue is this: are many folks across modern societies making themselves house-richer in the shorter-run, but poorer in the longer run if it comes at the expense of productivity growth as the single biggest determinant of rising living standards over time?
This piece, for instance, does a nice job of summarizing some of the studies with embedded links to them. This one from last November explores the linkage across OECD economies and concludes that labour productivity is negatively and significantly associated with rising real house prices.
An economist at the BIS authored an earlier study in 2020 (here) that concluded “an increase in house prices reallocates capital and labour towards inefficient firms, with negative consequences for aggregate industry productivity. Industries with a stronger relative increase in real estate values see a significant decline in total factor productivity.”
There remains further work to be done especially given the relative recency of the literature, but these empirical studies are not done on a total lark. Perhaps respecting this literature should drive governments to pursue housing and productivity agendas simultaneously while avoiding policies that serially feed excess housing demand. Central banks should listen too; on that I’m reminded of a recent interview former BoC Governor Poloz delivered in which he said he’d make the choice any day to court housing excess as a consequence to addressing a macro shock. The point to the literature is that doing so on a serial basis across central banks might ironically be making everyone poorer over time.
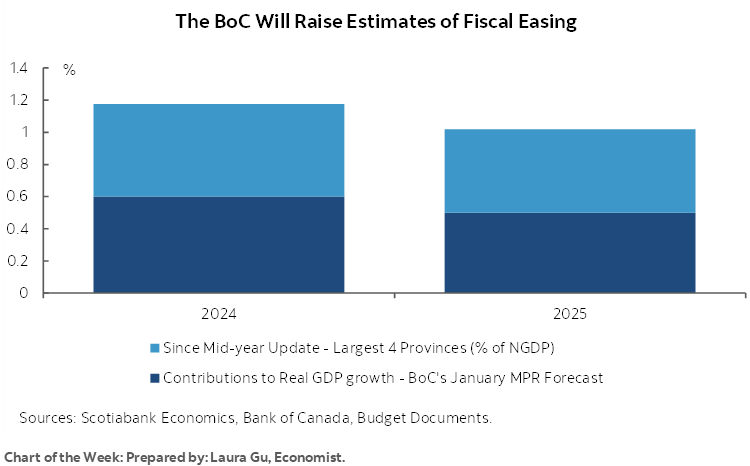
It seems apropos to flag this evidence on the heels of nine-out-of-ten Canadian provincial budgets with just Manitoba left on Wednesday and ahead of the Federal Budget on April 16th given that many governments are tripping over themselves to stimulate more housing while watching productivity figures swirl the bowl. As the cover chart illustrates, housing and higher public sector wage bills are among the key drivers behind another surge in government spending. Fiscal policy easing is adding well over 1% to GDP growth this year without even incorporating whatever may be contained within the Federal Budget plus multiplier effects. Fiscal easing complicates the challenge of getting inflation durable under control and therefore lessens if not negates monetary easing. This lesson continues to fall on deaf ears in provincial capitals.
The ability to keep feeding this beast depends upon strong labour markets. That’s a segue into what matters most on global macro calendars this week. The dominant focus will be US and Canadian job market readings on Friday. Resilient job markets also explain some of the support to ongoing inflation risk ahead of several measures of inflation expectations (Canada, Eurozone) and actual inflation (Eurozone, several countries across LatAm and Asia-Pacific markets). Central banks will be active with a heavy line-up of Fed-speak but only two decisions from Chile and India. Throughout it all we’ll get a suite of other macro readings.
US NONFARM PAYROLLS, PRODUCTIVITY AND WAGES
On Friday, the US BLS will update nonfarm payrolls from the establishment survey and the labour force, unemployment rate and wages from the companion household survey of about 60,000 households. Also watch hours worked alongside GDP tracking to help with estimating productivity growth. I’ve gone with an estimated payroll rise of 225k and a stable unemployment rate of 3.9%.
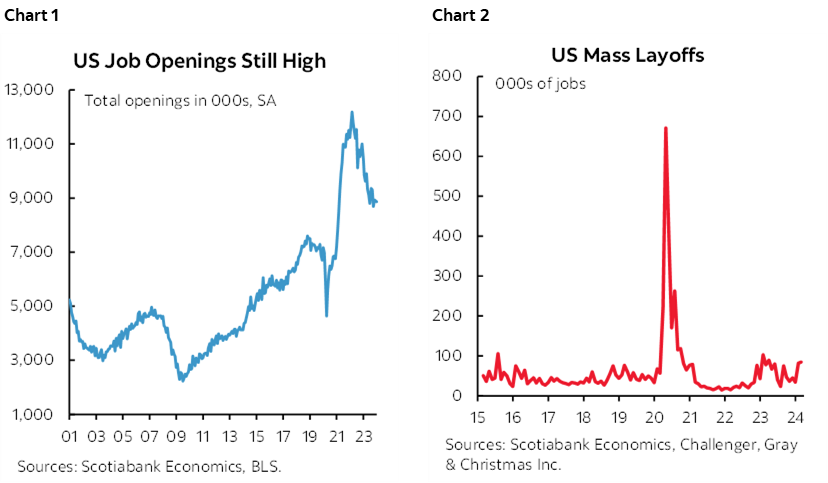
This view may be further informed by labour market readings that will arrive before Friday including JOLTS vacancies on Tuesday that have been declining toward more typical levels (chart 1). ADP payrolls for March are due out on Wednesday but typically throw off false signals in terms of inputs to a nonfarm call. Challenger job cuts during March might inform how much has to be netted out against hiring in light of a recent pick-up to still manageable levels (chart 2).
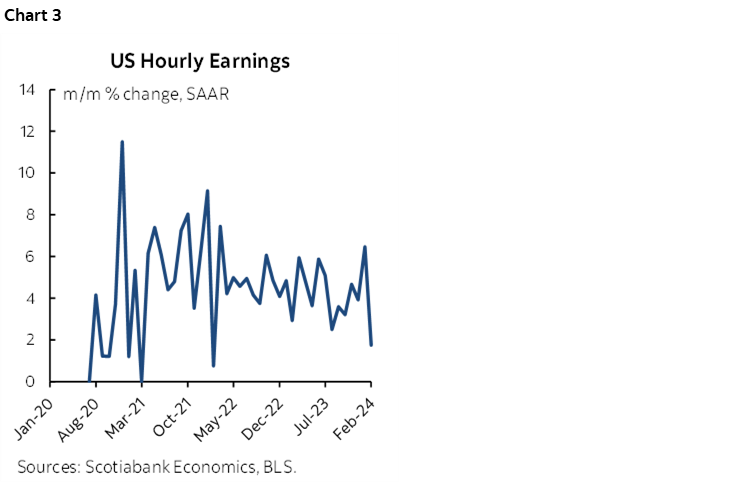
At least as important will be wage growth. It was previously on an upward trend in month-over-month seasonally adjusted and annualized terms until February’s estimate fell back down (chart 3). I’ve gone with that being an anomaly amid expectations for a rebound.
Another important metric to watch will be hours worked. They have been tracking a rise of just 0.4% q/q SAAR in Q1. If that persists and if ‘nowcast’ tracking for Q1 GDP is on the mark at around 2% or slightly firmer, then that would be consistent with a slowdown in productivity growth within the business sector to between 1.5–2%. That would be the slowest productivity gain since the first quarter of last year.
To his credit, Governor Waller did say he doubted the durability of productivity gains in the US economy in his latest speech. 1.5-2% is not bad—in fact it’s positively the envy of America’s friends to the north—but it’s a marked slowdown from the roughly 3–5% quarterly annualized pace of increases we were previously witnessing. That’s important because if this slowdown in productivity growth persists then it might help to explain some combination of slightly firmer core inflation readings of late alongside upside risk to future inflation readings.
CANADA’S JOB MARKET—THE LONG AND THE SHORT ON WAGE GROWTH
Canada updates jobs, wages, hours worked, the unemployment rate and other labour force metrics for the month of March on Friday. I went with +30k for jobs and a stable unemployment rate at 5.8%. As usual, approach the number with high caution given that it’s a statistically noisy household survey with a 95% confidence interval of +/-57k around the estimates. It’s the trend that matters even if markets get whippy around each print.
That trend is robust. Since the end of 2022, Canada has created 520k jobs. Employment is up by about 80k in just the first two months of the year and over 180k in the past six months. I’ll review the evidence on wages in a moment but it’s also robust. You don’t hear about those positives in some of the totally unbalanced hatchet jobs on Canada that I’ve seen and that may as well have been written in Pravda.
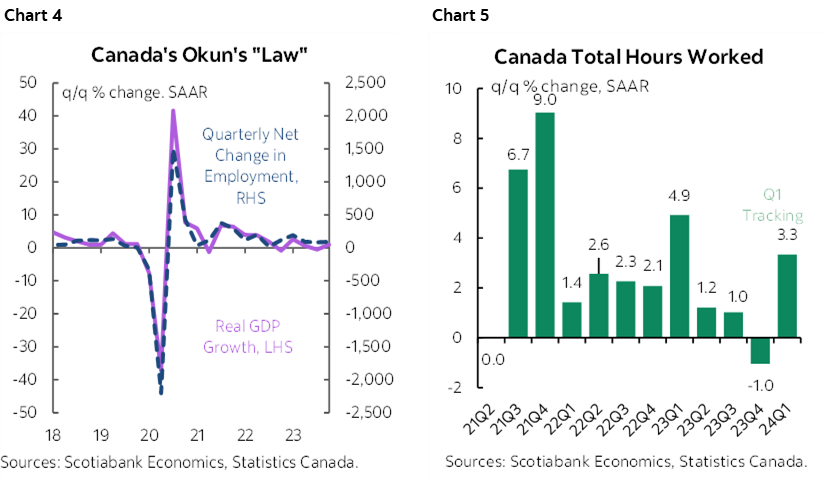
One driver of job market momentum into 2024 is strong economic growth. GDP growth and employment growth can be correlated over time (chart 4). Since Canada is bearing witness to a strong rebound in the economy during Q1 it stands to reason that employment is being carried along for the ride. Hours worked are definitely on an upswing in Q1 pending the figures for March (chart 5). For a recap of current growth tracking please go here.
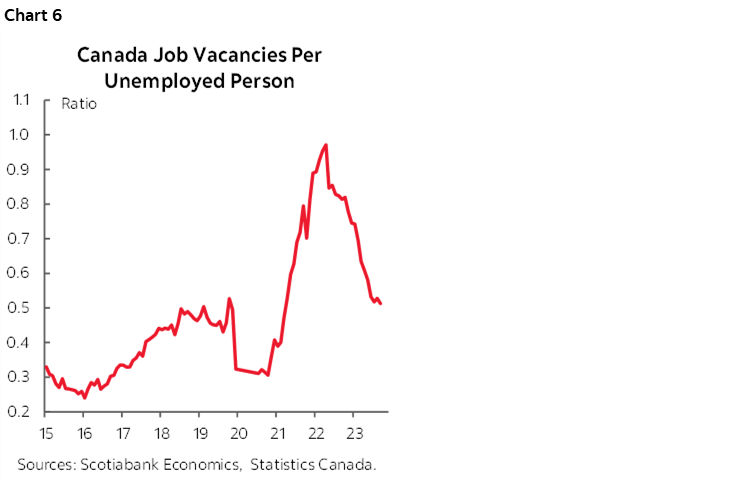
Another driver remains immigration that is helping the born in Canada population to fill job vacancies that have been declining but remain supportive of ongoing job growth (chart 6).
If GDP growth is truly tracking around 3½% q/q SAAR and given that hours worked are tracking a similar rise then the intimation is that productivity is once again performing poorly into 2024. GDP per capita is moving sideways into the start of 2024.
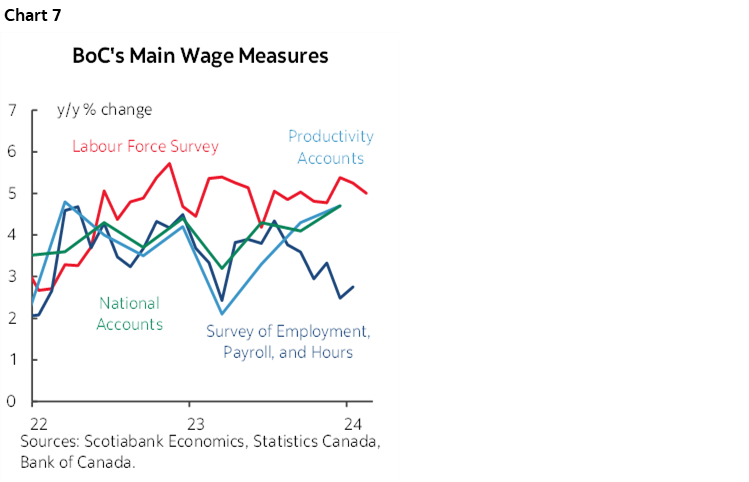
But key here will be wages. Chart 7 shows the four main measures that the BoC tracks as inputs into its wage common composite. The prior softness in the SEPH payrolls measure that the BoC emphasized as a sign of possible moderating wage growth in its last round of communications popped higher again. All wage measures are proceeding at a pace that is well above the BoC’s 2% inflation target.
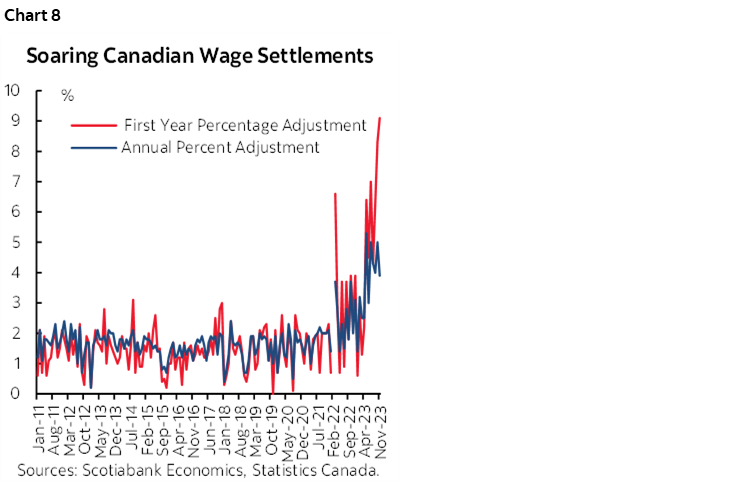
Another way of looking at wage growth is more forward looking in that it assesses contract settlements in collective bargaining exercises that affect one-third of the Canadian workforce (10% in the US). Any particular month has a modest number of contracts settling, but the momentum is very powerful (chart 8). There are a lot of expiring contracts this year and next and you can bet your bottom dollar they’ll be asking for what the last guy or gal got and then some. At this rate, Canada is hardwiring years of wage gains well above the BoC’s 2% target and there will likely be spillover effects into nonunionized sectors. I’m hoping this will be the week when we get an update on the latest figures but the government’s release process is a mess around these numbers.
A yet further way of considering wages is to adjust them for productivity. The all-in way of doing so is unit labour costs that adjust total employment costs for productivity over time. ULCs continue to rise rapidly, thus complicating the BoC’s efforts to combat inflation.
INFLATION—READINGS AND EXPECTATIONS
A lot of updates on global inflation and inflation expectations lie ahead so let’s just rattle them off and return to assessing them throughout the week.
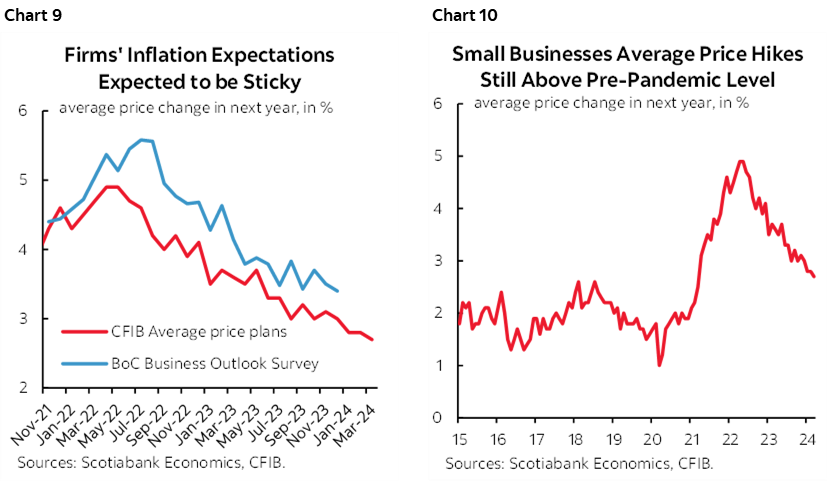
Monday brings out the Bank of Canada’s twin consumer and business surveys that include a rich variety of readings including measures of inflation expectations. Expect a mild further softening. As chart 9 shows, small business expectations have moved lower into 2024 and are highly correlated with the BoC’s business measures albeit that the small business gauge tends to run at a lower level. That could indicate that inflation expectations are making a little further progress but remain toward the upper end of the BoC’s 1–3% inflation target range. Still, it merits noting that amid all the bashing of larger businesses by governments, small businesses continue to plan price increases above the BoC’s 2% inflation target over the coming year and have been a major contributor to inflation even if they make for harder targets by politicians (chart 10).
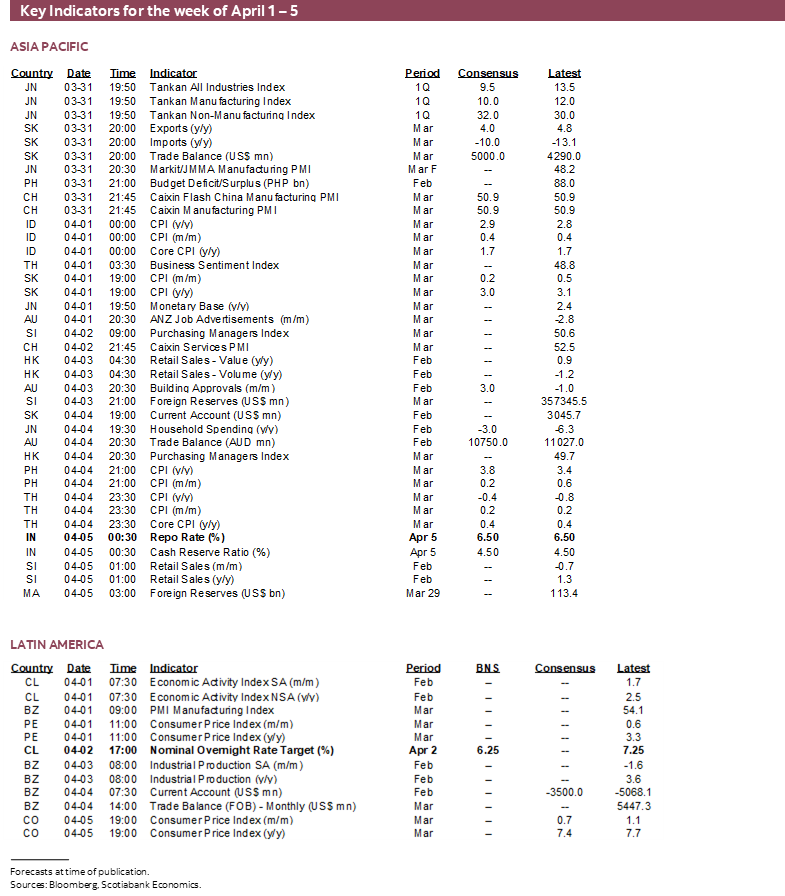
Monday also brings out readings from Peru that is expected to decline to under 3% y/y from 3.3% the prior month and thus register further progress.
South Korea and Indonesia are due out on Monday with Korean core inflation recently running around 2 ½% y/y which is above the Bank of Korea’s 2% headline target but well off the peak of 4.2% in late 2022. Indonesian core inflation is running under 2% but Bank Indonesia is worried about doing anything that would stoke rupiah weakness until the Federal Reserve et al reach the point of being comfortable to begin easing.
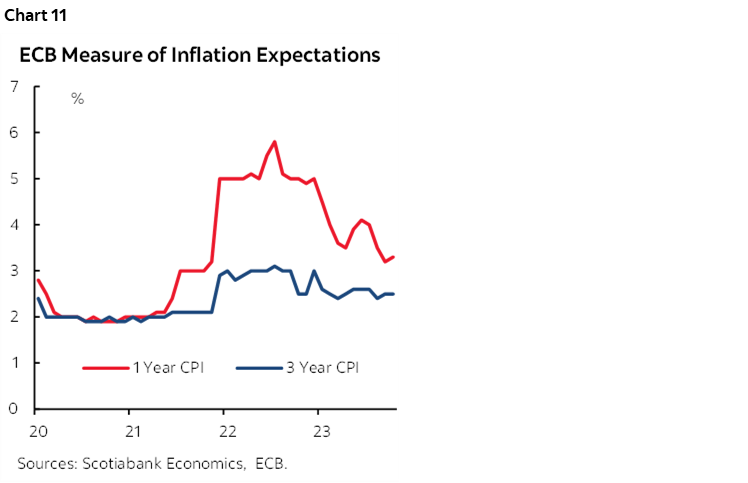
The ECB’s measures of inflation expectations over 1- and 3-year horizons are among the ingredients being monitored by the ECB and will be updated on Tuesday. These measures have been sticky of late (chart 11).
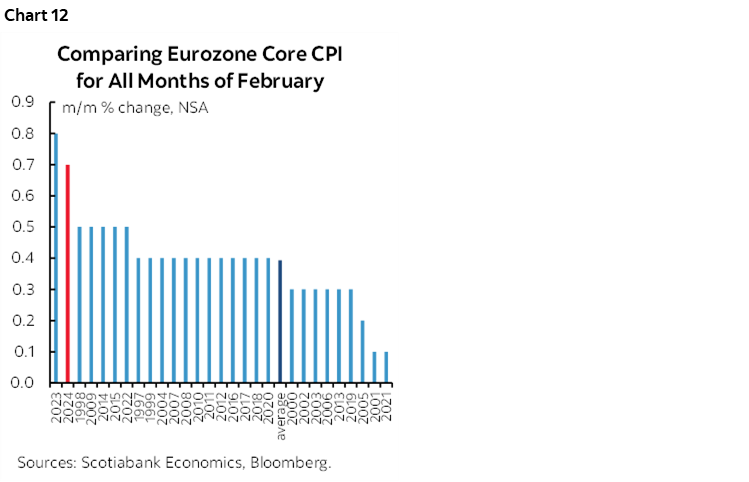
Eurozone inflation for March follows that up on Wednesday. Eurozone core inflation hasn’t been light as seasonally adjusted month-over-month gains have been running at among the hottest rates on record compared to like months in history including February (chart 12). March’s update will further inform the trend. As this publication is being distributed we await data from France and Italy on Friday March 29th as well as figures from Germany on Tuesday that will help firm up estimates before the Eurozone add-up. Sticky inflation expectations and firm core inflation shouldn’t make the ECB in a rush to cut rates as it also awaits Q1 wage figures that reflect important negotiations at the start of each year.
The week wraps up with inflation readings from the Philippines, Thailand, and Switzerland on Thursday and then Colombia on Friday night after markets close.
CENTRAL BANKS—GOT A MINUTE, OR FOUR?
Two central banks will weigh in with decisions this week, but they are unlikely to carry spillover effects into global markets. Heavy Fed-speak is on tap. Four central banks will deliver scintillating meeting minutes.
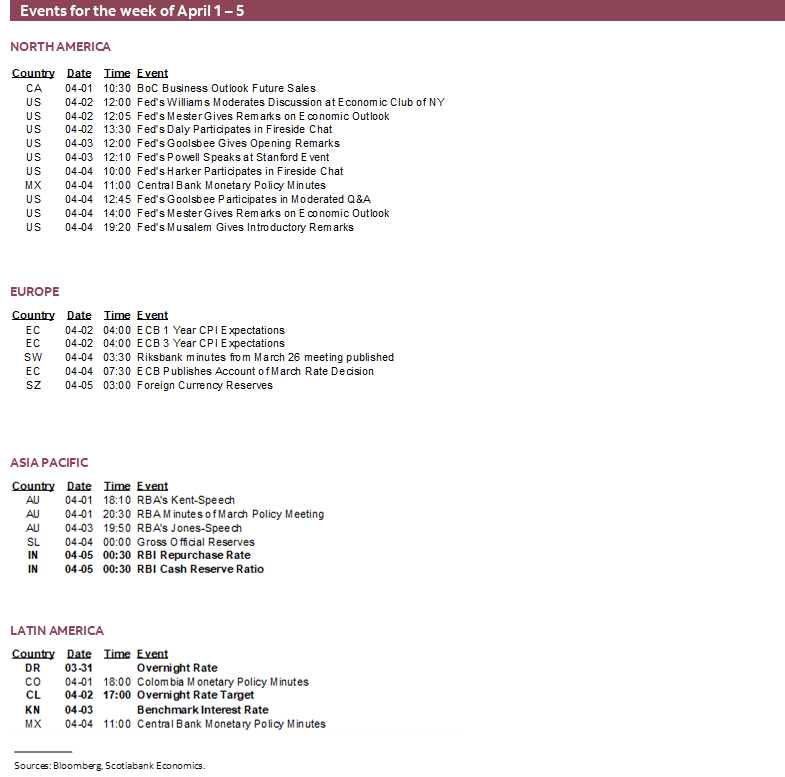
A very active calendar for Fed-speak will bring out numerous speakers. Chair Powell speaks twice, once on Friday March 29th just after this publication is being distributed. He will return on Wednesday at a Stanford University event but the topic is unknown. A wave of regional Fed Presidents will speak throughout the week.
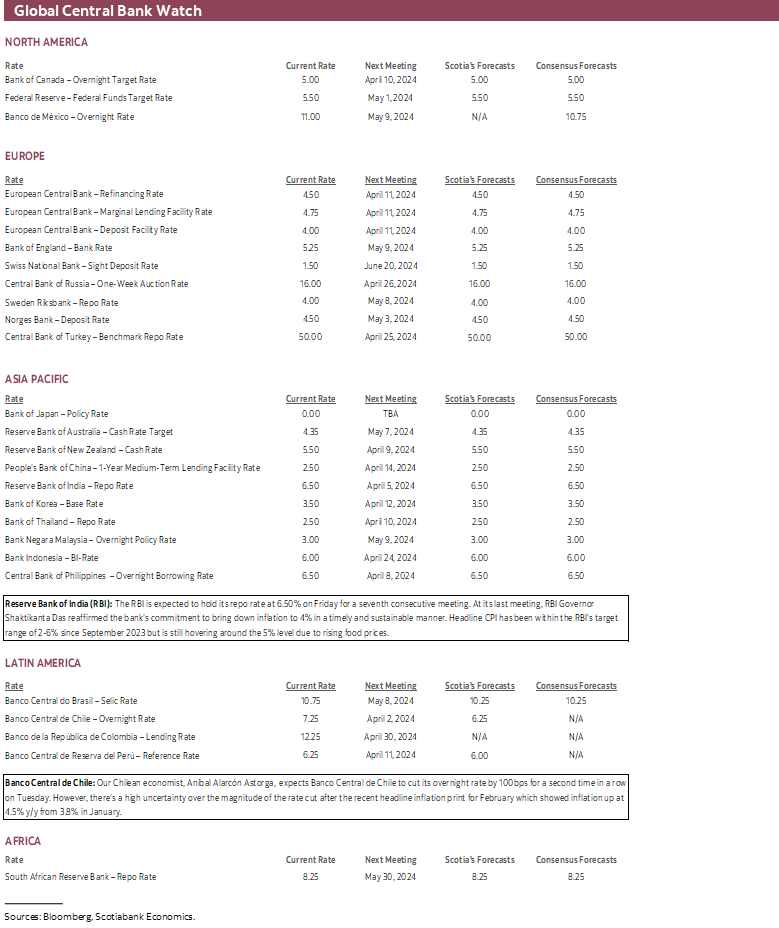
Our Chilean economist, Aníbal Alarcón Astorga, expects Banco Central de Chile to cut its overnight rate by 100bps for a second time in a row on Tuesday. However, there's a high uncertainty over the magnitude of the rate cut after the recent headline inflation print for February which showed inflation up at 4.5% y/y from 3.8% in January.
The RBI is expected to hold its repo rate at 6.50% on Friday for a seventh consecutive meeting. At its last meeting, RBI Governor Shaktikanta Das reaffirmed the bank's commitment to bring down inflation to 4% in a timely and sustainable manner. Headline CPI has been within the RBI's target range of 2–6% since September 2023 but is still hovering around the 5% level due to rising food prices.
As for those meeting minutes, Colombia’s BanRep kicks it off on Monday followed by the RBA and then both the ECB and Banxico on Thursday.
OTHER GLOBAL INDICATORS
Beyond the marquee releases this week we will also get a number of updates from across several markets.
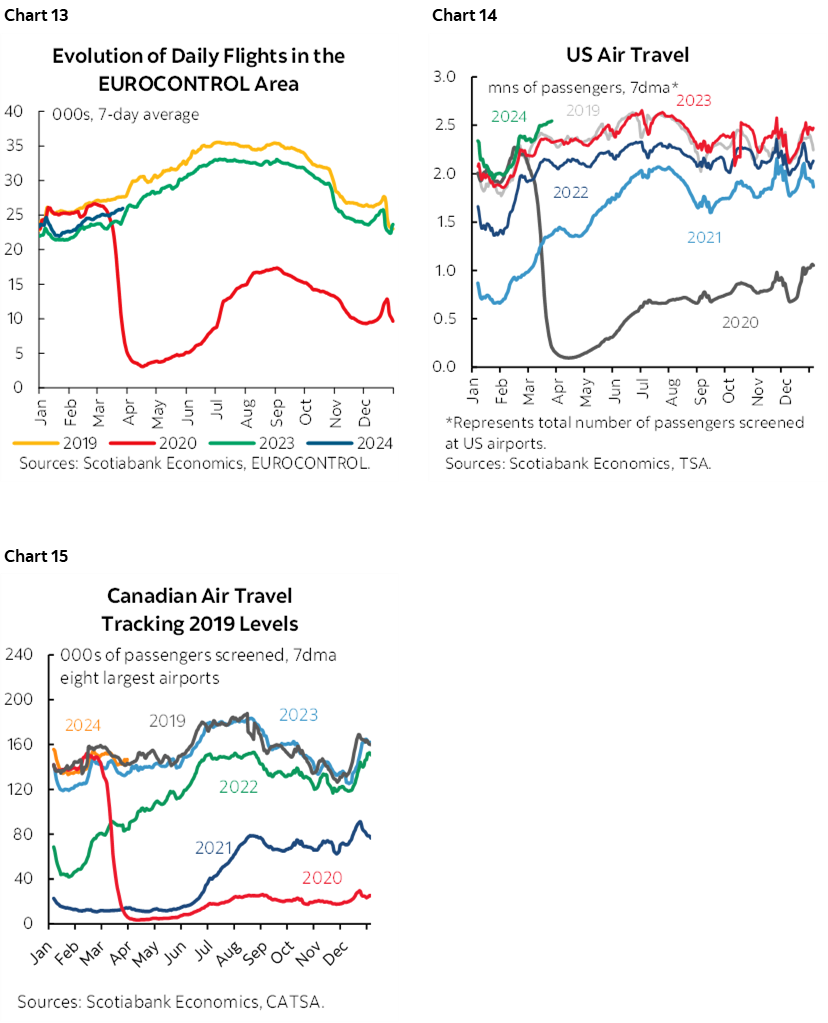
For one, keep an eye on Easter weekend travel figures particularly given in Europe where the four day weekend is a bigger deal than in N.A. Flights, for instance, are tracking higher than last year but remain lower than in 2019 before the pandemic (chart 13). By contrast, US air travel is above 2019 levels (chart 14) and Canadian air travel is on par with 2019 (chart 15).
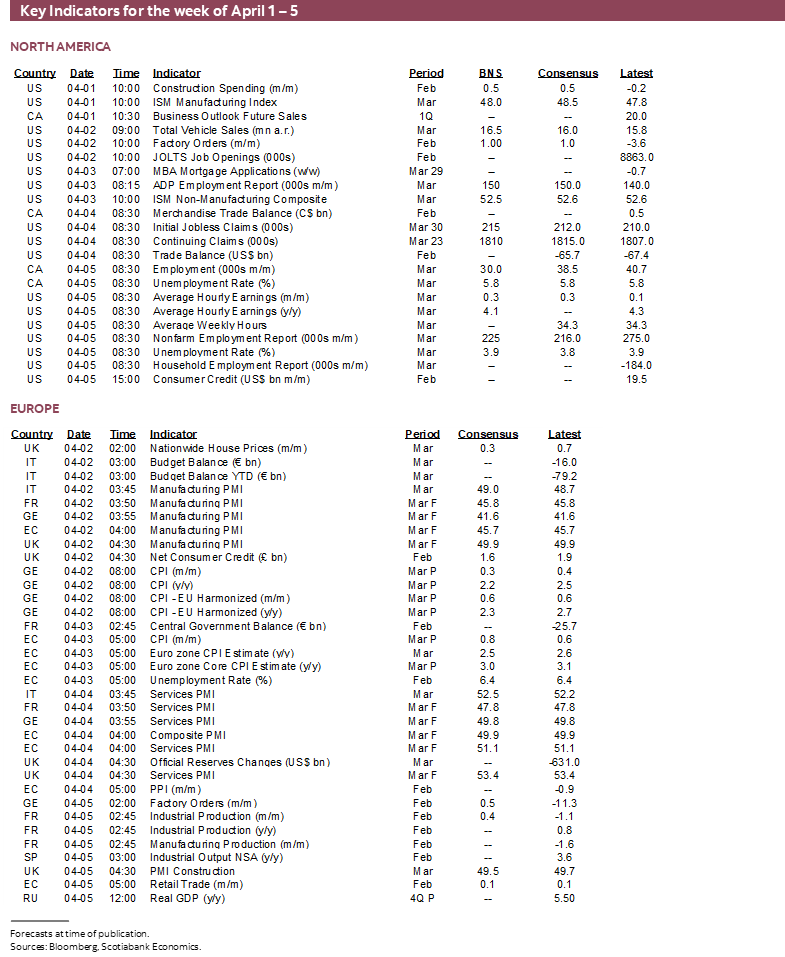
ISM gauges of activity represent soft data that can inform expectations for hard data. They will dominate the rest of the US macro line-up when the manufacturing (Monday) and services (Wednesday) readings arrive. Industry guidance points to vehicle sales (Tuesday) jumping toward 16½ million units at a seasonally adjusted and annualized pace for about a 4% m/m SA gain. Construction spending during February (Monday), factory orders for the same month (Tuesday) and trade figures (Thursday) round it all out.
China updates purchasing managers’ indices for March this week. They’ll include the state’s readings on Saturday and then private sector readings at the start of the week. Slight improvements have been registered in the state’s composite and service sector readings.
Canada also updates purchasing managers’ indices for March on Monday (manufacturing) and both the services and composite gauges on Wednesday. Those PMIs are likely superior to the Ivey gauge that lands on Friday as it combines all private and public sectors into one set of readings and is therefore difficult to interpret in terms of what is driving them. Trade figures on Thursday will cover February amid limited evidence so far that net trade may be tracking a small positive contribution to GDP growth in Q1.
Other soft survey-data will arrive from Japan with its Tankan readings for Q1 (Sunday ET), followed by PMIs from Mexico on Monday, Brazil on Wednesday, and also Spain (Tuesday) and Italy (Thursday).

DISCLAIMER
This report has been prepared by Scotiabank Economics as a resource for the clients of Scotiabank. Opinions, estimates and projections contained herein are our own as of the date hereof and are subject to change without notice. The information and opinions contained herein have been compiled or arrived at from sources believed reliable but no representation or warranty, express or implied, is made as to their accuracy or completeness. Neither Scotiabank nor any of its officers, directors, partners, employees or affiliates accepts any liability whatsoever for any direct or consequential loss arising from any use of this report or its contents.
These reports are provided to you for informational purposes only. This report is not, and is not constructed as, an offer to sell or solicitation of any offer to buy any financial instrument, nor shall this report be construed as an opinion as to whether you should enter into any swap or trading strategy involving a swap or any other transaction. The information contained in this report is not intended to be, and does not constitute, a recommendation of a swap or trading strategy involving a swap within the meaning of U.S. Commodity Futures Trading Commission Regulation 23.434 and Appendix A thereto. This material is not intended to be individually tailored to your needs or characteristics and should not be viewed as a “call to action” or suggestion that you enter into a swap or trading strategy involving a swap or any other transaction. Scotiabank may engage in transactions in a manner inconsistent with the views discussed this report and may have positions, or be in the process of acquiring or disposing of positions, referred to in this report.
Scotiabank, its affiliates and any of their respective officers, directors and employees may from time to time take positions in currencies, act as managers, co-managers or underwriters of a public offering or act as principals or agents, deal in, own or act as market makers or advisors, brokers or commercial and/or investment bankers in relation to securities or related derivatives. As a result of these actions, Scotiabank may receive remuneration. All Scotiabank products and services are subject to the terms of applicable agreements and local regulations. Officers, directors and employees of Scotiabank and its affiliates may serve as directors of corporations.
Any securities discussed in this report may not be suitable for all investors. Scotiabank recommends that investors independently evaluate any issuer and security discussed in this report, and consult with any advisors they deem necessary prior to making any investment.
This report and all information, opinions and conclusions contained in it are protected by copyright. This information may not be reproduced without the prior express written consent of Scotiabank.
™ Trademark of The Bank of Nova Scotia. Used under license, where applicable.
Scotiabank, together with “Global Banking and Markets”, is a marketing name for the global corporate and investment banking and capital markets businesses of The Bank of Nova Scotia and certain of its affiliates in the countries where they operate, including; Scotiabank Europe plc; Scotiabank (Ireland) Designated Activity Company; Scotiabank Inverlat S.A., Institución de Banca Múltiple, Grupo Financiero Scotiabank Inverlat, Scotia Inverlat Casa de Bolsa, S.A. de C.V., Grupo Financiero Scotiabank Inverlat, Scotia Inverlat Derivados S.A. de C.V. – all members of the Scotiabank group and authorized users of the Scotiabank mark. The Bank of Nova Scotia is incorporated in Canada with limited liability and is authorised and regulated by the Office of the Superintendent of Financial Institutions Canada. The Bank of Nova Scotia is authorized by the UK Prudential Regulation Authority and is subject to regulation by the UK Financial Conduct Authority and limited regulation by the UK Prudential Regulation Authority. Details about the extent of The Bank of Nova Scotia's regulation by the UK Prudential Regulation Authority are available from us on request. Scotiabank Europe plc is authorized by the UK Prudential Regulation Authority and regulated by the UK Financial Conduct Authority and the UK Prudential Regulation Authority.
Scotiabank Inverlat, S.A., Scotia Inverlat Casa de Bolsa, S.A. de C.V, Grupo Financiero Scotiabank Inverlat, and Scotia Inverlat Derivados, S.A. de C.V., are each authorized and regulated by the Mexican financial authorities.
Not all products and services are offered in all jurisdictions. Services described are available in jurisdictions where permitted by law.

