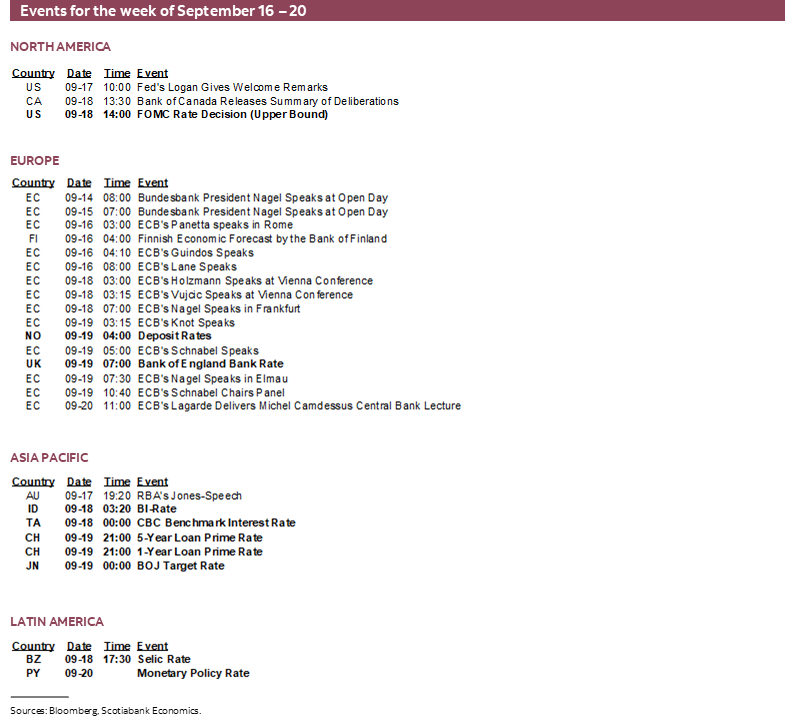
Next Week's Risk Dashboard
- A massive wave of global central bank decisions
- FOMC: Initial pace and forward guidance are both uncertain
- The cases for 25 or 50
- PBOC may join the Fed and ease policy
- BoJ unlikely to alter policy this week
- Bank of England likely to hold, ramp up QT
- Canadian CPI one of two updates before next BoC
- Canadian political risk escalates this week
- A heavy week for BoC-speak
- Norges Bank to hold, refresh forward guidance
- Brazil’s possible hike is the worst nightmare of global central bankers
- Bank Indonesia inching toward easing?
- SARB to commence easing cycle
- CBCT to hold again
- Turkey’s central bank to hang tight at eye watering levels
- Global macro indicators
Chart of the Week
A packed week that is sure to trigger substantial global market volatility lies ahead. A major wave of global central bank decisions will be led by the Federal Reserve, the Bank of Japan, the PBOC, the Bank of England but accompanied by a multitude of regional central banks. Several forms of Canadian political risk return this week alongside a potentially crippling airline strike, a CPI update and a wave of BoC-speak. Global macro reports will focus on US, Canadian and UK consumers, Aussie jobs, UK inflation and the shrinking kiwi economy.
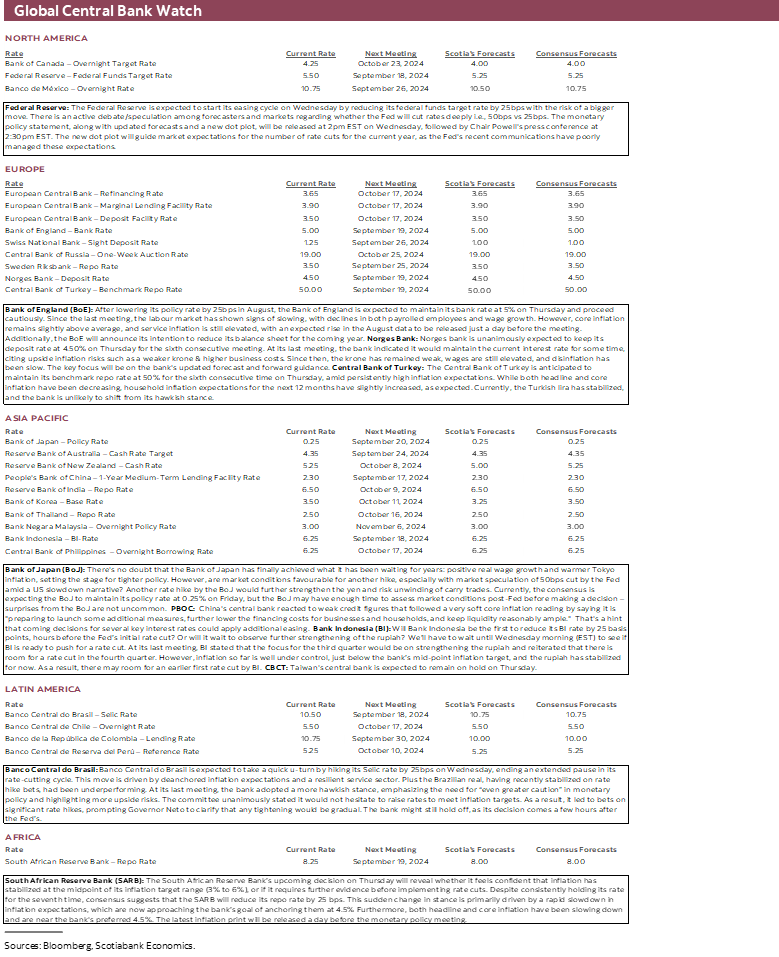
FEDERAL RESERVE—25 OR 50? AND THEN WHAT?
A seminal moment will arrive on Wednesday when the FOMC sets upon a course of easing monetary policy after the biggest inflation surge since the 1970s and the worst health crisis since the Spanish flu. This should be point of welcome relief to celebrate and it is, in part. What unfortunately mars the occasion is that the FOMC is communicating rather poorly with markets in a way that is driving elevated market volatility around size and pace issues.
The statement and Summary of Economic Projections that includes updated macro forecasts and the so-called ‘dot plot’ of Committee members’ policy rate views arrives at 2pmET. Chair Powell’s press conference follows thirty minutes later.
Our forecast is for a series of quarter-point cuts starting with this meeting, and then again in November and December with the Fed funds upper limit ending the year at 4.75%. We’ve pencilled in an extremely tentative 3½% end point for next year that would remain restrictive, but the confidence bands around that are rather wide concerning the guesswork around the macro and political outlooks.
Two key issues include the size of the first move and the path forward that the Committee wishes to communicate.
Gauging the Size of the First Move
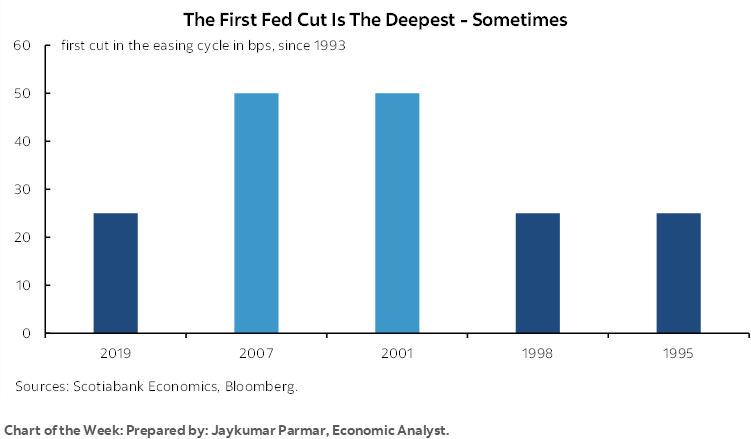
While the first cut is expected to be a 25bps move, I’ve outlined points for such a move and a bigger one. Historical precedence for the size of the first move in a cutting cycle is mixed and dependent upon unique circumstances at each of these times (chart 1).
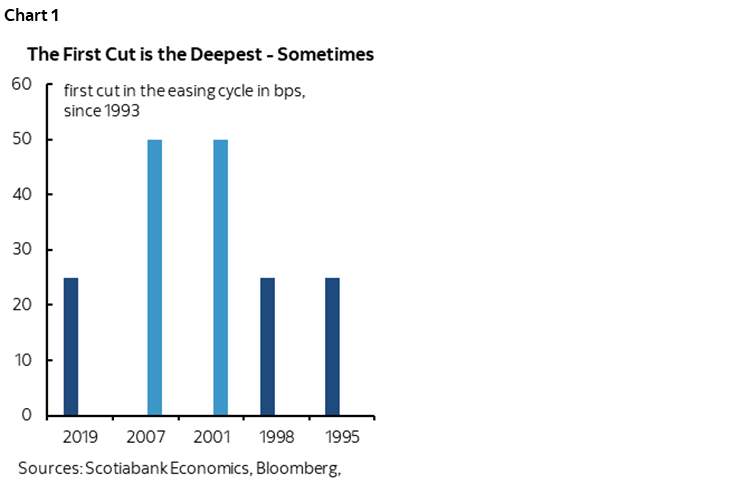
Clearly the FOMC has not done a good job at managing market expectations given the wild volatility in contract pricing for this upcoming meeting (chart 2).
Why have they been unclear about their intentions?
- They collectively simply may not know what to do and need the full meeting’s discussion to arrive at a conclusion. That’s fair.
- There may be significant divisions among members and concern about potential dissenters such that there is not clear support for reflecting a central position in advance.
- The era of hand holding may be over. Perhaps the FOMC thinks that the costs to surprising markets during a history-busting pandemic were greater than the risk of surprising them now.
- They want to see where markets land on their own until the last possible minute.
Some of these issues may clear up as individual Committee participants submit their projections on Friday as this publication is being distributed. They can still adjust later and apparently right into the morning on game day, but once everyone’s cards are on the table it could free up the possibility to communicate intentions to markets in clandestine ways at the start of the week.
A Case for 50bps:
- Some FOMC members felt there was a case for cutting in July. They may now view that as a missed opportunity given developments since then. Recall the minutes to the July meeting that said “All participants” support holding, “although several participants” felt that recent data “had provided a plausible case for reducing the target range 25 basis points at this meeting or that they could have supported such a decision.”
- Dual mandate data since the July 31st decision has been incrementally dovish. Nonfarm payrolls were revised lower, though debatably so (here). Nonfarm payrolls were up by only 89k in July and 142k in August. Core inflation has been a little mixed but still trending softer.
- It may be notable—at least to the point of publishing this article—that there has been no clear effort by the Federal Reserve to communicate a bias against going 50bps through preferred media outlets.
- Some believe that the Federal Reserve is behind the easing cycle. We don’t think so, or at least not materially so.
- There may be a desire to front-load policy easing. Governor Waller, for example, recently stated “I will be an advocate of front-loading rate cuts if that is appropriate.” Note the out he left himself.
- The real policy rate is tightening fairly rapidly as inflation falls. Of course, this argument relies on backward looking progress on inflation as opposed to expectations. If expectations are used, then it still rests on the assumption that Fed can forecast inflation going forward and that the real rate doesn’t loosen again should inflation risk be resurrected. The Fed’s track record at inflation forecasting leaves much to be desired.
- Some Fed-speak has sounded open-minded toward size and pace which I’ll come back to as I think this applied more to later moves than the imminent decision.
- Chair Powell has signalled more concern about the labour market outlook and said the Fed would do “everything we can to support a strong labour market as we make further progress towards price stability.”
A Case for 25 bps:
- Central banks including the Fed have preached the mantra that the path down—when it arrives—wouldn’t be the same as the path upward. This means that the big hikes wouldn’t be followed by out-sized cuts and hence the paths up and down would not be symmetrical to one another. The Fed’s forward guidance has performed poorly over the years and violating current guidance would do nothing to improve upon it.
- There are no exigent circumstances that would merit big cuts. Financial markets are functioning well, and the economy is resilient.
- On the economy, GDP grew by 3% in Q2 and Q2 ‘nowcast’ efforts by the Atlanta Federal Reserve and New York Federal Reserve both rest around 2½% q/q SAAR for Q3. The soft landing we’ve always expected continues to unfold.
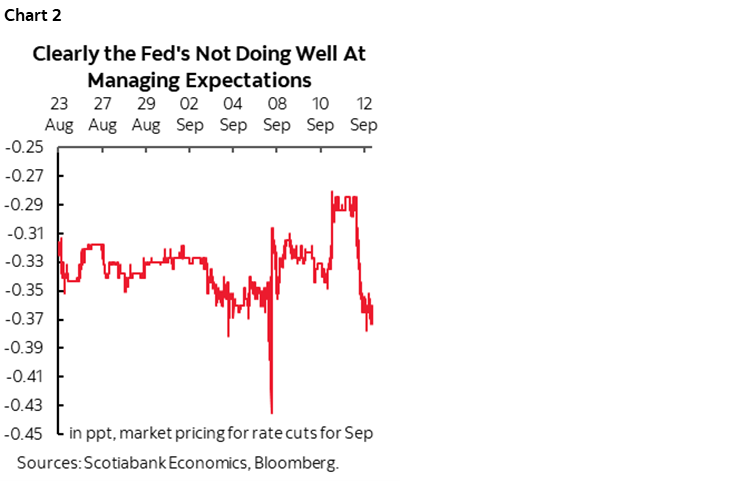
- The consumer sector continues to power forward and is not screaming out for policy easing (chart 3).
- Past episodes of larger first-cuts made more sense than now. For example, starting bigger into the GFC made sense. Perhaps likewise for 2001 around the dot-com period.
- Up-sizing cuts could send a negative signalling effect by way of saying to markets that the Fed sees something it’s really worried about in order to merit picking up the pace.
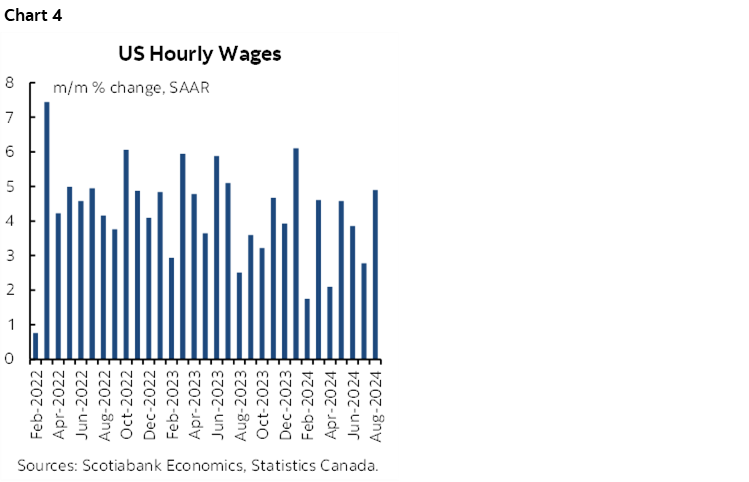
- Wage growth remains strong, real wages especially (chart 4).
- The economy remains sound to date.
- The job market has slowed but is not tanking.
- SA factors may be distorting CPI and nonfarm so be careful.
- Up-sizing cuts could be treated as a case to raise inflation forecasts over 2025–26 and potentially introduce erratic monetary policy.
- Some think that the politics of upsizing before an election may be dicey, but I think if the Fed lays out a strong case for doing so then it should let the chips land where they may.
- There is high uncertainty toward US fiscal and trade policy following the US election and that merits going slowly in terms of the broader policy mix and how it could impact inflation and jobs. For instance, both candidates advocate restrictive trade policy, though Trump much more so, and both candidates have leaned toward expansionary fiscal policies.
- Cut 25bps now and the Fed may have a better chance at managing markets. Cutting 50bps now may see markets deliver a gotcha moment and go on to treat it as precedent setting. They could price future large moves that could push the Fed faster than it wishes to go.
- Cutting 25bps would pose less uncertainty to the carry trade out of Japan on the eve of the BoJ’s decision and guidance the next day than a bigger Fed cut would.
- There remains a solid case for ongoing upside risk to inflation. For one thing, the US economy remains in excess aggregate demand with a positive output gap.
- Going slow to start still retains optionality to accelerate size and pace later, but it would be far more damaging to go big at first and wind up regretting it.
The Path Forward
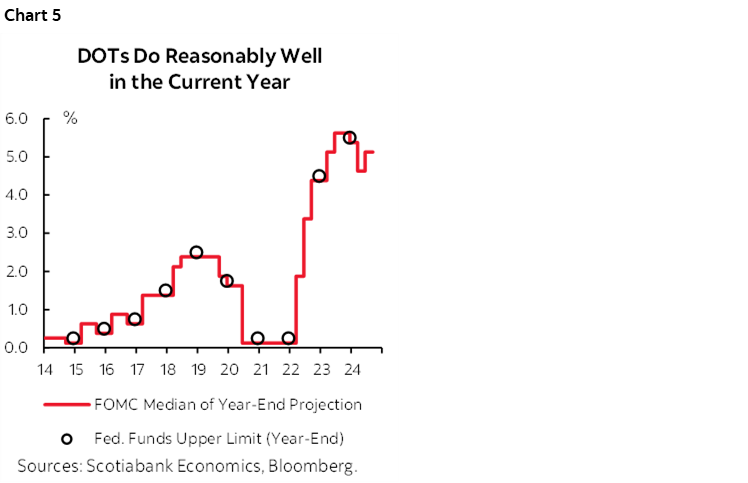
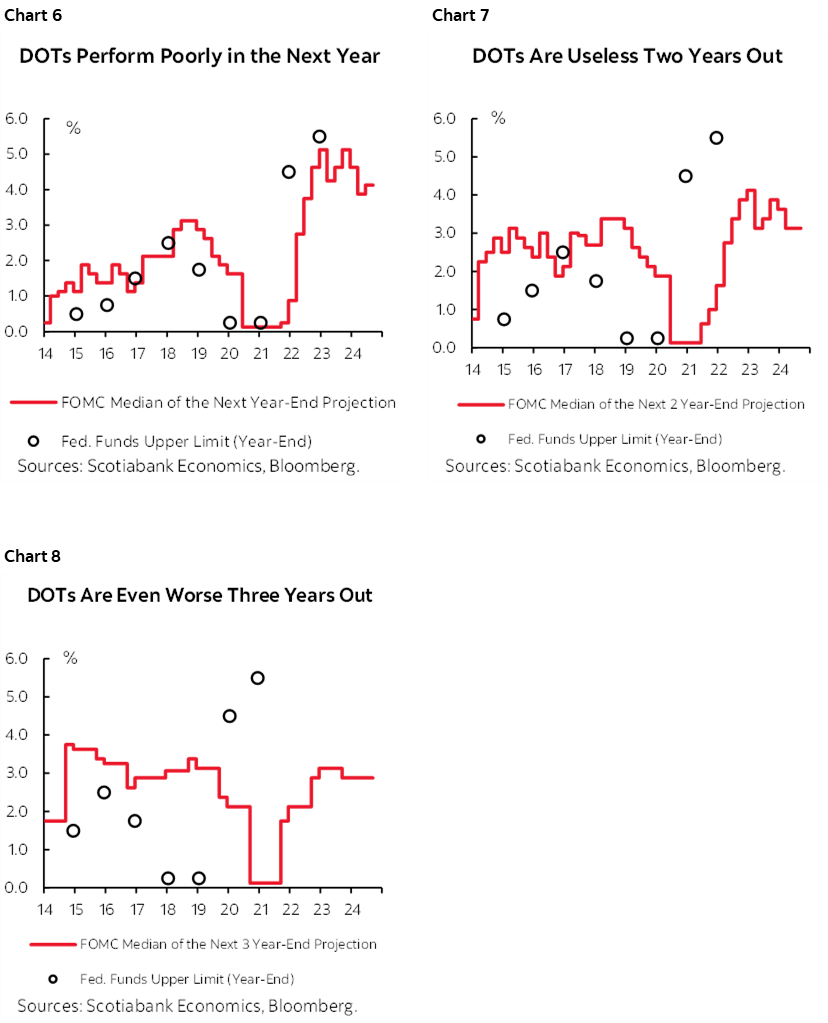
The dot plot matters in the near-term but not so much later. Chart 5 shows that the FOMC usually delivers what they say they will deliver in the current year when they publish the dots around this time. Charts 6–8, however, show that the dots perform poorly later on compared to what the Fed actually winds up doing.
In any event, while it is a Committee, it’s Chair Powell that matters more than the dots. His press conference will be closely monitored, and he has a tendency to diss the dots as guesswork. He’s not wrong in doing so.
Given that I think the case for starting conservatively is stronger than upsizing, I think that mentality may carry the day in terms of the cumulative easing that is shown for the end of 2024. There is likely to be much more dispersion across the dots than the June dot plot that showed a central tendency in favour of only one quarter-point cut this year (7 dots) with several others leaning toward 50bps (8) offset in the median calculation by four who clung to no change.
The data and developments since June don’t seem to merit a wild swing in the individual projections. 75bps of cumulative easing this year could be easily communicated but might modestly disappoint markets that are pricing 100–125bps of easing this year. The Committee shouldn’t feel as if they have to chase this market pricing and deliver on it; markets have massively messed up Fed bets at various points especially earlier this year.
CANADIAN INFLATION—AND MACKLEM’S REACTION
Canada refreshes CPI estimates for August on Tuesday. Not much will hang on this one reading from a Bank of Canada standpoint, though it may well impact market volatility. This is one of two inflation readings before the BoC’s next decision on October 23rd when they deliver fresh forecasts. There will be other data before then as well, like another round of job market figures.
Whatever the figures may reveal, there will be ample opportunity for Bank of Canada officials to react as we go from summertime famine to September feast in their communications. Governor Macklem will speak on Friday at 8:30amET at an NBER conference in Toronto on the economics of artificial intelligence (here). Senior Deputy Governor will speak on the same day as CPI in a fireside chat format in Toronto. Thursday brings out the Summary of Deliberations to the process leading up to the policy decision two weeks ago. The BoC’s external Deputy Governor Vincent speaks on Thursday in a session titled “Behind the Scenes: Monetary Policy Decisions.”
I’ve estimated a flat reading in month-over-month seasonally unadjusted terms that would mean a rise of 0.3% m/m SA. That translates into 2.1% y/y, down from 2.5% the prior month and down from a peak of 8.1% in June 2022. Traditional core CPI excluding food and energy prices is also estimated at 0% m/m NSA that could mean 0.2% m/m SA.
Canada, you’ve come a long way in the inflation fight baby, but these are not the relevant figures.
These figures don’t even matter to the inflation expectations market because, well, Canada’s market is weak. The federal government stopped issuing real return bonds in November 2022. The bonds are typically liquidity challenged because of the pounce and never sell approach by long-term institutional investors. Take market-derived measures of inflation expectations in Canada with a lot of salt.
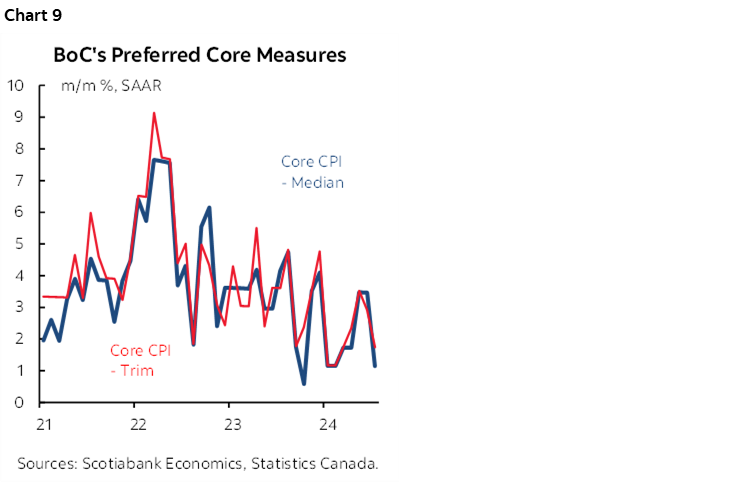
The figures that matter to the Bank of Canada and hence policy rate expectations are the ones that, quite honestly, no one is able to forecast. Trimmed mean and weighted median CPI are the key core inflation readings that are followed by the Bank of Canada. They matter in month-over-month seasonally adjusted terms at an annualized rate that help to evaluate underlying “core” price pressures at the margin and then look at a recent trend say by taking a three-month moving average. These measures have been volatile this year, with January through March running at a one-handled m/m SAAR pace before April to June accelerated and then July decelerated to 1.7% (chart 9).
There is no useful model for these measures given the high degree of statistical noise around short-term estimates. Only a small fraction of the dozens and dozens of prices that are needed to calculate these measures is available. And yet, measures like weighted median CPI that estimates inflation by using the weighted 50th percentile price in the entire basket are super sensitive to the exact distribution of prices that are mostly unknown. Trimmed mean faces a similar challenge in that it is sensitive to exactly what prices get removed from the top and bottom 20% of the basket and the weighted distribution of what’s left.
As for what we can track:
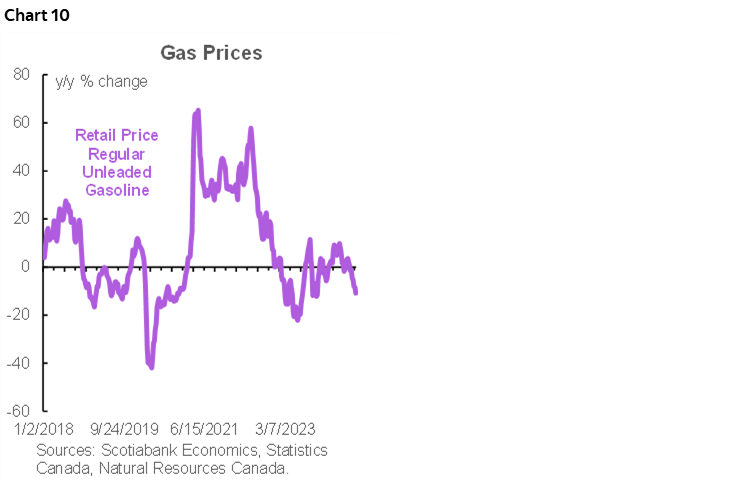
- Gasoline prices are estimated to drag less than a tenth off of m/m NSA CPI (chart 10);
- Food prices probably offered an immaterial weighted contribution to m/m CPI;
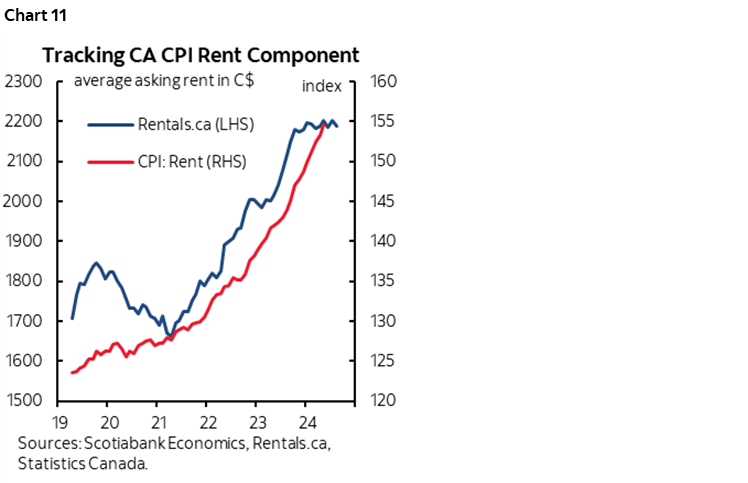
- Rent may cool again based on nationwide price indices that fell -0.6% m/m NSA (chart 11). A reduction in the international student population may be a contributing factor at the start of a new school year.
- The overall shelter category could also be soft because of housing’s replacement cost captured in the new house price index that is elevated but trending sideways to the latest reading in July.
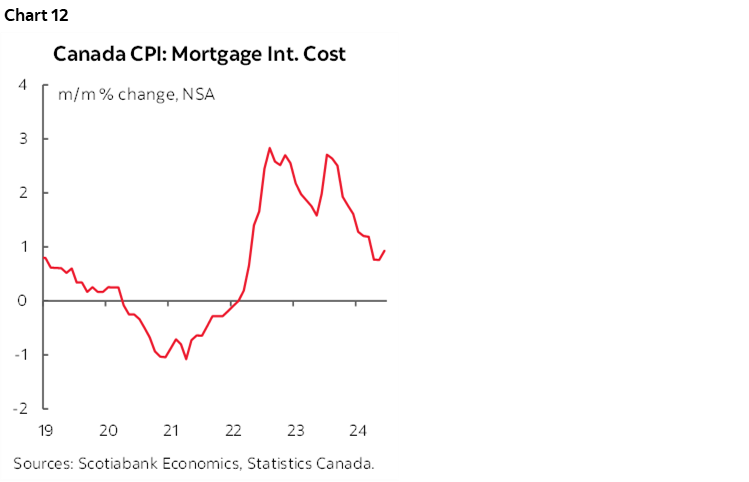
- mortgage interest cost has begun to edge lower in response to BoC rate cuts but carries a tiny weight in CPI and has never been included in the preferred core inflation readings (chart 12).
- I’m expecting the two-month SA decline in the recreation and education category to edge upward as the prior steep declines in travel tours ebbs.
Canada’s aborted rail strike may still impact prices because of advance preparations to curtail rail transport and the very short duration of the strike. Also watch for any potential effects of Statcan’s methodological changes to how it captures cellular service prices this time given that category’s rapid increase in seasonally adjusted month-ago terms.
CANADIAN POLITICAL RISK—LOW, NOT ZERO
This could be a significant week for Canadian political risk. I doubt it will trigger election risk, but it would be prudent to keep tabs on several developments.
Parliament reconvenes on Monday after the summer break and Conservative leader Pierre Poilievre has vowed to push for a non-confidence motion against the government. He is unlikely to garner support across the left wing NDP and Quebec-based BQ parties, but there is a twist to this expectation.
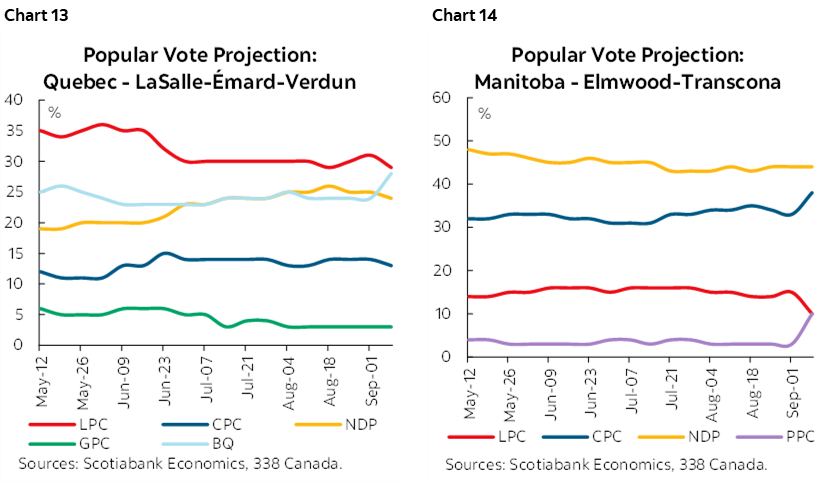
Two federal by-elections will be held on Monday in Manitoba and Quebec with polling shown in charts 13 and 14. The NDP is seeking to fend off the Conservatives and retain the one in Winnipeg. The Liberals are trying to hold off the NDP in Montreal. Surprises could motivate further dissent in any of the parties, but PM Trudeau may have the most at risk after losing a by-election at a Liberal stronghold in Toronto this summer.
The NDP caucus meeting will commence in Montreal on Tuesday after the by-election results are known and after withdrawing from the Supply and Confidence agreement that was supporting the Liberals. Disappointment in the two by-elections could strengthen pressure on the NDP Leader Singh while success could invigorate him against the other parties.
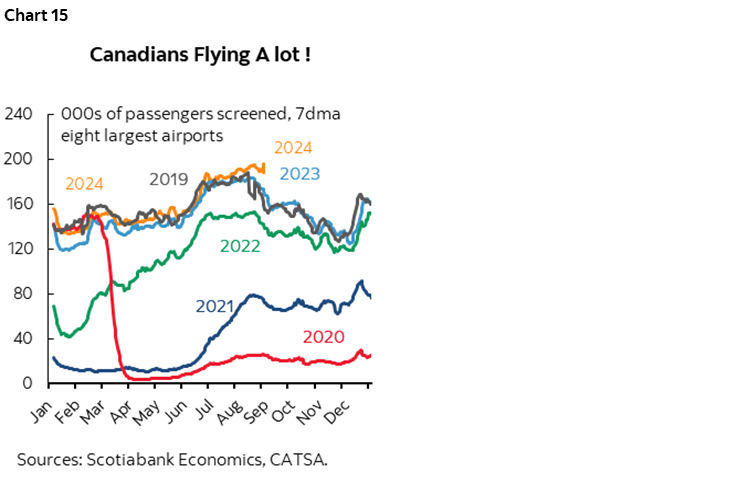
Throughout it all is the ongoing issue of labour turmoil in Canada. Last month’s rail strike ended with imposed arbitration. Air Canada—the country’s biggest airline—could face a pilot’s strike as soon as the start of the week. This could resurrect tensions between the political parties with the NDP strongly pro-union, the Liberals a little less so, and the Conservatives courting the union vote in an effort to split the left’s stranglehold on Canadian politics. The stakes to the economy are magnified by the fact that Canadian air travel going into the potential strikes is above pre-pandemic levels (chart 15).
BANK OF JAPAN—CARRY ON?
The Bank of Japan is not expected to alter policy at this week’s meeting. There remains risk nevertheless, as the BoJ has a tendency to surprise and Governor Ueda’s forward guidance may inform market expectations for subsequent meetings. Watch for the statement to land late Thursday evening in the eastern time zone, likely between 11pmET and midnight, before Governor Ueda’s press conference starts probably some time between 2–3amET.
Consensus unanimously expects no change to the target rate of 0.25% at this meeting. Markets are in agreement with OIS pricing modest but rising odds of a rate hike over subsequent meetings.
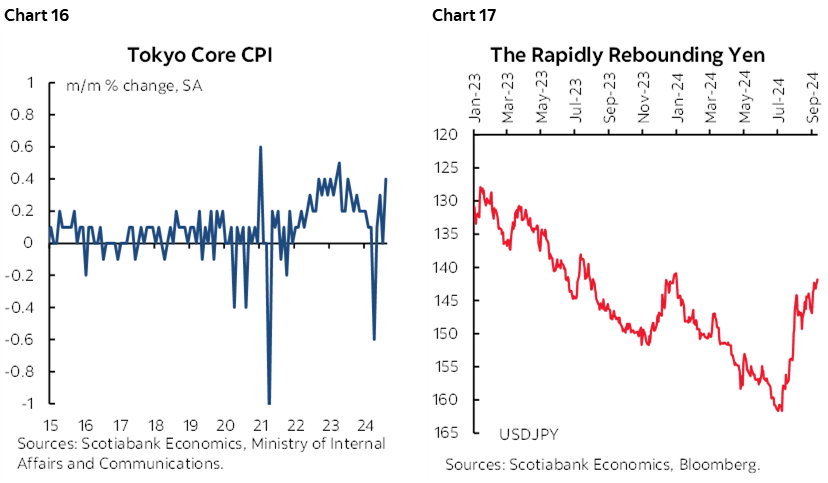
Key may be whether Ueda is grilled about the path forward after BoJ member Naoki Tamura guided that he thinks the BoJ should raise from 0.25% now to 1% by the second half of the next fiscal year (ie: October 1st 2024 to March 31st 2025). Rebounding Tokyo core CPI could support a hawkish bias (chart 16), although the rapid appreciation of the yen is key to lagging inflation pass through effects in Japan (chart 17).
For now, there does not appear to be a rush to alter policy versus evaluating the lagging effects of the modest 15bps of hikes since March, further data, the Federal Reserve’s policy path, and how the carry trade’s influences upon market stability evolve.
BANK OF ENGLAND—CUT QT, PROBABLY NOT BANK RATE
Here comes another central bank that is expected to do nothing but that has surprised in the past.
Thursday’s decision is expected to leave Bank Rate unchanged at 5% according to all voices within consensus. Markets also expect no change with only a handful of basis points of a cut priced.
There may be 1–2 dissenters on the MPC, but the consensus of MPC members is not signalling comfort toward proceeding with policy easing in a straight line, meeting-after-meeting, after having delivered the first cut at the last meeting in early August.
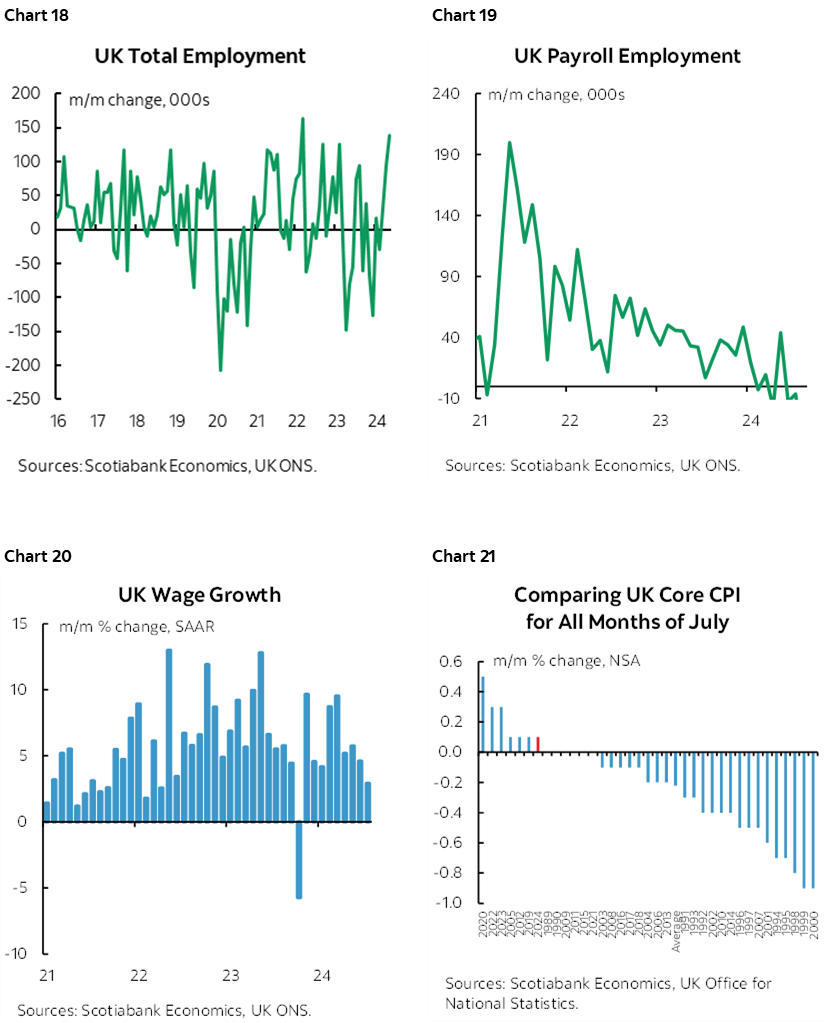
Data since that first cut has been mixed. Employment surged forward (chart 18), but probably due to smaller businesses as payroll employment languished (chart 19). Wage growth has been softening (chart 20). Core inflation is still overshooting like-months in history on a m/m seasonally unadjusted basis but with another update pending on Wednesday (chart 21).
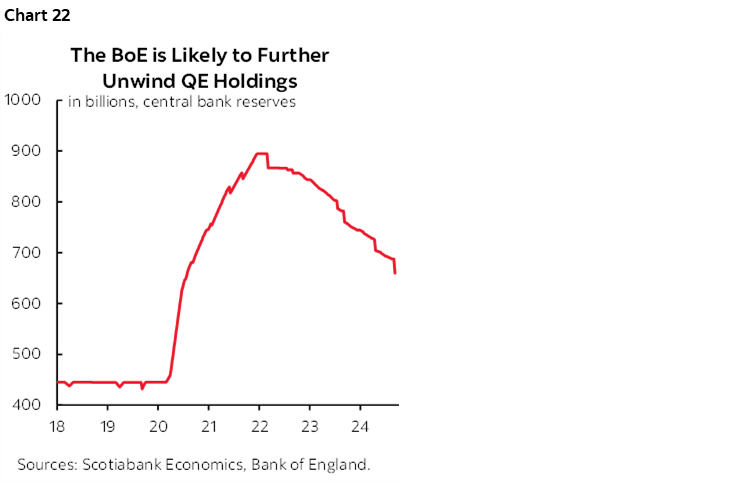
More important may be what decision is made regarding a further reduction in QE holdings at this meeting as the pace of unwinding has accelerated this year (chart 22).
PBOC—POLICY EASING AFOOT
China’s central bank may be in play. Various rate decisions lie ahead in the wake of freshened guidance from the People’s Bank of China.
The PBOC issued a statement after releasing credit and financing figures for the month of August that said it is “preparing to launch some additional measures, further lower the financing costs for businesses and households, and keep liquidity reasonably ample.
Enter coming rate refreshes. The Loan Prime Rates will be updated on Thursday including the 1-year that is presently at 3.35% and the 5-year LPR that is key to the property market and presently sits at 3.85%. They could be reduced by narrowing the spread over where the PBOC is attempting to steer market rates or reduced in concert with a cut to the 7-day reverse repo rate and possible ensuing cut to the 1-year Medium-Term Lending Facility Rate.
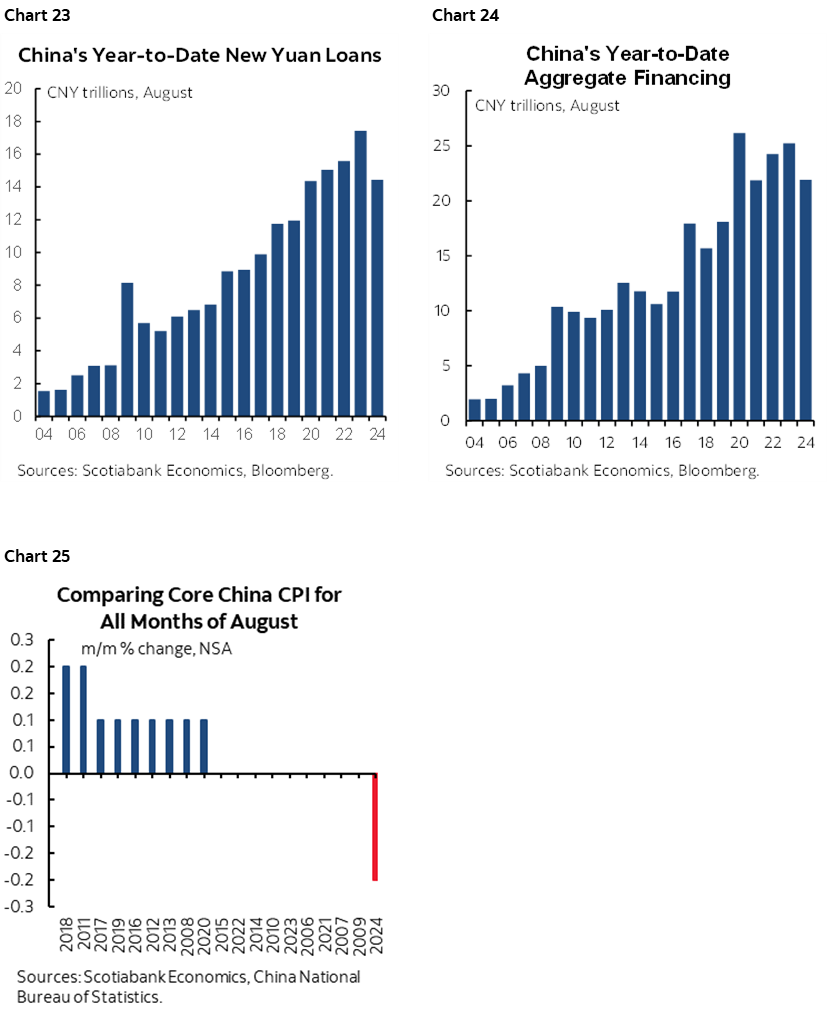
Weaker credit growth despite prior rate cuts and reductions in required reserve ratios (charts 23–24) and a sudden drop in core CPI (chart 25) may be spooking monetary authorities. Please see this past Monday’s Daily Points for a broader survey of the evidence on Chinese deflation (here).
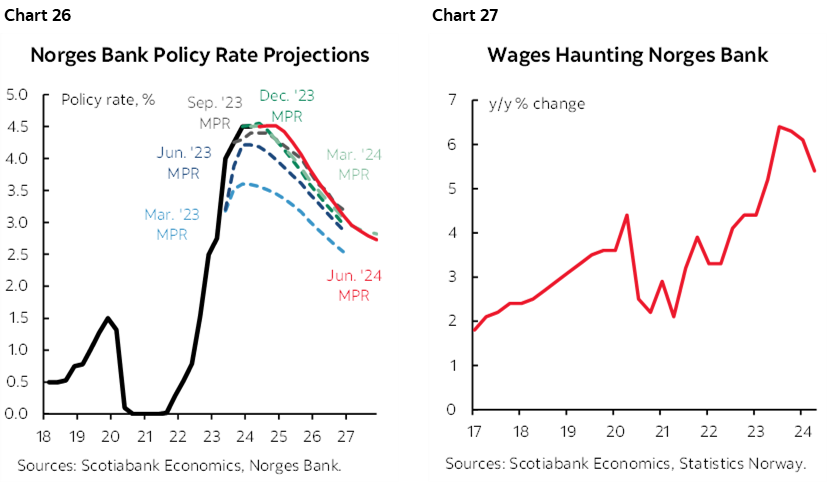
NORGES BANK—REFRESHED FORWARD GUIDANCE TO BE KEY
Norges Bank is expected to remain on hold at a deposit rate of 4.5% on Thursday.
Norges has yet to deliver policy easing and guided at its last decision on August 14th that “the policy rate will likely be kept at the current level for some time ahead.”
Fresh forecasts including explicit forward rate guidance will be offered with this meeting. The last set of forecasts in June indicated that a gradual path of reductions will begin to unfold in 2025, though markets are pushing for cuts beginning this December (chart 26). One consideration that may stymie such hopes is ongoing rapid wage growth (chart 27).
CENTRAL BANK OF BRAZIL—HIKE??
Banco Central do Brasil is expected to hike its Selic rate by 25bps on Wednesday. Yes hike. After cutting the rate seven times since August 2023 from 13.75% down to 10.5%, BCB is faced with whipsawing borrowers in what amounts to the scenario most feared by central bankers. After easing, renewed pressures are inviting a reversal on the path to a new Governor—Gabriel Galípolo—taking over next year.
GDP growth recently surpassed expectations at 1.4% q/q SA non-annualized in Q2. Inflation is holding at 4¼% y/y with trimmed mean at 4.4%. Inflation expectations have been creeping higher again (chart 28). The real has been on a depreciating trend to the USD for much of this year and particularly since May (chart 29).
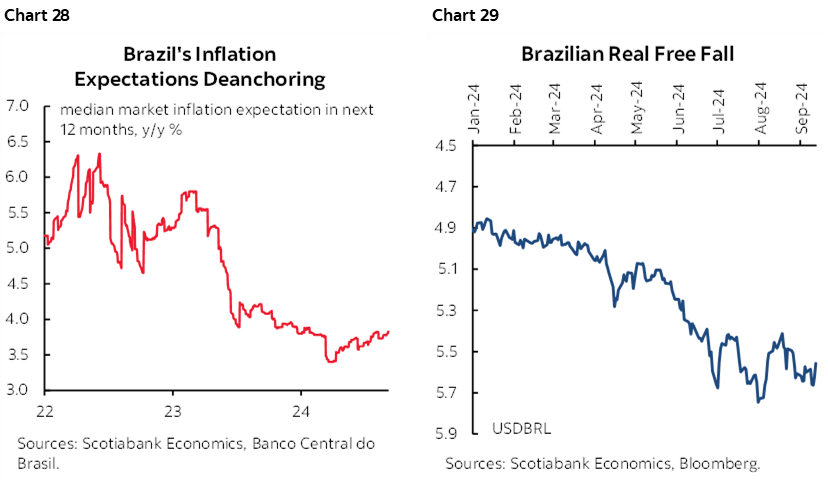
Since the decision lands Wednesday after the Federal Reserve’s communications it may still be possible to hold off on a hike depending upon what the Fed does and its effects on currencies and markets.
BANK INDONESIA—TEEING UP CUTS?
Most expect Bank Indonesia to hold its policy rate at 6.25% on Wednesday but a significant minority thinks it may cut.
At its last decision on August 21st, Governor Perry Warjiyo indicated that there cut be policy easing into the end of 2024 while “in the third quarter, our focus is to further strengthen the stability of the rupiah.” The rupiah has appreciated to the USD since that decision (chart 30), but depreciated to the yen and some other Asian crosses.
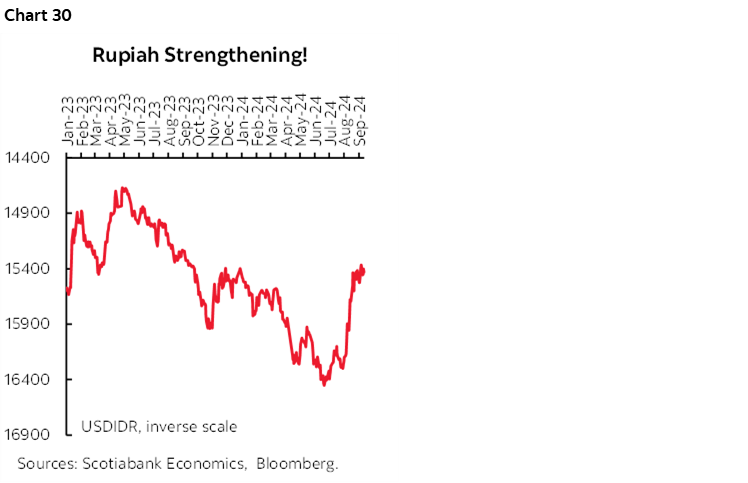
Bank Indonesia may not wish to cut as soon as this meeting partly on that prior guidance, but also because they deliver the decision just hours before the Federal Reserve’s communications. The rupiah may be destabilized should the Fed guide less policy easing than is priced.
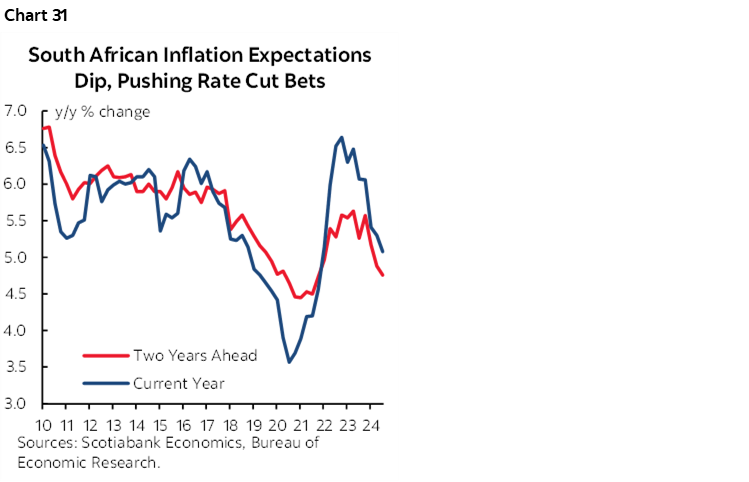
SARB—INFLATION GIVES GREEN LIGHT TO CUT
The South African Reserve Bank is widely expected to cut its repo rate by 25bps on Thursday, one day after the Fed.
Inflation at 4.6% y/y in July ebbed to 4.6% y/y with core at 4.3% ahead of Wednesday’s update for August. That has gotten comfortably inside SARB’s 3–6% inflation target range. Inflation expectations are also falling (chart 31).
CBCT—ANOTHER HOLD
Central bank of China Taiwan (CBCT) is widely expected to leave its benchmark rate unchanged at 2% on Thursday and with a relatively neutral policy bias. It has been on hold since having hiked back in March. Inflation is running at 2.4% y/y with core at 1.8% which is comfortably near the 2% inflation target. Watch for spillover effects of the week’s decisions by the Federal Reserve, BoJ and PBOC.
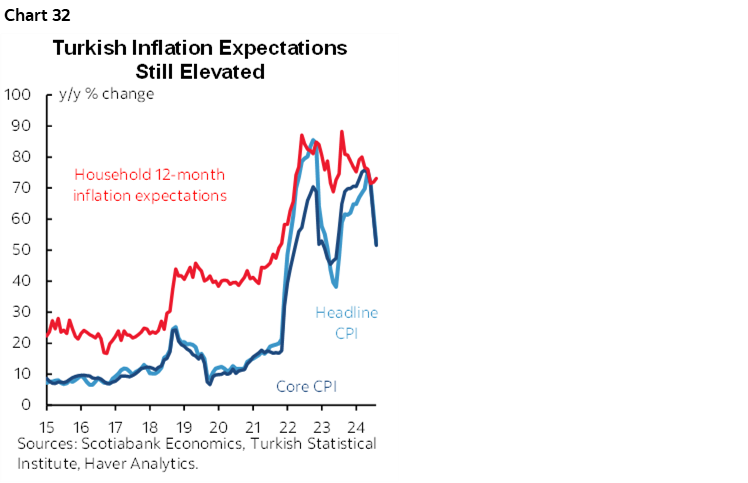
CENTRAL BANK OF TURKEY— EYE WATERING RESTRICTIVENESS
No change is expected when the Central Bank of Turkey refreshes its 50% one-week repo rate on Thursday. Restrictive policy continues to be supported by high inflation and inflation expectations (chart 32).
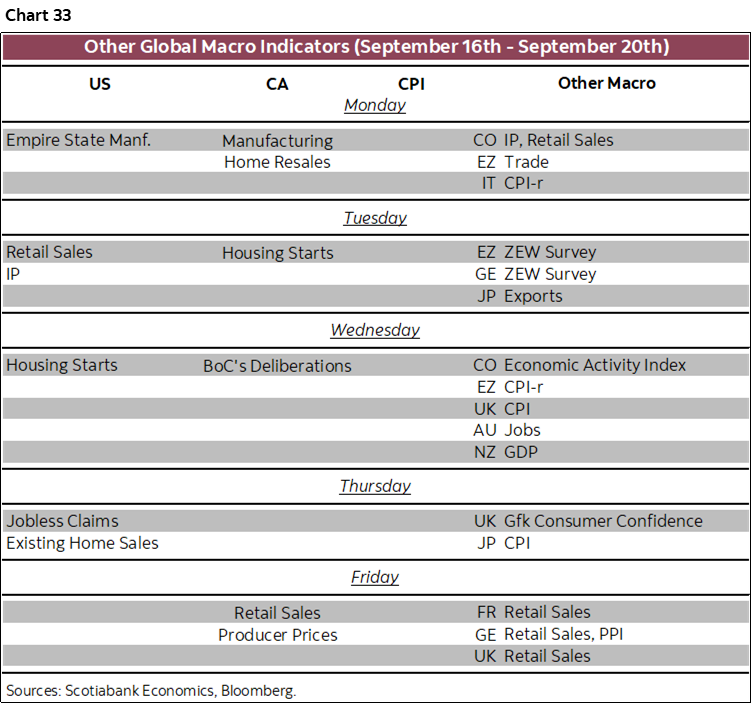
GLOBAL MACRO—DATA TO PLAY SECOND FIDDLE TO CENTRAL BANKS
Chart 33 highlights the week’s main indicators, though clearly the week’s main focal points will be upon the numerous central bank decisions which risks data getting lost in the fray.
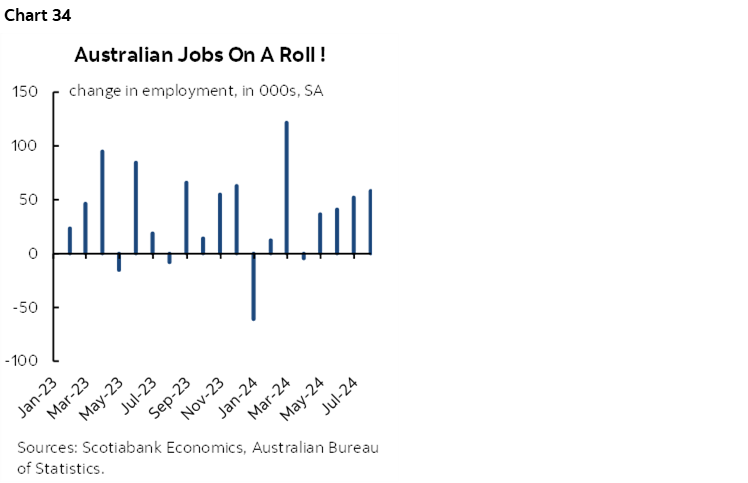
Some exceptions to this could include a spin of the wheel at what Australia’s jobs juggernaut might spit out on Wednesday night (ET) after a 58k jump entirely in full-time jobs the prior month that built upon the recent trend (chart 34).
Canada updates retail sales for July and August on Friday. July’s preliminary guidance pointed to an increase of 0.6% m/m SA and revisions in either direction are not uncommon. The first estimate for August will further inform consumer momentum, bearing in mind that Canadian retail sales exclude all services spending. Canada also updates manufacturing, existing home sales, housing starts and producer prices over the week.
The US updates retail sales on Tuesday. A dip in auto sales and soft gasoline prices are expected to drive a weak outcome, but core sales excluding autos and gas will be the new information. Also watch for updates on the Empire manufacturing survey, industrial output, housing starts, weekly jobless claims and existing home sales throughout the week.
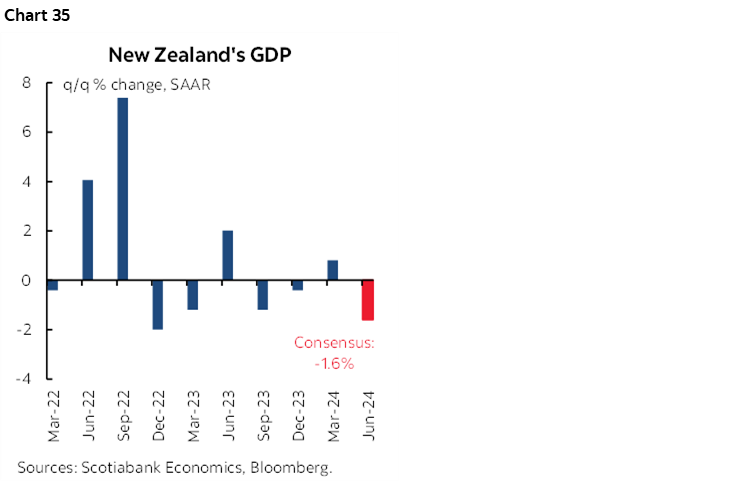
New Zealand’s economy is expected to shrink again when Q2 GDP figures land on Wednesday. If so, then this would be the third retreat in the past four quarters and fifth in seven quarters (chart 35). Weakness drove the RBNZ to commence cutting its policy rate last month and markets are pricing over 75bps of further easing over the two remaining meetings this year including the next one on October 9th.
European markets will be principally focused on the BoE and UK CPI plus external developments amid light domestic data. UK retail sales are expected to post another gain on Friday after the BoE’s decision the day before.
DISCLAIMER
This report has been prepared by Scotiabank Economics as a resource for the clients of Scotiabank. Opinions, estimates and projections contained herein are our own as of the date hereof and are subject to change without notice. The information and opinions contained herein have been compiled or arrived at from sources believed reliable but no representation or warranty, express or implied, is made as to their accuracy or completeness. Neither Scotiabank nor any of its officers, directors, partners, employees or affiliates accepts any liability whatsoever for any direct or consequential loss arising from any use of this report or its contents.
These reports are provided to you for informational purposes only. This report is not, and is not constructed as, an offer to sell or solicitation of any offer to buy any financial instrument, nor shall this report be construed as an opinion as to whether you should enter into any swap or trading strategy involving a swap or any other transaction. The information contained in this report is not intended to be, and does not constitute, a recommendation of a swap or trading strategy involving a swap within the meaning of U.S. Commodity Futures Trading Commission Regulation 23.434 and Appendix A thereto. This material is not intended to be individually tailored to your needs or characteristics and should not be viewed as a “call to action” or suggestion that you enter into a swap or trading strategy involving a swap or any other transaction. Scotiabank may engage in transactions in a manner inconsistent with the views discussed this report and may have positions, or be in the process of acquiring or disposing of positions, referred to in this report.
Scotiabank, its affiliates and any of their respective officers, directors and employees may from time to time take positions in currencies, act as managers, co-managers or underwriters of a public offering or act as principals or agents, deal in, own or act as market makers or advisors, brokers or commercial and/or investment bankers in relation to securities or related derivatives. As a result of these actions, Scotiabank may receive remuneration. All Scotiabank products and services are subject to the terms of applicable agreements and local regulations. Officers, directors and employees of Scotiabank and its affiliates may serve as directors of corporations.
Any securities discussed in this report may not be suitable for all investors. Scotiabank recommends that investors independently evaluate any issuer and security discussed in this report, and consult with any advisors they deem necessary prior to making any investment.
This report and all information, opinions and conclusions contained in it are protected by copyright. This information may not be reproduced without the prior express written consent of Scotiabank.
™ Trademark of The Bank of Nova Scotia. Used under license, where applicable.
Scotiabank, together with “Global Banking and Markets”, is a marketing name for the global corporate and investment banking and capital markets businesses of The Bank of Nova Scotia and certain of its affiliates in the countries where they operate, including; Scotiabank Europe plc; Scotiabank (Ireland) Designated Activity Company; Scotiabank Inverlat S.A., Institución de Banca Múltiple, Grupo Financiero Scotiabank Inverlat, Scotia Inverlat Casa de Bolsa, S.A. de C.V., Grupo Financiero Scotiabank Inverlat, Scotia Inverlat Derivados S.A. de C.V. – all members of the Scotiabank group and authorized users of the Scotiabank mark. The Bank of Nova Scotia is incorporated in Canada with limited liability and is authorised and regulated by the Office of the Superintendent of Financial Institutions Canada. The Bank of Nova Scotia is authorized by the UK Prudential Regulation Authority and is subject to regulation by the UK Financial Conduct Authority and limited regulation by the UK Prudential Regulation Authority. Details about the extent of The Bank of Nova Scotia's regulation by the UK Prudential Regulation Authority are available from us on request. Scotiabank Europe plc is authorized by the UK Prudential Regulation Authority and regulated by the UK Financial Conduct Authority and the UK Prudential Regulation Authority.
Scotiabank Inverlat, S.A., Scotia Inverlat Casa de Bolsa, S.A. de C.V, Grupo Financiero Scotiabank Inverlat, and Scotia Inverlat Derivados, S.A. de C.V., are each authorized and regulated by the Mexican financial authorities.
Not all products and services are offered in all jurisdictions. Services described are available in jurisdictions where permitted by law.