CANADA HOUSING MARKET: STILL AT THE DOORSTEP OF A RECOVERY, BUT HESITANT TO KNOCK AT THE DOOR
SUMMARY
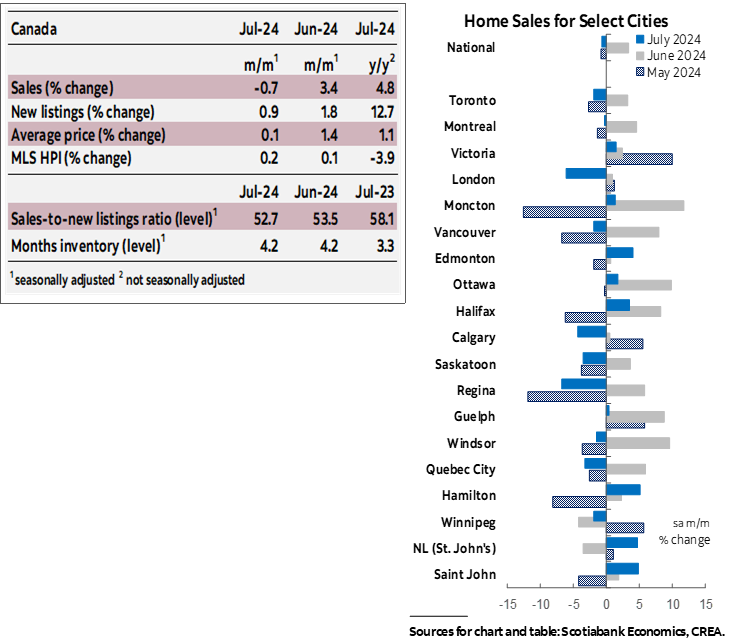
National housing resale conditions softened from June to July as reflected by the modest decline in the sales-to-new listings ratio. Over this period, national sales declined by 0.7% (sa m/m) while new listings increased 0.9%. In July, sales were higher by 4.8% (nsa) compared to the same month in 2023.
After increasing from May to June, the sales-to-new listings ratio—which reflects how tight resale conditions are—edged down to 52.7% from June to July, essentially back to its May level, and still within the range for balanced national resale market conditions (of between 45% to 65%).
Months of inventory remained unchanged over this period at 4.2, still below its long-term (pre-pandemic) average of 5.3. And since the national market aggregates very different regional markets, there are wide variations in terms of how this indicator compares to its long-term average across provinces, ranging from less than 2 weeks above average in Ontario and British Colombia and Ontario to 5.7 months below in New Brunswick.
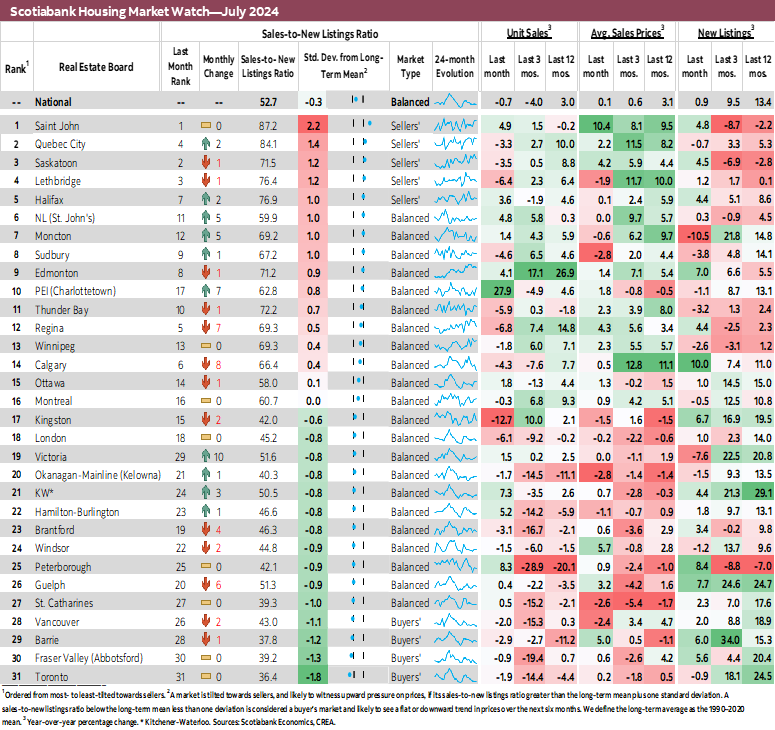
About 2/3 of the markets witnessed a decline in their sales-to-new listings ratio from June to July. Consequently, the number of sellers favouring markets declined from 10 in June to 5 in July while the number of balanced markets increased from 16 to 22.
Sales declined in over half of the markets we monitor from June to July. The largest decline was observed in Kingston at -12.7% (sa m/m), and the second largest in Regina at -6.8%, leading to a significant decline (by more than 8 percentage points) in their sales-to-new listings ratio. Sales increased in 14 markets, with the strongest rise for Charlottetown (PEI) at near 28%, and the second largest for Peterborough at 8.3%. As result of this strong monthly sales increase, the sales-to-new listings ratio in Charlottetown has risen by above 14 percentage points, from 48.6% in June to near 63% in July, approaching sellers favouring conditions.
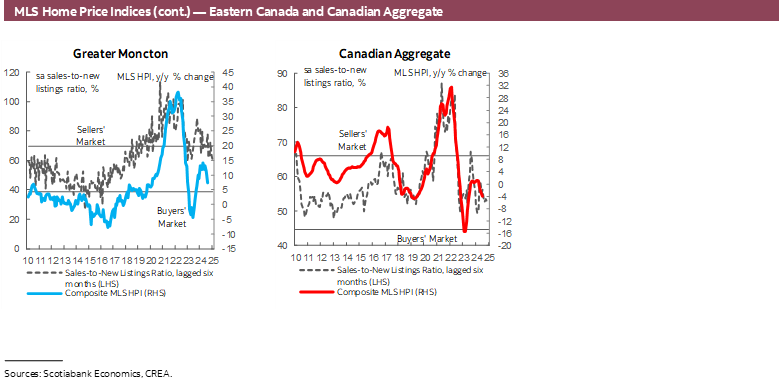
Newly listed properties increased in nearly 2/3 of the markets we track. The strongest monthly increases were observed for Calgary (10% sa mm) and Peterborough (8.4%). For the latter, this strong monthly rise in new listings was almost identical than for sales, which led its sales-to-new listings ratio to stay near its June level. Monthly declines were observed for 11 markets, with the strongest seen in Moncton (-10.5%).
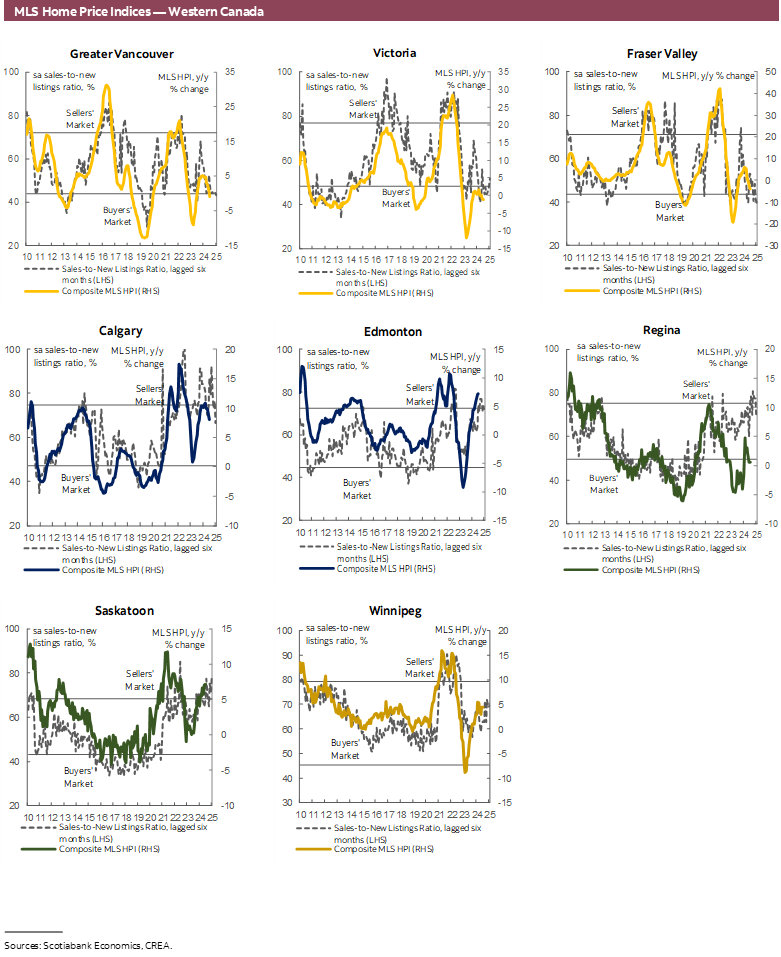
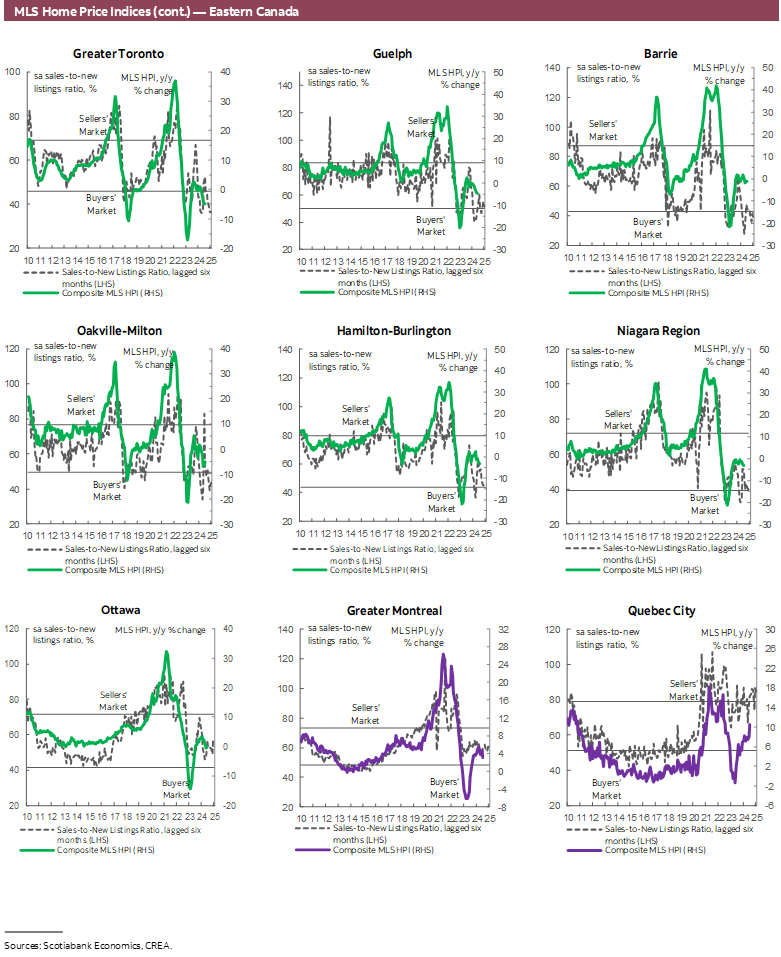
The MLS Home Price Index (HPI) increased by 0.2% nationally from June to July (sa m/m), but declined by 3.9% from July 2023 to July 2024 (using nsa figures). This house price index has been relatively stable since December of last year (using sa figures). From June to July of this year, the national MLS HPI index increased for most unit types except for townhouses which was unchanged. All unit types contributed to the decline in this house price index over the period July 2023 to July 2024.
IMPLICATIONS
We are still expecting a recovery in the resale market but the July figures suggest that buyers are still hesitant. This recovery should be helped by now clearer signs that the monetary policy interest rate is on a downward path, with the reductions announced by the Bank of Canada on June 5th and July 24th and the dovish tone of its recent communications. This is likely raising potential buyers’ confidence about future economic and income conditions. Nevertheless, buyers might still need more encouraging signs as the impact on home ownership affordability from expected weaker interest rates is modest given the elevated level for house prices. Buyers must weigh this hesitancy with the expected upward trend in house prices in the foreseeable future due to the (infamous) structural supply shortage. By itself, this expected trend house price increase is supporting demand and the resale market. Hence, we are probably still at the doorstep of this recovery, but too shy to knock at the door.
DISCLAIMER
This report has been prepared by Scotiabank Economics as a resource for the clients of Scotiabank. Opinions, estimates and projections contained herein are our own as of the date hereof and are subject to change without notice. The information and opinions contained herein have been compiled or arrived at from sources believed reliable but no representation or warranty, express or implied, is made as to their accuracy or completeness. Neither Scotiabank nor any of its officers, directors, partners, employees or affiliates accepts any liability whatsoever for any direct or consequential loss arising from any use of this report or its contents.
These reports are provided to you for informational purposes only. This report is not, and is not constructed as, an offer to sell or solicitation of any offer to buy any financial instrument, nor shall this report be construed as an opinion as to whether you should enter into any swap or trading strategy involving a swap or any other transaction. The information contained in this report is not intended to be, and does not constitute, a recommendation of a swap or trading strategy involving a swap within the meaning of U.S. Commodity Futures Trading Commission Regulation 23.434 and Appendix A thereto. This material is not intended to be individually tailored to your needs or characteristics and should not be viewed as a “call to action” or suggestion that you enter into a swap or trading strategy involving a swap or any other transaction. Scotiabank may engage in transactions in a manner inconsistent with the views discussed this report and may have positions, or be in the process of acquiring or disposing of positions, referred to in this report.
Scotiabank, its affiliates and any of their respective officers, directors and employees may from time to time take positions in currencies, act as managers, co-managers or underwriters of a public offering or act as principals or agents, deal in, own or act as market makers or advisors, brokers or commercial and/or investment bankers in relation to securities or related derivatives. As a result of these actions, Scotiabank may receive remuneration. All Scotiabank products and services are subject to the terms of applicable agreements and local regulations. Officers, directors and employees of Scotiabank and its affiliates may serve as directors of corporations.
Any securities discussed in this report may not be suitable for all investors. Scotiabank recommends that investors independently evaluate any issuer and security discussed in this report, and consult with any advisors they deem necessary prior to making any investment.
This report and all information, opinions and conclusions contained in it are protected by copyright. This information may not be reproduced without the prior express written consent of Scotiabank.
™ Trademark of The Bank of Nova Scotia. Used under license, where applicable.
Scotiabank, together with “Global Banking and Markets”, is a marketing name for the global corporate and investment banking and capital markets businesses of The Bank of Nova Scotia and certain of its affiliates in the countries where they operate, including; Scotiabank Europe plc; Scotiabank (Ireland) Designated Activity Company; Scotiabank Inverlat S.A., Institución de Banca Múltiple, Grupo Financiero Scotiabank Inverlat, Scotia Inverlat Casa de Bolsa, S.A. de C.V., Grupo Financiero Scotiabank Inverlat, Scotia Inverlat Derivados S.A. de C.V. – all members of the Scotiabank group and authorized users of the Scotiabank mark. The Bank of Nova Scotia is incorporated in Canada with limited liability and is authorised and regulated by the Office of the Superintendent of Financial Institutions Canada. The Bank of Nova Scotia is authorized by the UK Prudential Regulation Authority and is subject to regulation by the UK Financial Conduct Authority and limited regulation by the UK Prudential Regulation Authority. Details about the extent of The Bank of Nova Scotia's regulation by the UK Prudential Regulation Authority are available from us on request. Scotiabank Europe plc is authorized by the UK Prudential Regulation Authority and regulated by the UK Financial Conduct Authority and the UK Prudential Regulation Authority.
Scotiabank Inverlat, S.A., Scotia Inverlat Casa de Bolsa, S.A. de C.V, Grupo Financiero Scotiabank Inverlat, and Scotia Inverlat Derivados, S.A. de C.V., are each authorized and regulated by the Mexican financial authorities.
Not all products and services are offered in all jurisdictions. Services described are available in jurisdictions where permitted by law.