SALES SURGE DRAWS UNUSUAL YEAR TO A CLOSE
SUMMARY
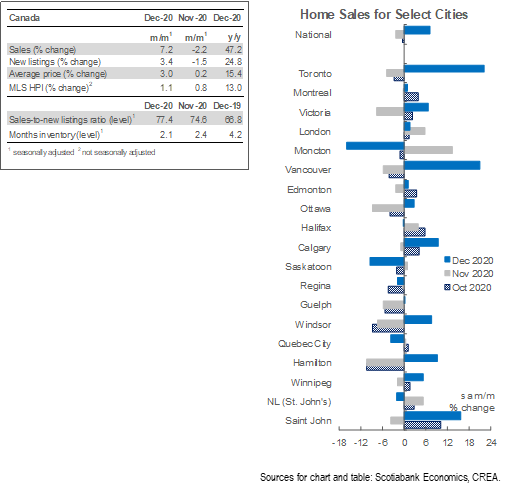
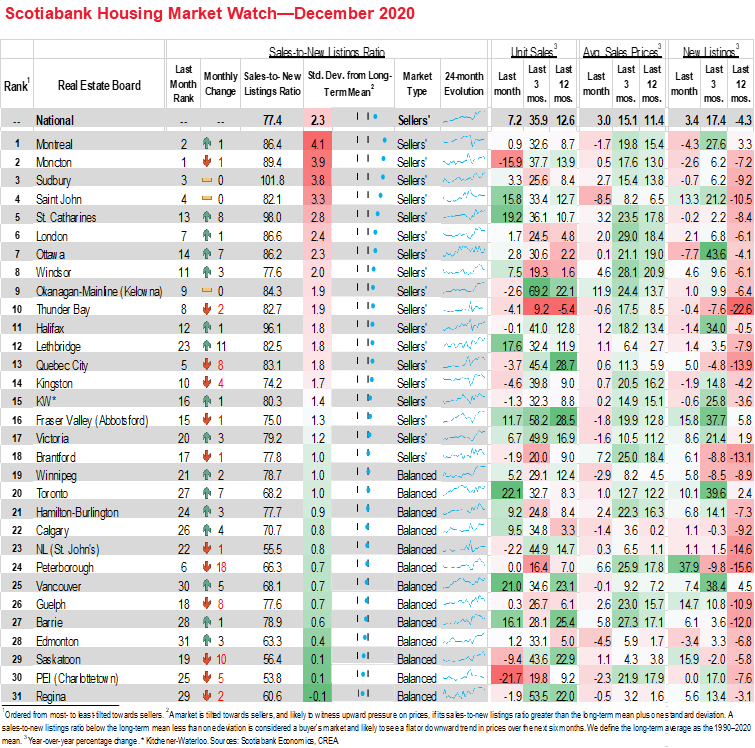
Canadian home sales rose by 7.2% (sa m/m) in December 2020 to set a new monthly record and complete an annual gain of 12.6%. That somewhat surprising climb—new measures to combat COVID-19’s second wave had come into effect across much of the country in December—brought to an end a string of two consecutive monthly decreases. As new listings increased by just 3.4% (sa m/m), the national-level sales-to-new listings ratio rose to 77.4%—the fourth-strongest reading on record. With supply-demand balances strongly in favour of sellers, the composite MLS Home Price Index (HPI) surged by 13% (nsa y/y)—the steepest rise since June 2017. Single-family homes continued to anchor price appreciation.
Sales gains were broad-based in December and for the year as a whole. Eighteen of the 31 local markets we monitor witnessed sales gains last month—with both Toronto and Vancouver seeing increases over 20% sa m/m. Thunder Bay stood out as the only one of our centres whose home purchases declined relative to 2019. As of December, Charlottetown was the only municipality whose sales had not returned to the level of February 2020—the last month before pandemic lockdowns took effect.
While new listings generally increased last month and have rebounded from early-year lockdowns, their recovery continued to lag that of sales. In December, 20 centres in our list experienced a rise in new listings, but only five centres saw gains over the course of 2020 and the 4.3% national-level annual decline was the steepest since the peak of the GFC in 2009. The relatively slow bounce-back among new listings contributed to 18 of our centres finishing 2020 in sellers’ market territory, which, all else equal, augurs for further price appreciation in the coming months.
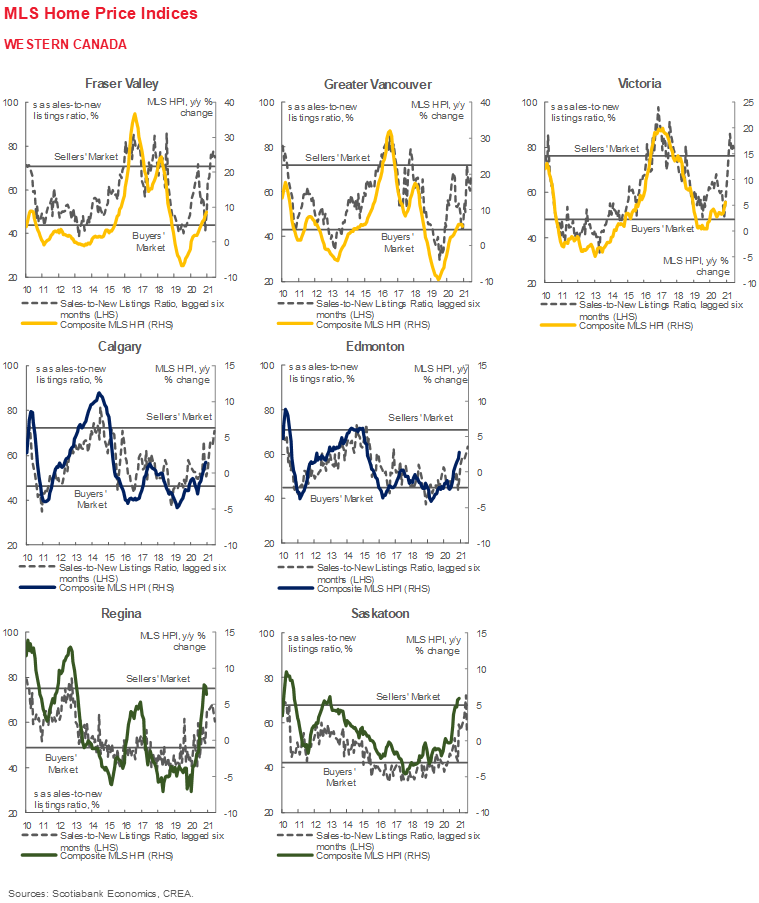
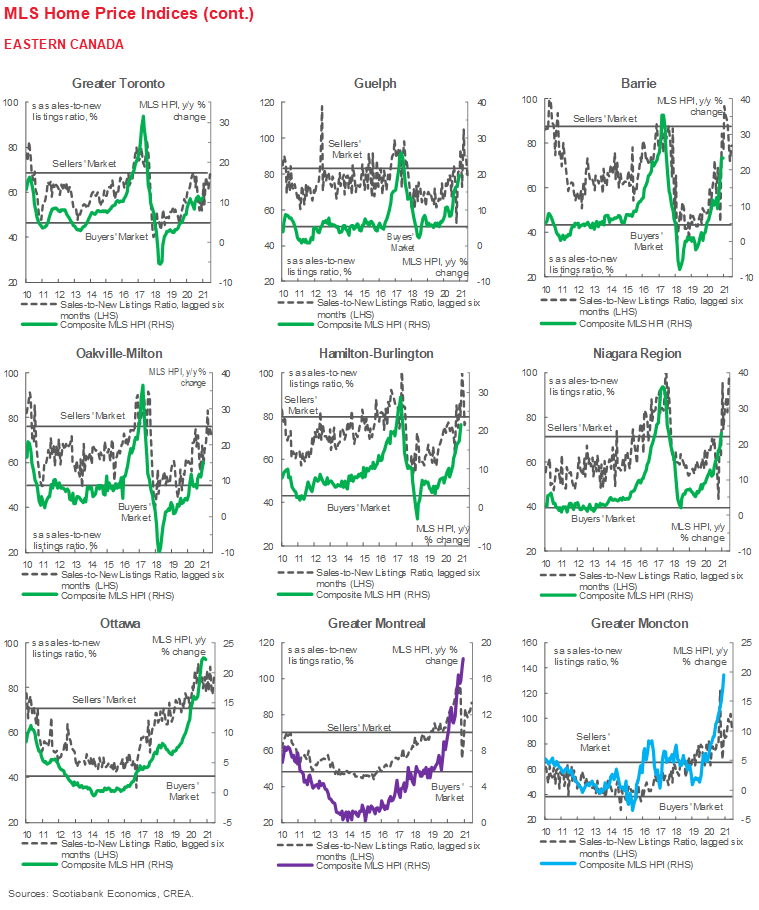
In Canada’s largest centres, single-family homes continued to propel price growth. Price gains for this unit type accelerated across Toronto, Montreal, Vancouver, Calgary, Edmonton, and Ottawa and far outpaced those of other dwelling categories; in most cities, the rate of expansion eased for apartments and townhomes. The composite MLS HPI for single-family homes advanced by 9.2% in 2020—not far off the 11–12% growth witnessed during 2016–17, just before the federal and provincial governments began to introduce measures to cool the pace of home price appreciation.
IMPLICATIONS
The December data cap off a remarkable year for Canadian housing markets. National-level sales and listings witnessed record plunges in excess of 50% (sa m/m) at the height of first wave lockdowns in April—on the heels of declines over 10% (sa m/m) in March as containment measures came into effect. At that time, we appeared headed for an unprecedented annual drop. Since then, a broad-based rally in real estate transactions activity has culminated in the strongest national-level annual percentage increase in home purchases since 2001! Twenty-five of the 31 cities we monitor witnessed annual sales gains in excess of 5%, and 28 recouped March–April losses in three or fewer months.
How should one interpret the robust second-half housing market recovery? The scale and speed of policy support during the COVID-19 economic downturn appears to have played a role. Tax and fee deferrals and hefty household transfers—the latter outpaced income losses at the height of the pandemic’s first wave—look to have cushioned the recession’s blow, with an assist from rock-bottom borrowing rates. Strong household formation vis-à-vis torrid population gains in most centres before COVID-19 may also have contributed to strong purchase volumes. Finally, containment measures’ disproportionate impact on lower-wage sectors likely had a less pronounced impact on housing demand than a broader-based recession would have, especially in centres with stretched pre-pandemic affordability.
Buyers continue to demonstrate a preference for more space as the pandemic rages. In most centres, MLS HPI gains continue to be anchored by larger, roomier, higher-cost single-family homes. Meanwhile, cheaper apartments and townhomes—which had driven much of the price growth in the pre-pandemic world of limited affordability—witnessed much more moderate gains. The Toronto Regional Real Estate Board—which released by-region sales figures earlier this month—is a case in point. The data continued to indicate strong sales growth in the regions surrounding the City of Toronto, while purchase volumes fell in the city itself last year. However, there is a question as to whether the current trend will persist after widespread vaccination.
With new restrictions now in place across the country to combat second waves, slowing real estate transactions and price gains may be in store in the next few months. Our economic outlook released this week incorporates more stringent lockdowns and diminished economic activity in the first half of this year, though we do not foresee a repeat of the cratered economic activity witnessed in the spring. The delay of some activity into H2-2021, when we had already expected widespread inoculation to lift economic growth, likely means stronger second-half activity than we previously anticipated. Rock-bottom interest rates, ongoing federal and provincial fiscal supports, and the current supply-demand tightness should also contribute to home price gains over the medium-term.
DISCLAIMER
This report has been prepared by Scotiabank Economics as a resource for the clients of Scotiabank. Opinions, estimates and projections contained herein are our own as of the date hereof and are subject to change without notice. The information and opinions contained herein have been compiled or arrived at from sources believed reliable but no representation or warranty, express or implied, is made as to their accuracy or completeness. Neither Scotiabank nor any of its officers, directors, partners, employees or affiliates accepts any liability whatsoever for any direct or consequential loss arising from any use of this report or its contents.
These reports are provided to you for informational purposes only. This report is not, and is not constructed as, an offer to sell or solicitation of any offer to buy any financial instrument, nor shall this report be construed as an opinion as to whether you should enter into any swap or trading strategy involving a swap or any other transaction. The information contained in this report is not intended to be, and does not constitute, a recommendation of a swap or trading strategy involving a swap within the meaning of U.S. Commodity Futures Trading Commission Regulation 23.434 and Appendix A thereto. This material is not intended to be individually tailored to your needs or characteristics and should not be viewed as a “call to action” or suggestion that you enter into a swap or trading strategy involving a swap or any other transaction. Scotiabank may engage in transactions in a manner inconsistent with the views discussed this report and may have positions, or be in the process of acquiring or disposing of positions, referred to in this report.
Scotiabank, its affiliates and any of their respective officers, directors and employees may from time to time take positions in currencies, act as managers, co-managers or underwriters of a public offering or act as principals or agents, deal in, own or act as market makers or advisors, brokers or commercial and/or investment bankers in relation to securities or related derivatives. As a result of these actions, Scotiabank may receive remuneration. All Scotiabank products and services are subject to the terms of applicable agreements and local regulations. Officers, directors and employees of Scotiabank and its affiliates may serve as directors of corporations.
Any securities discussed in this report may not be suitable for all investors. Scotiabank recommends that investors independently evaluate any issuer and security discussed in this report, and consult with any advisors they deem necessary prior to making any investment.
This report and all information, opinions and conclusions contained in it are protected by copyright. This information may not be reproduced without the prior express written consent of Scotiabank.
™ Trademark of The Bank of Nova Scotia. Used under license, where applicable.
Scotiabank, together with “Global Banking and Markets”, is a marketing name for the global corporate and investment banking and capital markets businesses of The Bank of Nova Scotia and certain of its affiliates in the countries where they operate, including; Scotiabank Europe plc; Scotiabank (Ireland) Designated Activity Company; Scotiabank Inverlat S.A., Institución de Banca Múltiple, Grupo Financiero Scotiabank Inverlat, Scotia Inverlat Casa de Bolsa, S.A. de C.V., Grupo Financiero Scotiabank Inverlat, Scotia Inverlat Derivados S.A. de C.V. – all members of the Scotiabank group and authorized users of the Scotiabank mark. The Bank of Nova Scotia is incorporated in Canada with limited liability and is authorised and regulated by the Office of the Superintendent of Financial Institutions Canada. The Bank of Nova Scotia is authorized by the UK Prudential Regulation Authority and is subject to regulation by the UK Financial Conduct Authority and limited regulation by the UK Prudential Regulation Authority. Details about the extent of The Bank of Nova Scotia's regulation by the UK Prudential Regulation Authority are available from us on request. Scotiabank Europe plc is authorized by the UK Prudential Regulation Authority and regulated by the UK Financial Conduct Authority and the UK Prudential Regulation Authority.
Scotiabank Inverlat, S.A., Scotia Inverlat Casa de Bolsa, S.A. de C.V, Grupo Financiero Scotiabank Inverlat, and Scotia Inverlat Derivados, S.A. de C.V., are each authorized and regulated by the Mexican financial authorities.
Not all products and services are offered in all jurisdictions. Services described are available in jurisdictions where permitted by law.