CANADA HOUSING MARKET: YEAR IN REVIEW
SUMMARY
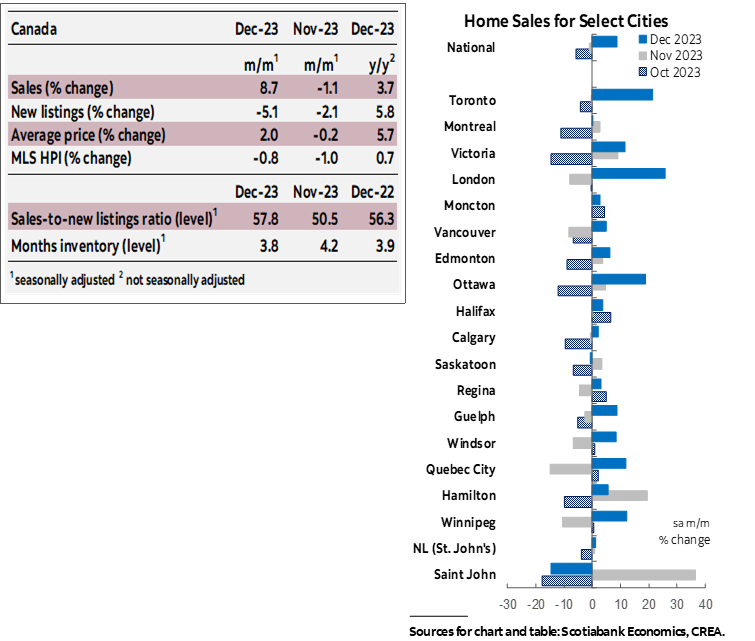
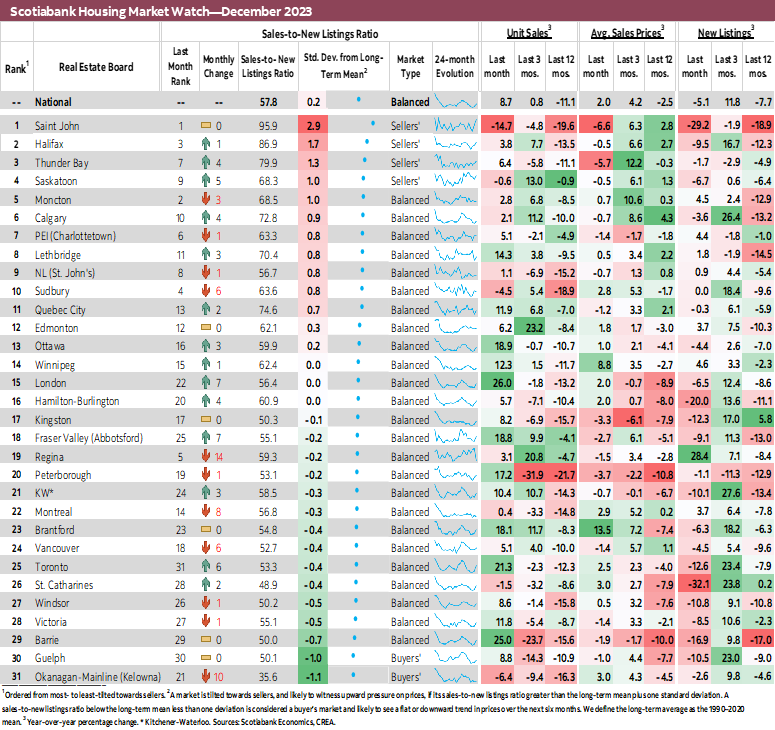
Canadian home sales jumped 8.7% (sa m/m) in December. New listings moved in the opposite direction, falling by 5.1%. These large opposite moves increased the sales-to-new listings ratio, an indicator of how tight the market is, to 57.8%, pushing it slightly above its long-term average of 55% after having been below during the previous 3 months. Still, the national market ended the year in balanced territory. There were 3.8 months of inventory—down from November’s 4.2 but still above the 2023 low of 3.2 in May and June. Months of inventory remains below its long-term average of around five months. In Atlantic Canada, months of inventory is between 4–5 months below its long-term averages.
The year as a whole recorded 11.1% fewer sales than in 2022, 7.7% fewer listings, and 3.6% lower average selling price. Sales in 2023 were 7.8% below their 2010–19 annual average, while listings were 10% below.
December’s sales increase was considerably widespread. Sales increased in 26 of the 31 markets we track, with Toronto, Barrie and London recording increases north of 20%. Saint John saw the biggest decline of the 5 remaining markets (-14.7%). December’s level of sales was 5.8% below the 2010–19 average level observed for this month.
The decline in listings was also widespread. The number of newly listed properties fell in over two-thirds of the markets we track. Out of the 22 markets where listings declined, St. Catherines recorded the largest decline of 32.1%, followed by Saint John at around 29.2%. Persistent declines in new listings since October reversed previous improvements and pushed December’s level of listings further below (8%) the 2010–19 average level observed for this month.
Of the 31 local markets we track, 25 ended the year in balanced territory compared to 19 at the start the year. Saint John, Halifax, Thunder Bay, and Saskatoon remained in sellers’ territory, while Guelph and Kelowna remained in buyers’ territory.
Prices, as measured by the MLS Home Price Index (HPI), fell by 0.8% (sa m/m) in December—a smaller decline than the previous two months. There were regional differences however, whereby prices increased in over a third of the local markets we track, which were offset by declines elsewhere. December’s monthly decline was led by single-family homes (-1.0%) followed by townhomes (-0.8%) and apartments (-0.7%).
The annual MLS HPI was 7% lower in 2023 than in 2022. However, it remained 6.5% above 2021, which in itself was 22.5% above 2020. The annual MLS HPI of single-family homes was 7.4% lower than in 2022, while townhouses’ was 6.7% lower and apartments 4.4% lower.
IMPLICATIONS
Canada’s housing market ended 2023 with a surprise jump in sales activity after a period that had buyers and sellers on the sidelines due to uncertainty and unaffordability. This is on theme for how the year started—following the soft period that was widely described as the housing market correction following Bank of Canada 2022 hikes, the market surprised with a resurgence of activity in February 2023.
At the very start of the year, we and everyone else, including the Bank of Canada, were expecting an eventual uptick in demand driven by pent-up demand, population growth, resilient labour markets, and the expected stabilization in the Bank of Canada’s policy rate with the predicted decline in inflation at the time. However, the timing, magnitude and speed in which this uptick happened surpassed all our expectations.
An unexpected increase in sales in February quickly turned into a pandemic-like resurgence in activity and marked the end of the correction. This is typical in a market like the housing market: as buyers see signs of an increase in activity and prices, they are enticed to rush back to the market before prices go up any further, in turn adding more pressure on activity and prices—a self fulfilling cycle that goes both ways. A perceived trend of slowing demand and declining prices would only encourage more of both as buyers may hold off for prices to decline further and therefore add to the slowdown in demand.
Market rates had been stabilizing in the first half of 2023 following the Bank of Canada pause in December 2022, while market pricing of cuts in 2023 translated into a reduction in fixed rates. This encouraged buyers who had been on the sidelines as rates increased and prices declined to return to the market. Those buyers had amassed larger down payments during the slowdown, and were therefore equipped to join the market once signs of the end of the correction emerged, encouraged by the widespread conviction at the time that the Bank is done hiking and cuts are imminent.
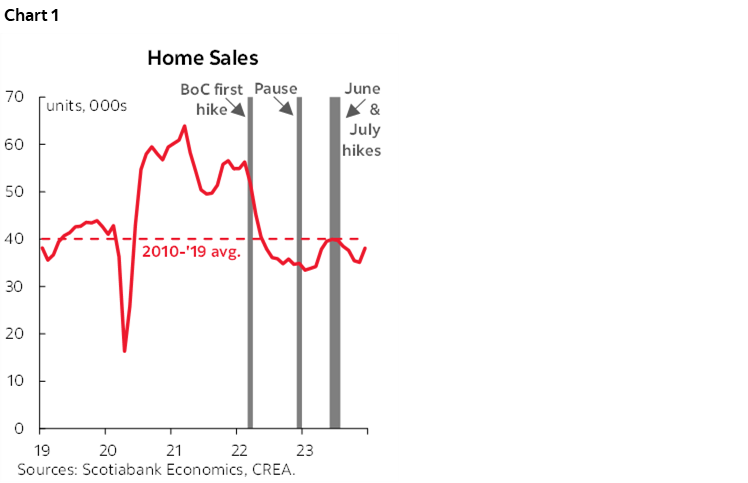
The premature end to the correction posed challenges for the Bank of Canada and its efforts to slow down the economy and bring inflation back to its 2% target. This, in large part, was behind the June and July hikes, following which, housing activity tapered off and began declining again (chart 1). The BoC hikes and the change in tone pushed variable and fixed rates up, increasing the cost of borrowing and slowing demand through that channel. However, the bigger driver of the slowdown in housing activity following these hikes had to be the uncertainty effect created by the BoC actions. By signalling that a pause is not a guarantee of an end, uncertainty about future outcomes of rates, inflation, and economic activity dawned on potential buyers, exacerbated by the sovereign yield volatility and geopolitical tensions at the time.
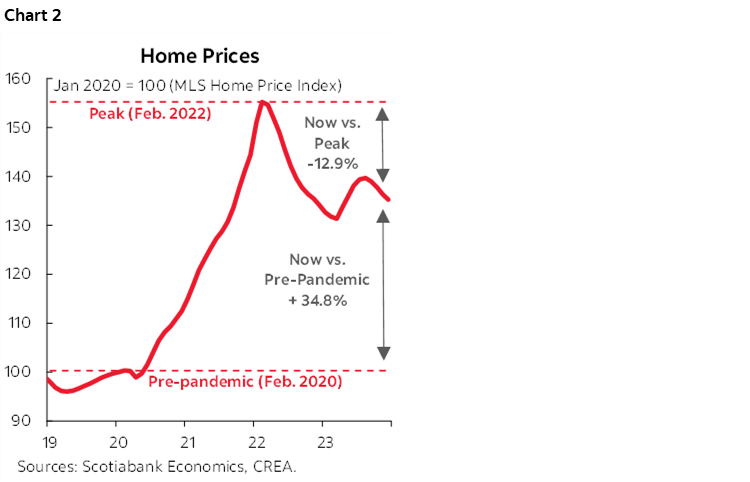
Prices followed suit in both directions with a lag—picking back up in March through August then starting to decline again (chart 2). However, despite the ups and downs, including December’s decline, prices remained quite elevated relative to 3 years ago.
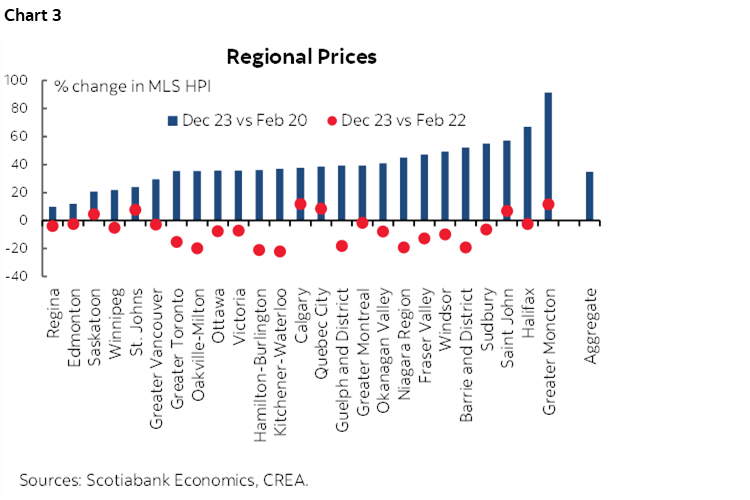
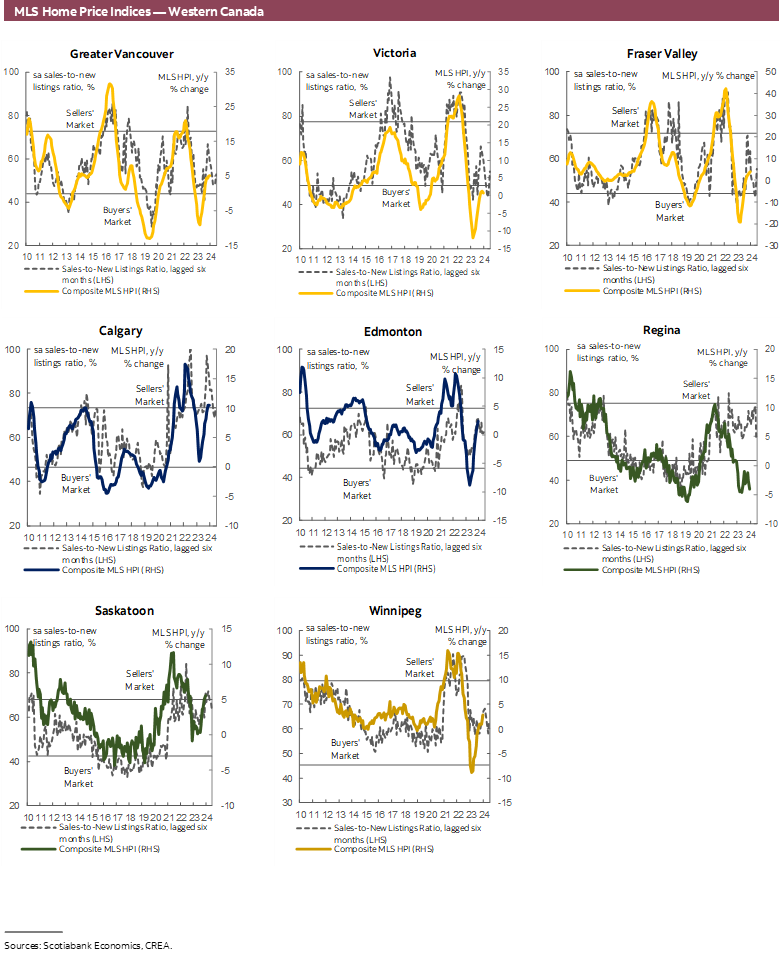
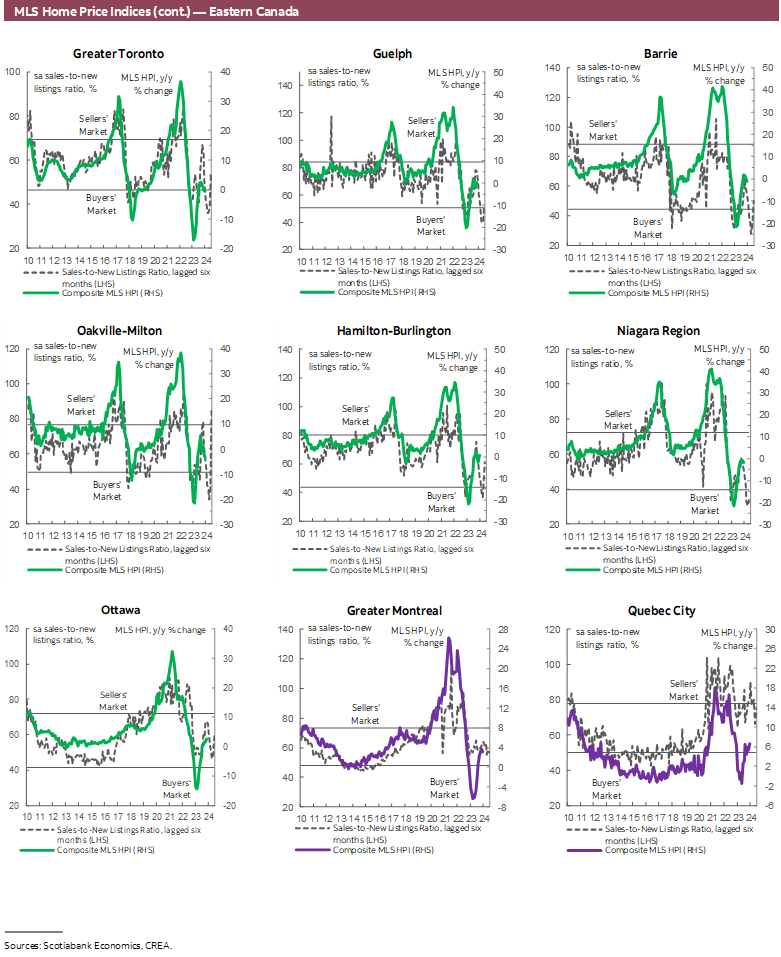
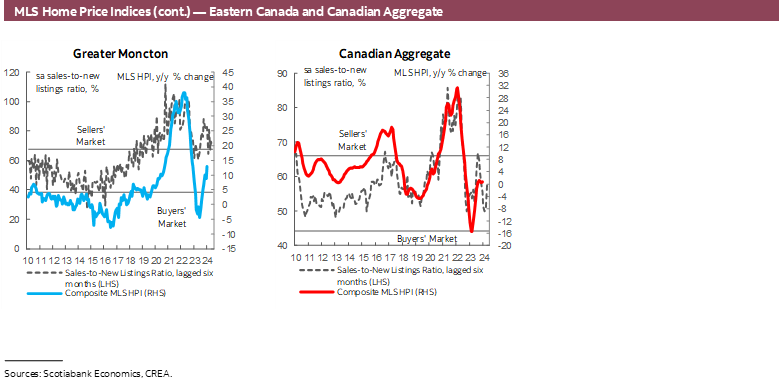
We observed that during the preceding correction period, prices had fell the most in cities where they had peaked the most during the pandemic rally. Then, between March and August, prices increased more in regions where they had corrected towards their pre-pandemic levels more during the correction period. The price declines that followed were more pronounced in markets where prices had remained well above pre-pandemic levels despite the preceding correction, mainly markets in Ontario, and to a lesser extent, BC (chart 3). Note that some markets, namely Calgary, Greater Moncton, Quebec City and Saskatoon, continued to mostly record price increases over the whole period and prices there remain above February 2022 levels.
The combination of still elevated house prices, high borrowing rates and looming uncertainty had potential buyers on the sidelines for much of the second half of the year as they awaited more clarity on the direction of the economy and the rate cuts they now expected in 2024. The latter indicated a potential for an eventual pick-up of demand and prices as pent-up demand is released once the widely expected rate cutting cycle begins, or, earlier as bond yields and fixed rates begin pricing incoming cuts.
December’s surprise jump in sales does not necessarily indicate the beginning of this potential rebound period in response to lower rates. Only 1-year fixed rates declined and by a mere 20 basis points in the last ten days of December, which is unlikely to have had a major impact on housing affordability to have spurred the month’s jump.
As we look ahead, however, the housing market will likely be responding to different forces. On one side, we have this expected release of pent-up demand, which might occur before the BoC begins cutting as buyers try to time a purchase to capture lower fixed rates and the lowest house price possible before an uptick of demand in response to rate cuts pushes prices back up. On the other side, we do expect a slowing economy ahead and an uptick in unemployment which might subdue households’ ability to make these purchases. And on the other, other, side, we have inflation and the Bank of Canada: if the resulting return of activity occurs too fast and too strong for comfort, whereby upward pressure on prices reintroduces inflationary pressures, the BoC might consider hiking again. Given an already stalling economy, extra hikes might well just be what pushes the economy into a recession—which would have wide reaching implications.
DISCLAIMER
This report has been prepared by Scotiabank Economics as a resource for the clients of Scotiabank. Opinions, estimates and projections contained herein are our own as of the date hereof and are subject to change without notice. The information and opinions contained herein have been compiled or arrived at from sources believed reliable but no representation or warranty, express or implied, is made as to their accuracy or completeness. Neither Scotiabank nor any of its officers, directors, partners, employees or affiliates accepts any liability whatsoever for any direct or consequential loss arising from any use of this report or its contents.
These reports are provided to you for informational purposes only. This report is not, and is not constructed as, an offer to sell or solicitation of any offer to buy any financial instrument, nor shall this report be construed as an opinion as to whether you should enter into any swap or trading strategy involving a swap or any other transaction. The information contained in this report is not intended to be, and does not constitute, a recommendation of a swap or trading strategy involving a swap within the meaning of U.S. Commodity Futures Trading Commission Regulation 23.434 and Appendix A thereto. This material is not intended to be individually tailored to your needs or characteristics and should not be viewed as a “call to action” or suggestion that you enter into a swap or trading strategy involving a swap or any other transaction. Scotiabank may engage in transactions in a manner inconsistent with the views discussed this report and may have positions, or be in the process of acquiring or disposing of positions, referred to in this report.
Scotiabank, its affiliates and any of their respective officers, directors and employees may from time to time take positions in currencies, act as managers, co-managers or underwriters of a public offering or act as principals or agents, deal in, own or act as market makers or advisors, brokers or commercial and/or investment bankers in relation to securities or related derivatives. As a result of these actions, Scotiabank may receive remuneration. All Scotiabank products and services are subject to the terms of applicable agreements and local regulations. Officers, directors and employees of Scotiabank and its affiliates may serve as directors of corporations.
Any securities discussed in this report may not be suitable for all investors. Scotiabank recommends that investors independently evaluate any issuer and security discussed in this report, and consult with any advisors they deem necessary prior to making any investment.
This report and all information, opinions and conclusions contained in it are protected by copyright. This information may not be reproduced without the prior express written consent of Scotiabank.
™ Trademark of The Bank of Nova Scotia. Used under license, where applicable.
Scotiabank, together with “Global Banking and Markets”, is a marketing name for the global corporate and investment banking and capital markets businesses of The Bank of Nova Scotia and certain of its affiliates in the countries where they operate, including; Scotiabank Europe plc; Scotiabank (Ireland) Designated Activity Company; Scotiabank Inverlat S.A., Institución de Banca Múltiple, Grupo Financiero Scotiabank Inverlat, Scotia Inverlat Casa de Bolsa, S.A. de C.V., Grupo Financiero Scotiabank Inverlat, Scotia Inverlat Derivados S.A. de C.V. – all members of the Scotiabank group and authorized users of the Scotiabank mark. The Bank of Nova Scotia is incorporated in Canada with limited liability and is authorised and regulated by the Office of the Superintendent of Financial Institutions Canada. The Bank of Nova Scotia is authorized by the UK Prudential Regulation Authority and is subject to regulation by the UK Financial Conduct Authority and limited regulation by the UK Prudential Regulation Authority. Details about the extent of The Bank of Nova Scotia's regulation by the UK Prudential Regulation Authority are available from us on request. Scotiabank Europe plc is authorized by the UK Prudential Regulation Authority and regulated by the UK Financial Conduct Authority and the UK Prudential Regulation Authority.
Scotiabank Inverlat, S.A., Scotia Inverlat Casa de Bolsa, S.A. de C.V, Grupo Financiero Scotiabank Inverlat, and Scotia Inverlat Derivados, S.A. de C.V., are each authorized and regulated by the Mexican financial authorities.
Not all products and services are offered in all jurisdictions. Services described are available in jurisdictions where permitted by law.