CANADA HOUSING MARKET: ANOTHER RECORD YEAR—WRAPPED UP
SUMMARY
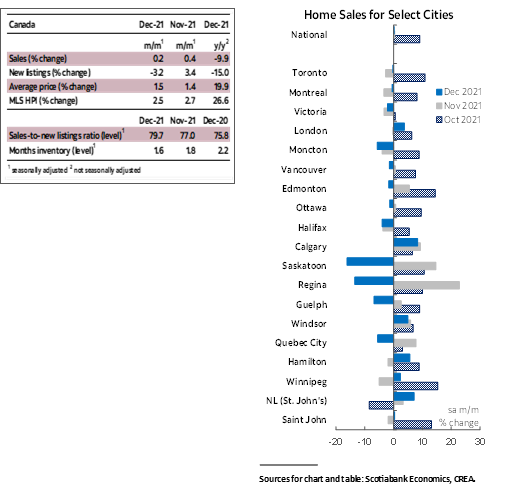
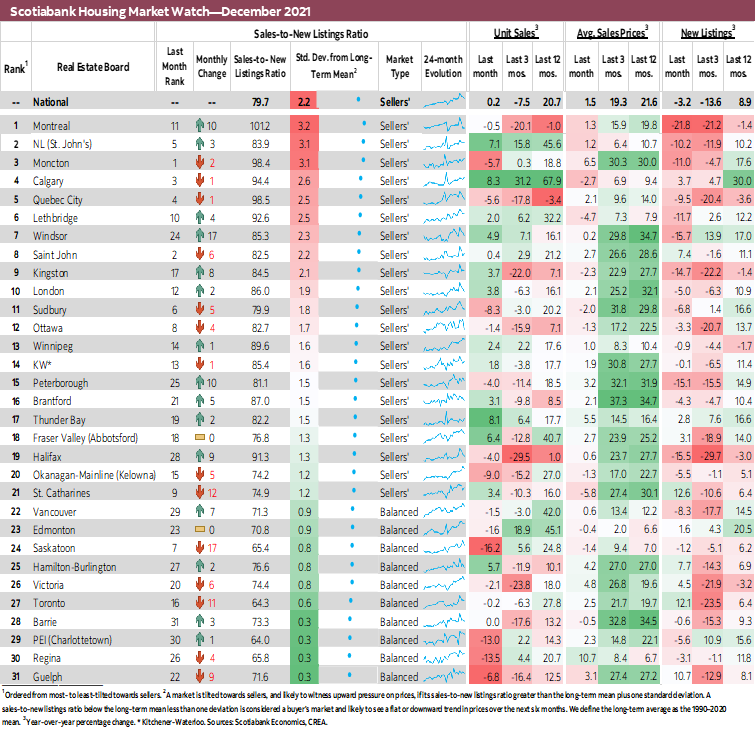
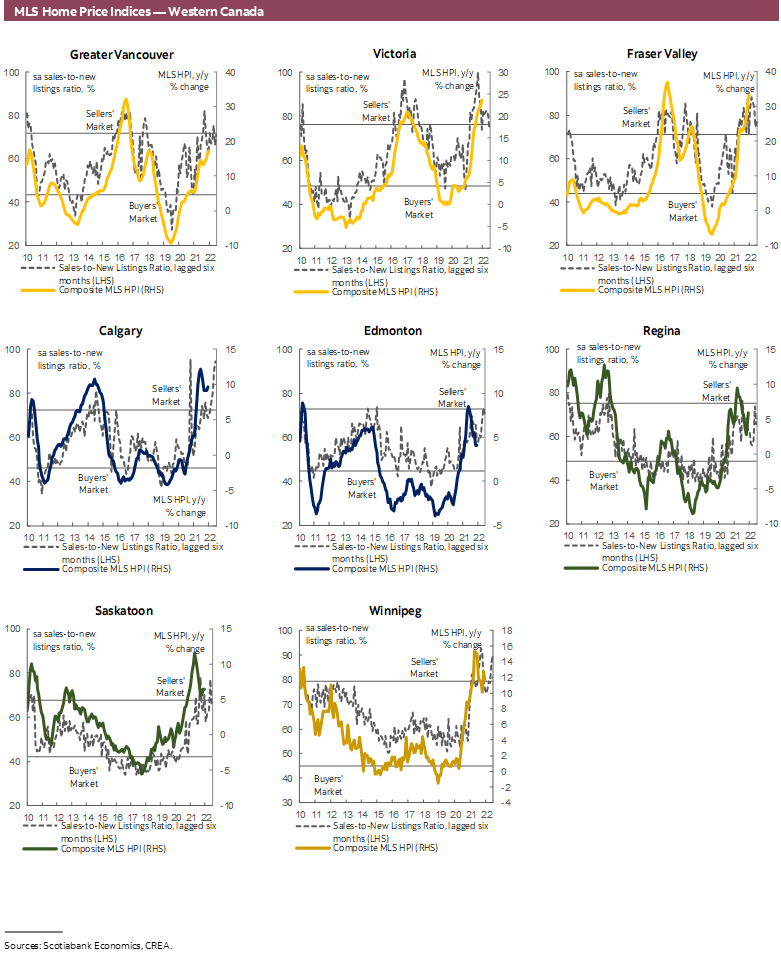
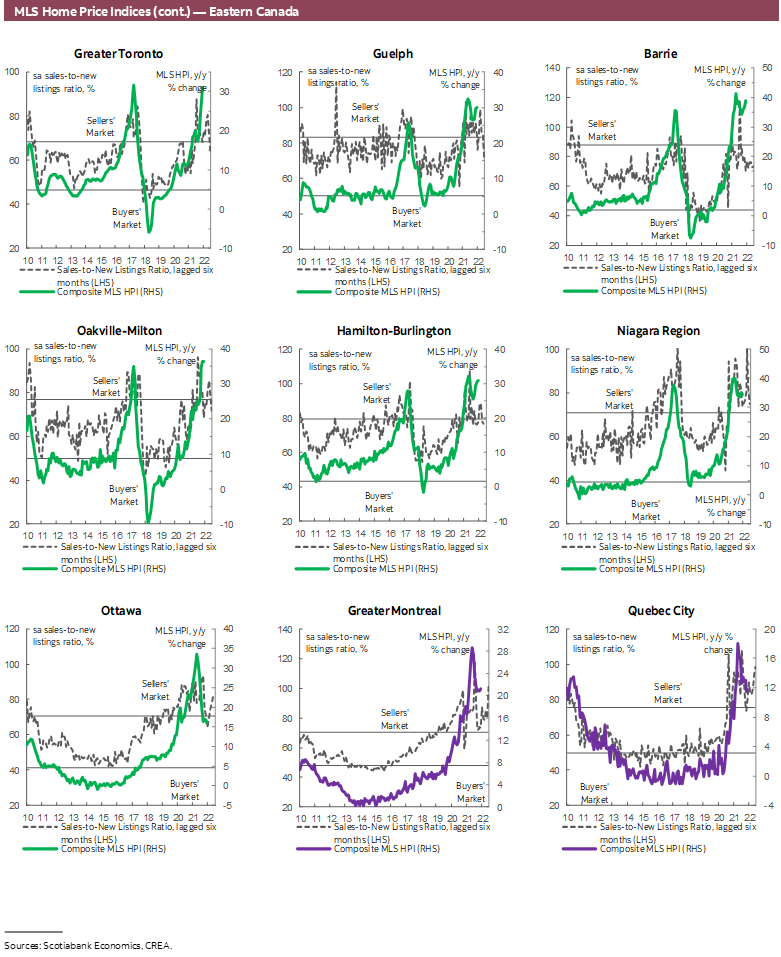
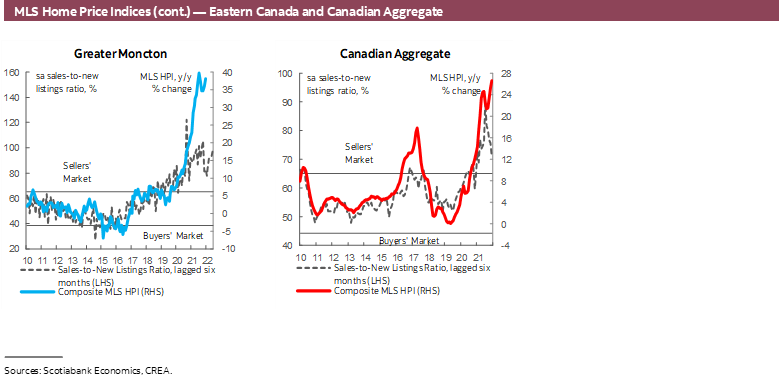
Canadian home sales rose by 0.2% (sa m/m) in December, while listings declined by 3.2% (sa m/m), reversing all of November’s improvement. This larger decline in listings retightened the sales-to-new listings ratio, an indicator of how tight the market is, bringing it back up to 79.7% after falling to 77% in November—significantly higher than its long-term average of 54.5%. As a result of these historically tight market conditions, the composite MLS Home Price Index (HPI) rose by another 2.5% (sa m/m), only slightly slower than its November pace. Single family homes and townhouses anchored December’s price gain, rising by 2.6% and 2.5% (sa m/m), while apartments rose by 2.1% (sa m/m).
Movements in the market were less broad-based in December, with sales gains in parts of the country somewhat offsetting declines elsewhere. Within the 31 local markets we track, there was a fairly even split between markets where sales increased and those where they decreased. Changes in sales ranged from a 16% (sa m/m) decline in Saskatoon, to an 8.3% (sa m/m) increase in Calgary. Note that the largest declines in December occurred in regions that recorded the largest gains in the previous month (Saskatoon, Regina, PEI, and Okanagan-Mainline). Despite what looks like a small monthly increase, the sales volumes remain at a record high. As has been the case throughout the second half of 2021, the national level of sales is the second highest on record for December after December 2020, and a remarkable 40% (sa) higher than the 2000–2019 December-average.
The decline in listings was more broad-based than the increase in sales. Of our 31 markets, listings went down in 21. Of the 10 markets where listings increased, sales went up in 6—indicative of the tight supply conditions limiting sales activity relative to demand. Despite the retightening in the national sales-to-new listings ratio, the number of our local centres in sellers’ market territory fell to 21 from 25 in November. Months of inventory continued to decline, falling to 1.6 months in December—the lowest ever on record, far below their long-term average of 5 months. Months of inventory were at record lows in British Columbia, Ontario, Quebec, New Brunswick, and Nova Scotia.
All home types contributed to this month’s price gains, with single-family homes being the main driver. One-storey single-family homes were the only segment to experience an acceleration in price gains in December, while two-story homes, townhomes, and apartments all saw their price gains decelerate, although only slightly. On the whole, the composite MLS HPI for all homes in Canada was 26.6% (nsa y/y) higher in December 2021 compared to the same month last year—the largest year-over-year increase on record.
IMPLICATIONS
The Canadian housing market wrapped up 2021 pretty much as expected. With or without December, the level of sales in 2021 had already surpassed 2020’s by October, breaking an all-time record. Compared to 2020, itself a wild year for the housing market, 2021 saw sales increase by 20%, while listings went up by only 9%, resulting in a 21% increase in prices.
Market movements and motivations in December were reflective of those of previous months. Generally speaking, sales were relatively flat in December compared to November, but they were already at levels unseen before in the housing market during the winter months—sales in the fourth quarter of 2021 were 61% higher than the 1988–2019 Q4 average, and second only to the fourth quarter of 2020. The strength was again motivated by improved labour market outcomes, acceleration in immigration, and demand from investors. The level of employment in December had surpassed pre-pandemic levels—albeit the industry distribution of those added jobs looked different than it did before the pandemic. Immigration data lag a month, but the number of admissions in November surpassed the record set in October, which itself surpassed the record set in September…you get the idea. December will likely be another strong month as the federal government makes the final push to meet its 2021 target. As of November, they were at 90%. Investor demand is also strong, and at least partly driven by strong immigration—prime source of rental demand.
The increasingly expected rate hikes this year may have also contributed to this busier-than-usual winter housing market. Persistent inflationary pressures have pushed the Bank of Canada to take on a more hawkish tone and markets are now pricing in six rate hikes in 2022. With buyers on the margins already priced out, the rush to lock in lower rates is likely concentrated within the rate-sensitive investor market segment. A new dataset from the Bank of Canada offers new insights into the makeup of mortgaged homebuyers. While the data is only available up until June of 2021, it points to an influx of investors to the market. Compared to the same time last year, home purchases by investors were 99% higher, compared to 66% by repeat-home buyers and around 47% by first-time home buyers. This is a divergence from historical trends, where home purchases across the different groups generally moved in tandem. The share of first-time home buyers in the market has subsequently fallen to its lowest level since 2015, while that of repeat-home buyers and investors increased to their highest level since 2015.
The erosion in affordability in recent years naturally pushes more buyers into the rental market, in which investors play a critical role, providing essential rental supply. The share of investors reported by the Bank of Canada captures units that are bought and flipped for a profit—however, the Bank reports that in recent years, homes bought and resold within six months have accounted for only 1% of transactions, while those flipped within 12 months have accounted for 2%. Therefore, to the extent that units purchased are not kept vacant, the increase in investor activity will support the increase in rental demand, which is important in a market that faces shortages in both market segments, owned and rented.
When the expected rate hikes come into effect, they will similarly have an outsized impact on investors’ demand in the opposite direction to the pre-hike rush we’re seeing today. That’s because investors are typically more sensitive to expectations of higher borrowing costs and lower profitability. With a larger share of investors in the buyers’ pool, rate increases may result in a disproportionate fall in demand, alleviating some of the pressure in the market. Of course, the flip side is higher payments for existing mortgage holders. Luckily, however, the rates at which these borrowers had to qualify were well above current and likely future market rates.
The 0.2% increase in December’s sales was almost certainly limited by the lack of available listings, which registered a big decline. December is generally a weaker month for listings, as people want to focus on enjoying the holidays rather than keep their homes open for viewings, but the 3.2% decline is already adjusted for this seasonal trend. This speaks to the increased tightness in the market relative to earlier years, which continues to push prices upward by larger magnitudes than the increase in sales. We expect new inventories to be almost immediately picked up by buyers, so stay tuned for what is likely to be yet another busy spring market.
DISCLAIMER
This report has been prepared by Scotiabank Economics as a resource for the clients of Scotiabank. Opinions, estimates and projections contained herein are our own as of the date hereof and are subject to change without notice. The information and opinions contained herein have been compiled or arrived at from sources believed reliable but no representation or warranty, express or implied, is made as to their accuracy or completeness. Neither Scotiabank nor any of its officers, directors, partners, employees or affiliates accepts any liability whatsoever for any direct or consequential loss arising from any use of this report or its contents.
These reports are provided to you for informational purposes only. This report is not, and is not constructed as, an offer to sell or solicitation of any offer to buy any financial instrument, nor shall this report be construed as an opinion as to whether you should enter into any swap or trading strategy involving a swap or any other transaction. The information contained in this report is not intended to be, and does not constitute, a recommendation of a swap or trading strategy involving a swap within the meaning of U.S. Commodity Futures Trading Commission Regulation 23.434 and Appendix A thereto. This material is not intended to be individually tailored to your needs or characteristics and should not be viewed as a “call to action” or suggestion that you enter into a swap or trading strategy involving a swap or any other transaction. Scotiabank may engage in transactions in a manner inconsistent with the views discussed this report and may have positions, or be in the process of acquiring or disposing of positions, referred to in this report.
Scotiabank, its affiliates and any of their respective officers, directors and employees may from time to time take positions in currencies, act as managers, co-managers or underwriters of a public offering or act as principals or agents, deal in, own or act as market makers or advisors, brokers or commercial and/or investment bankers in relation to securities or related derivatives. As a result of these actions, Scotiabank may receive remuneration. All Scotiabank products and services are subject to the terms of applicable agreements and local regulations. Officers, directors and employees of Scotiabank and its affiliates may serve as directors of corporations.
Any securities discussed in this report may not be suitable for all investors. Scotiabank recommends that investors independently evaluate any issuer and security discussed in this report, and consult with any advisors they deem necessary prior to making any investment.
This report and all information, opinions and conclusions contained in it are protected by copyright. This information may not be reproduced without the prior express written consent of Scotiabank.
™ Trademark of The Bank of Nova Scotia. Used under license, where applicable.
Scotiabank, together with “Global Banking and Markets”, is a marketing name for the global corporate and investment banking and capital markets businesses of The Bank of Nova Scotia and certain of its affiliates in the countries where they operate, including; Scotiabank Europe plc; Scotiabank (Ireland) Designated Activity Company; Scotiabank Inverlat S.A., Institución de Banca Múltiple, Grupo Financiero Scotiabank Inverlat, Scotia Inverlat Casa de Bolsa, S.A. de C.V., Grupo Financiero Scotiabank Inverlat, Scotia Inverlat Derivados S.A. de C.V. – all members of the Scotiabank group and authorized users of the Scotiabank mark. The Bank of Nova Scotia is incorporated in Canada with limited liability and is authorised and regulated by the Office of the Superintendent of Financial Institutions Canada. The Bank of Nova Scotia is authorized by the UK Prudential Regulation Authority and is subject to regulation by the UK Financial Conduct Authority and limited regulation by the UK Prudential Regulation Authority. Details about the extent of The Bank of Nova Scotia's regulation by the UK Prudential Regulation Authority are available from us on request. Scotiabank Europe plc is authorized by the UK Prudential Regulation Authority and regulated by the UK Financial Conduct Authority and the UK Prudential Regulation Authority.
Scotiabank Inverlat, S.A., Scotia Inverlat Casa de Bolsa, S.A. de C.V, Grupo Financiero Scotiabank Inverlat, and Scotia Inverlat Derivados, S.A. de C.V., are each authorized and regulated by the Mexican financial authorities.
Not all products and services are offered in all jurisdictions. Services described are available in jurisdictions where permitted by law.