CANADA HOUSING MARKET: CALM BEFORE THE STORM?
SUMMARY
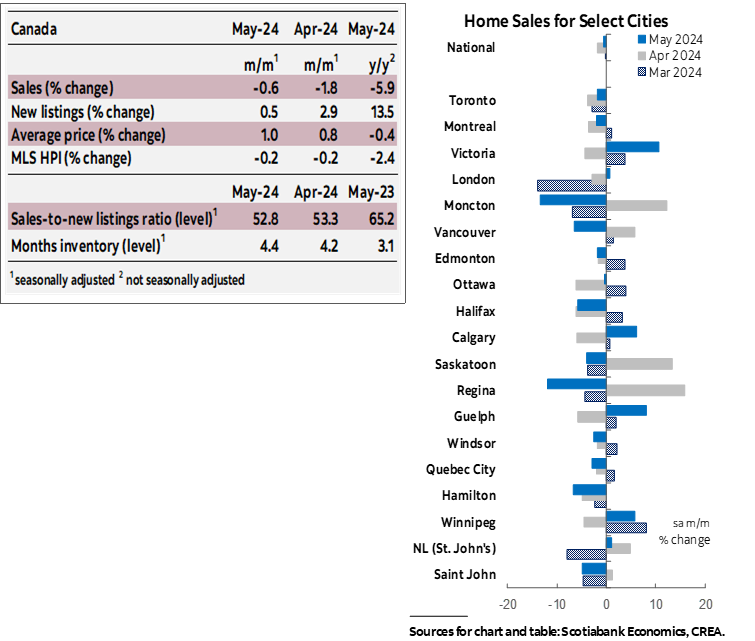
Canadian home sales edged down 0.6% (sa m/m) in May, while new listings moved in the opposite direction, increasing by 0.5%. This slightly eased the sales-to-new listings ratio, an indicator of how tight the market is, to 52.8% from 53.3% in April. Still within the bound that is consistent with the national market being in “balanced” territory (which is anything between 45% to 65%), but below its long-term average of 55%. There were 4.4 months of inventory—an improvement from the previous month’s 4.2, and back to where it was in January 2020 before the pandemic started. The long-term average for this measure is just over five months. There is regional variation, however: months of inventory in New Brunswick, Nova Scotia, Prince Edward Island and Newfoundland and Labrador are still between 4 to 6 months below their pre-pandemic long-term averages, while in BC and Ontario months of inventory are now a few days below.
It was a fairly even split between markets that saw increases in sales/listings and those that saw declines. This is in line with May’s national result of small movements in both sales and listings.
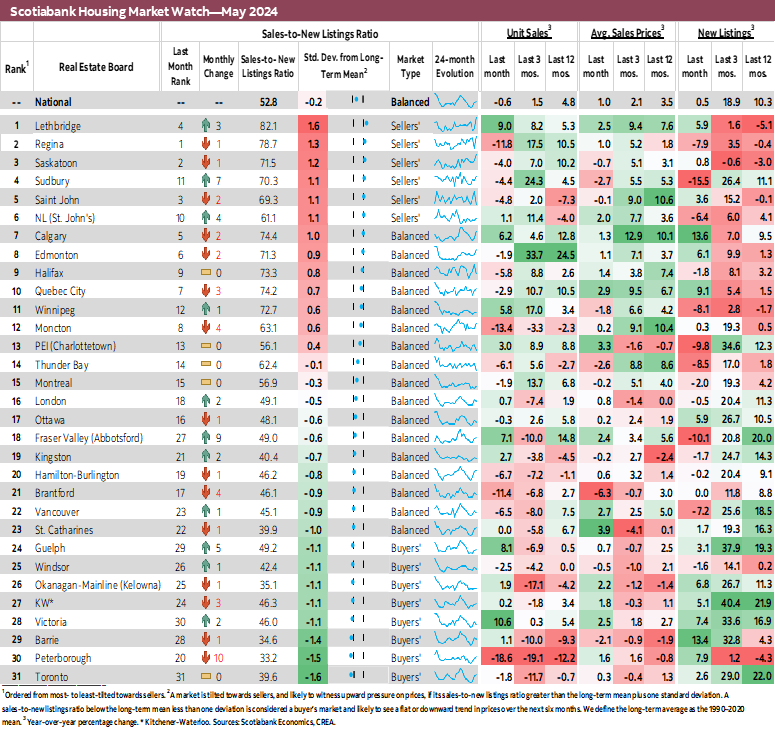
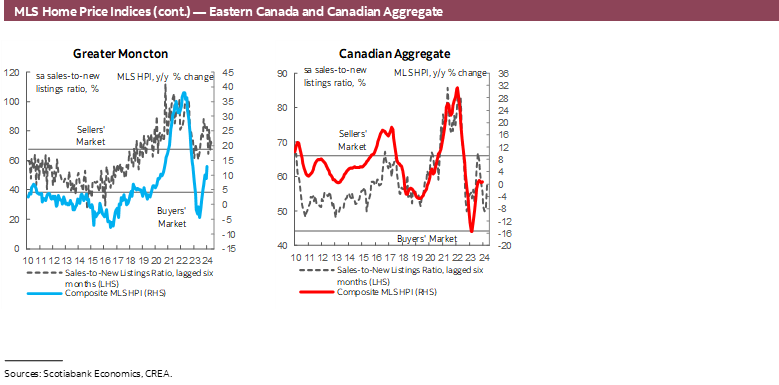
Sales declined in over half of the markets we track, offsetting increases elsewhere. Peterborough led the declines for the second month in a row with a 19% drop in May’s sales relative to April. Sales in this market have been registering large declines for four months now, with May’s decline pushing Peterborough’s sales-to-new listings ratio well below its long-term average and into buyers’ territory. Prices continued to increase there, however. Moncton, Regina, and Brantford all registered double-digit declines (having registered increases in April).
Similarly, increases in the number of newly listed properties in half of the markets we track offset declines elsewhere. This pushed three more markets (Fraser Valley, Calgary, and Moncton) into balanced territory in May, for a total of 17. With the addition of Peterborough, eight markets were in buyers’ territory as Fraser Valley moved from buyers’ to balanced territory.
Prices, as measured by the MLS Home Price Index (HPI), edged down 0.2% from April (sa m/m). Apartments and townhouses drove this decline as the HPI for these segments dropped 0.2–0.3% in May, while the HPI composite for single-family homes was flat. Relative to last year, the composite HPI is down 2.4% (y/y), with two-storey single-family homes experiencing the largest pullback of 2.3%.
IMPLICATIONS
Home sales edged down in May, continuing a trend of near flat readings and small declines that started in February after the unexpected jumps in activity seen in December and January. In the last four months leading up to May, sales activity has been muted with small monthly declines which brought the level of monthly sales back to just below where it was in December. Helped by increases in listings, prices did not tick up following December and January’s sales jump, and have continued to register monthly declines, although these declines have been getting generally smaller since December. Since December, prices have been hovering around 13–14% below the February 2022 peak, ending May 33% above pre-pandemic levels.
As we pointed out in last month’s report, May’s results are not surprising with not much to report on. The housing market continues to be weighed down by high borrowing rates, high uncertainty and high stakes. May was the last month before the Bank of Canada announced the first cut to its policy rate, and there was a lot of uncertainty leading up to the announcement on whether they would cut or not given the data and central bank communication leading up to the meeting. Therefore, the stakes were particularly high in May. Depending on what you expected, it was either the best time to enter the market or the worst. These polarized bets created a national market that has hovered sideways just below its long-term averages, but not that much below. The average of sales so far this year is just 4.6% below their 2010–19 average. On the other hand, the average of new listings so far this year is 3.5% below their 2010–19 average, having been much lower for a long time now. To that extent, one can view this as good news, or at least no news, or maybe a no news are good news situation. We are back to a healthier level of listings and optionality for buyers, with a more sustainable pace of listing and buying bringing the months of inventory back to their pre-pandemic levels. These are signs of a normalizing market with less dramatic swings and more stable prices.
However, this calm might not last long. There is no question there is demand for homes that has been likely held back by uncertainty, mostly as it relates to the Bank of Canada policy rate. With the BoC moving ahead with its first cut in June and signalling more cuts to come this year, we might see an uptick in activity as pent-up demand is released, as we’d been expecting since the slow second half of last year (putting aside the odd months of December and January).
A few things on the expected pick-up in activity now that the BoC has started cutting.
It is not going to be immediate. June’s cut was only 25 basis points. Aside from the psychological effect of less perceived uncertainty, June’s cut won’t significantly impact sales via the borrowing rates channel. With a total of 100 bps cuts baked into our forecast this year, the cumulative impact on affordability will gradually become more prominent as the year progresses.
Lower rates will surely improve affordability, but the question is whether it would be offset by higher prices spurred on by the return of demand in a market with limited supply. Higher prices might work against lower rates in keeping demand muted. This will depend on buyers’ negotiating power and general limits on their ability to pay.
Furthermore, if lower rates bring about the kind of demand surge that would lead to significant price increases, this will have inflationary impacts and pose upside risks to the rate outlook itself. Yes, it’s like going in circles! It’s not a fun time to be guessing things…
Anecdotally, we have seen many agents on media platforms fuelling the ‘fomo’ (fear of missing out) narrative now that the BoC has cut, telling prospective buyers they must jump back into the market immediately before everyone else does and they miss out on today’s low prices. Whether true or not (again there is a limit on how much people can and are willing to pay, particularly given today’s still elevated prices), this can make the return of demand more immediate than one would expect given the fundamentals. This would easily take hold in a market like the housing market, where buyers’ psychology reinforces cycles and creates the perfect conditions for ‘fomo’ rallies.
These are some of the things that we are keeping in mind as we think about the outlook for the housing market and monitor incoming data to see which of the effects would dominate throughout the remainder of the year. In one sense it could be an interaction of all these factors making for an anticlimactic second half of the year and start of cutting cycle.
DISCLAIMER
This report has been prepared by Scotiabank Economics as a resource for the clients of Scotiabank. Opinions, estimates and projections contained herein are our own as of the date hereof and are subject to change without notice. The information and opinions contained herein have been compiled or arrived at from sources believed reliable but no representation or warranty, express or implied, is made as to their accuracy or completeness. Neither Scotiabank nor any of its officers, directors, partners, employees or affiliates accepts any liability whatsoever for any direct or consequential loss arising from any use of this report or its contents.
These reports are provided to you for informational purposes only. This report is not, and is not constructed as, an offer to sell or solicitation of any offer to buy any financial instrument, nor shall this report be construed as an opinion as to whether you should enter into any swap or trading strategy involving a swap or any other transaction. The information contained in this report is not intended to be, and does not constitute, a recommendation of a swap or trading strategy involving a swap within the meaning of U.S. Commodity Futures Trading Commission Regulation 23.434 and Appendix A thereto. This material is not intended to be individually tailored to your needs or characteristics and should not be viewed as a “call to action” or suggestion that you enter into a swap or trading strategy involving a swap or any other transaction. Scotiabank may engage in transactions in a manner inconsistent with the views discussed this report and may have positions, or be in the process of acquiring or disposing of positions, referred to in this report.
Scotiabank, its affiliates and any of their respective officers, directors and employees may from time to time take positions in currencies, act as managers, co-managers or underwriters of a public offering or act as principals or agents, deal in, own or act as market makers or advisors, brokers or commercial and/or investment bankers in relation to securities or related derivatives. As a result of these actions, Scotiabank may receive remuneration. All Scotiabank products and services are subject to the terms of applicable agreements and local regulations. Officers, directors and employees of Scotiabank and its affiliates may serve as directors of corporations.
Any securities discussed in this report may not be suitable for all investors. Scotiabank recommends that investors independently evaluate any issuer and security discussed in this report, and consult with any advisors they deem necessary prior to making any investment.
This report and all information, opinions and conclusions contained in it are protected by copyright. This information may not be reproduced without the prior express written consent of Scotiabank.
™ Trademark of The Bank of Nova Scotia. Used under license, where applicable.
Scotiabank, together with “Global Banking and Markets”, is a marketing name for the global corporate and investment banking and capital markets businesses of The Bank of Nova Scotia and certain of its affiliates in the countries where they operate, including; Scotiabank Europe plc; Scotiabank (Ireland) Designated Activity Company; Scotiabank Inverlat S.A., Institución de Banca Múltiple, Grupo Financiero Scotiabank Inverlat, Scotia Inverlat Casa de Bolsa, S.A. de C.V., Grupo Financiero Scotiabank Inverlat, Scotia Inverlat Derivados S.A. de C.V. – all members of the Scotiabank group and authorized users of the Scotiabank mark. The Bank of Nova Scotia is incorporated in Canada with limited liability and is authorised and regulated by the Office of the Superintendent of Financial Institutions Canada. The Bank of Nova Scotia is authorized by the UK Prudential Regulation Authority and is subject to regulation by the UK Financial Conduct Authority and limited regulation by the UK Prudential Regulation Authority. Details about the extent of The Bank of Nova Scotia's regulation by the UK Prudential Regulation Authority are available from us on request. Scotiabank Europe plc is authorized by the UK Prudential Regulation Authority and regulated by the UK Financial Conduct Authority and the UK Prudential Regulation Authority.
Scotiabank Inverlat, S.A., Scotia Inverlat Casa de Bolsa, S.A. de C.V, Grupo Financiero Scotiabank Inverlat, and Scotia Inverlat Derivados, S.A. de C.V., are each authorized and regulated by the Mexican financial authorities.
Not all products and services are offered in all jurisdictions. Services described are available in jurisdictions where permitted by law.