CANADA HOUSING MARKET: WHAT IS NORMAL EVEN?
SUMMARY
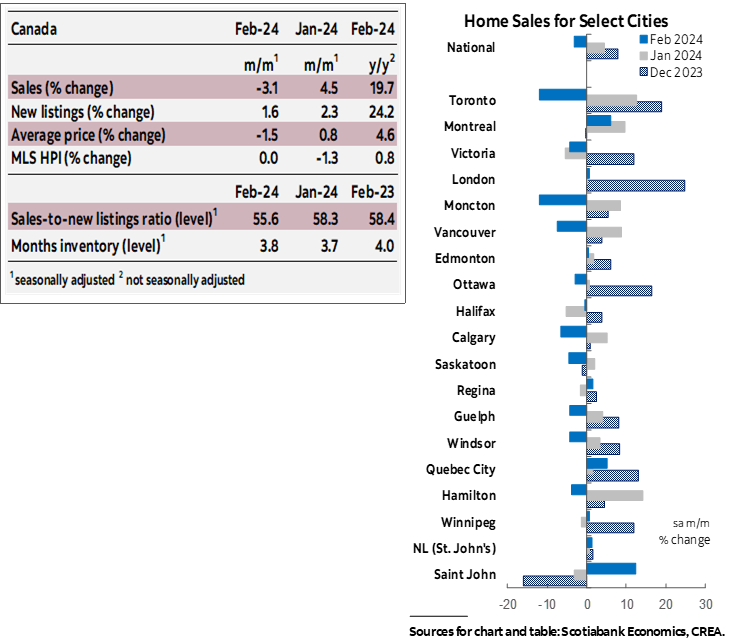
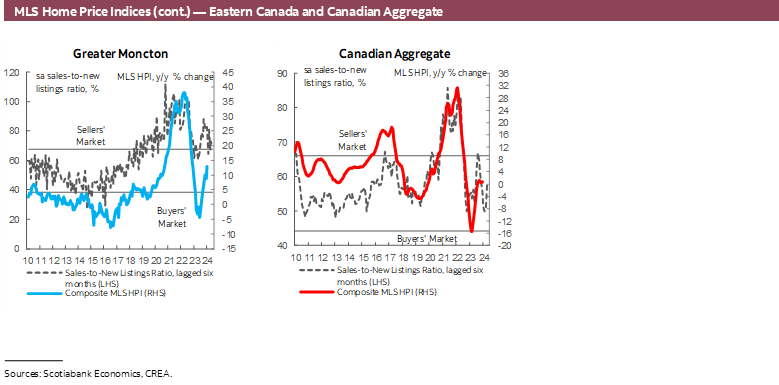
Canadian home sales declined by 3.1% (sa m/m) in February, while new listings increased by 1.6%. The decline in sales and increase in listings eased the sales-to-new listings ratio, an indicator of how tight the market is, for the first time in 5 months. After increasing each month since September, the ratio eased to 55.6% in February, down from 58.3% in January. This put it on par with its long-term average of 55% and indicated the national market remained in balanced territory, at least relative to historical standards. There were 3.8 months of inventory—a slight improvement from January’s 3.7 but still over a month below its long-term average of around five months.
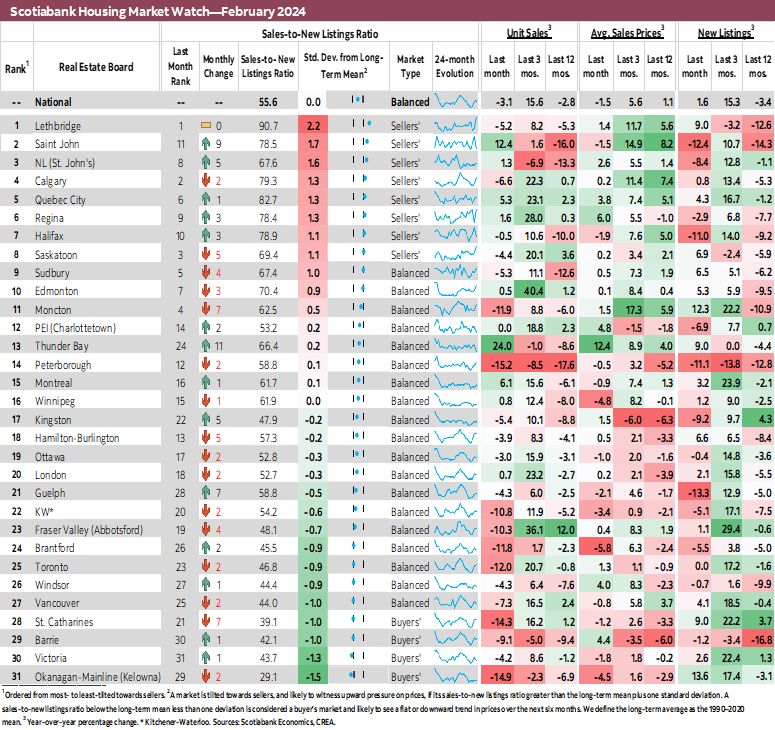
Sales declined in two thirds of the 31 local markets we track. Peterborough and Kelowna led the declines, with sales there falling by about 15% (sa m/m), followed by St. Catharines, Toronto, Moncton, Brantford, and Kitchener-Waterloo, all recording monthly declines north of 10%. Thunder Bay’s 24% increase, Saint John’s 12%, and relatively smaller increases elsewhere were more than offset resulting in a national decline. At a provincial level, it is worth noting Quebec’s 6.3% monthly sales increase, which stands in contrast to other provinces and is more than 3 times the next largest increase of 1.9% in Manitoba. February’s level of sales was 3% below the 2010–19 average level observed for this month.
Listings increased in over half (17) of the local markets we track. The number of newly listed properties increased by 14% (sa m/m) in Kelowna and 12% in Moncton, followed by 9% in each of St. Catharines, Lethbridge and Thunder Bay. The resulting national increase put February’s level of listings around 4% below the 2010–19 average level observed for this month. Given the movements in sales and listings, 19 markets were in balanced territory in February relative to 22 in January, while 8 were in sellers’ territory relative to 9 in January. St. Catharines, Barrie, Victoria and Kelowna, which were in balanced territory in January, moved to buyers’ territory in February.
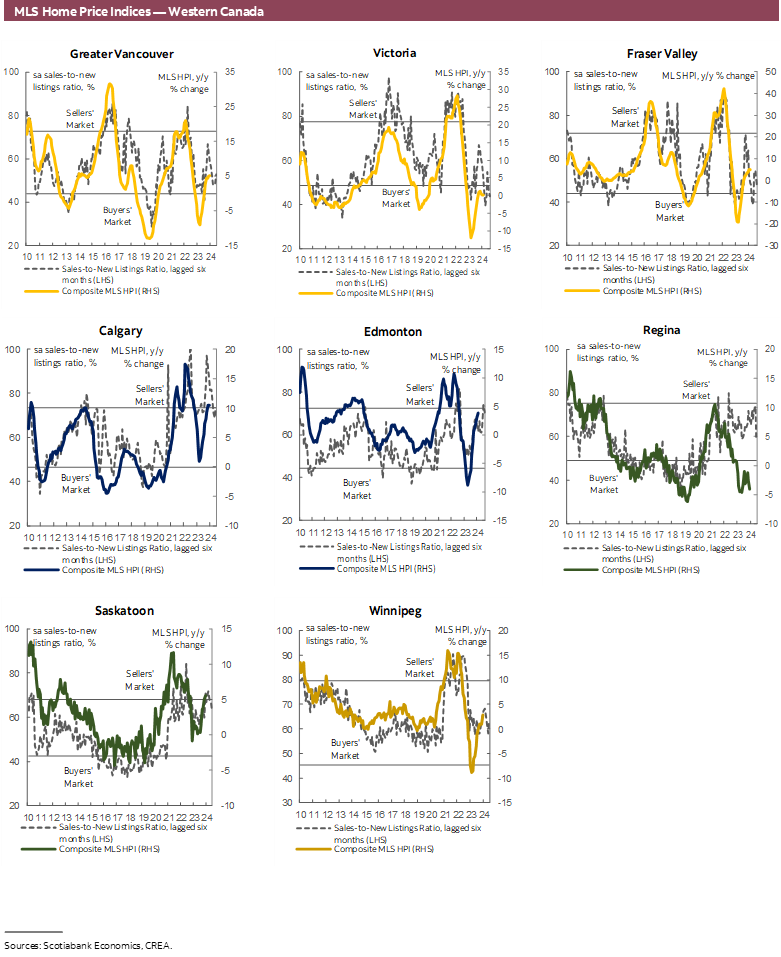
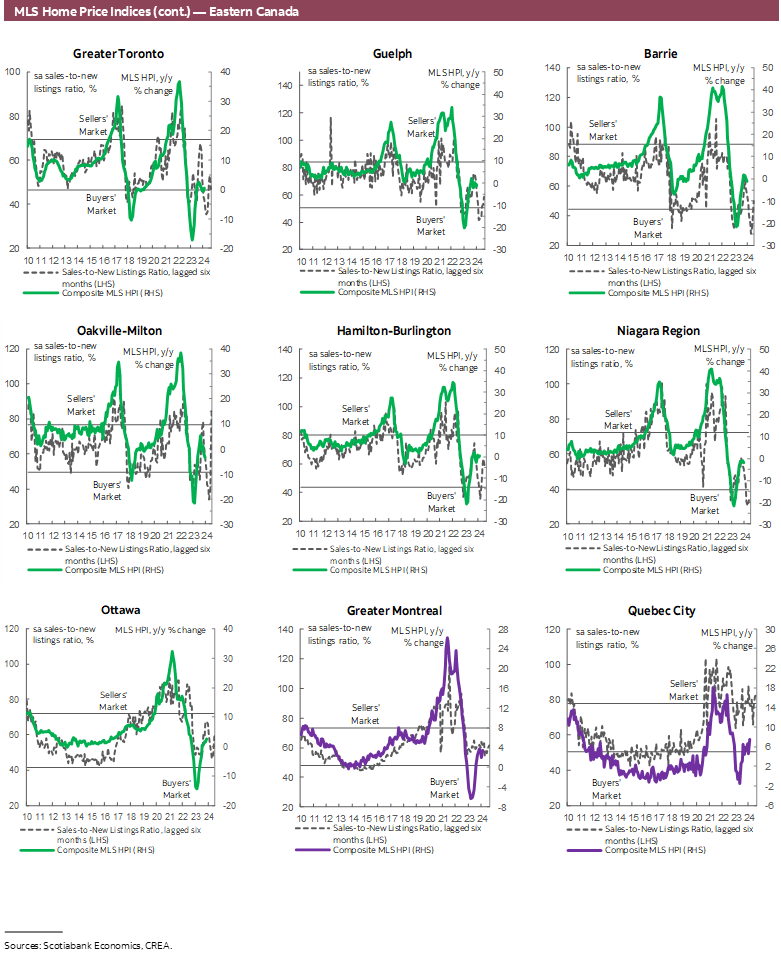
Prices, as measured by the MLS Home Price Index (HPI), were flat in February relative to January, after 5 months of consecutive monthly declines. February’s flat reading reflects no change in the single family home segment, despite small declines of 0.3% and 0.7% (sa m/m) in townhouses and apartments.
IMPLICATIONS
After what seemed to be a surprisingly early rebound in housing market activity that started in December of last year, February’s home sales were lower than they were in January. Just as we were hesitant to declare December’s and January’s jumps as the start of continuous monthly increases to come, we hesitate to declare February’s decline as anything other than that, a monthly decline in sales activity.
In focusing on monthly changes in home sales, a change in sign from one month to the other can, at times, be over-interpreted. While February’s sales were less than January’s, registering a monthly decline, in levels, the number of sales in February was still above December’s. In fact, it was above each of the three preceding months. In other words, more homes were sold per month in February compared to September, October, November, and December. This is to say, it is important to remember that switching between positive and negative monthly changes is a regular feature of an oscillating market like the housing market. A feature that perhaps was forgotten during the period that saw back to back increases that shot up the level of monthly sales to unsustainable and unprecedented levels, which was naturally followed by a period of back to back declines towards a sales per month level that is more in line with historical standards.
In fact, out of the 21 markets where monthly sales declined in February, 17 experienced a monthly sales increase in January, and the remaining four had experienced a sales increase December. In 16 of them, the prior two months increases was larger than February’s decline.
A return to ups and downs might be a sign of more normal times, or not; only time and data can tell. Monitoring incoming data and maintaining a large picture perspective can help navigate a coverage-saturated market when making a sale or purchase decision.
Having said this, it is important to remember that ‘normal times’ does not mean balanced, affordable, or healthy, by any stretch of the imagination. Normal here refers to a naturally volatile variable that measures sales per month, rather than a cumulative variable over time that trends with persistence. In reality, the housing market continues to feature significant imbalances between demand and supply, prices that have long disconnected from incomes and Canadians’ ability to afford them, and, so far, a not so promising set of actionable solutions by governments.
DISCLAIMER
This report has been prepared by Scotiabank Economics as a resource for the clients of Scotiabank. Opinions, estimates and projections contained herein are our own as of the date hereof and are subject to change without notice. The information and opinions contained herein have been compiled or arrived at from sources believed reliable but no representation or warranty, express or implied, is made as to their accuracy or completeness. Neither Scotiabank nor any of its officers, directors, partners, employees or affiliates accepts any liability whatsoever for any direct or consequential loss arising from any use of this report or its contents.
These reports are provided to you for informational purposes only. This report is not, and is not constructed as, an offer to sell or solicitation of any offer to buy any financial instrument, nor shall this report be construed as an opinion as to whether you should enter into any swap or trading strategy involving a swap or any other transaction. The information contained in this report is not intended to be, and does not constitute, a recommendation of a swap or trading strategy involving a swap within the meaning of U.S. Commodity Futures Trading Commission Regulation 23.434 and Appendix A thereto. This material is not intended to be individually tailored to your needs or characteristics and should not be viewed as a “call to action” or suggestion that you enter into a swap or trading strategy involving a swap or any other transaction. Scotiabank may engage in transactions in a manner inconsistent with the views discussed this report and may have positions, or be in the process of acquiring or disposing of positions, referred to in this report.
Scotiabank, its affiliates and any of their respective officers, directors and employees may from time to time take positions in currencies, act as managers, co-managers or underwriters of a public offering or act as principals or agents, deal in, own or act as market makers or advisors, brokers or commercial and/or investment bankers in relation to securities or related derivatives. As a result of these actions, Scotiabank may receive remuneration. All Scotiabank products and services are subject to the terms of applicable agreements and local regulations. Officers, directors and employees of Scotiabank and its affiliates may serve as directors of corporations.
Any securities discussed in this report may not be suitable for all investors. Scotiabank recommends that investors independently evaluate any issuer and security discussed in this report, and consult with any advisors they deem necessary prior to making any investment.
This report and all information, opinions and conclusions contained in it are protected by copyright. This information may not be reproduced without the prior express written consent of Scotiabank.
™ Trademark of The Bank of Nova Scotia. Used under license, where applicable.
Scotiabank, together with “Global Banking and Markets”, is a marketing name for the global corporate and investment banking and capital markets businesses of The Bank of Nova Scotia and certain of its affiliates in the countries where they operate, including; Scotiabank Europe plc; Scotiabank (Ireland) Designated Activity Company; Scotiabank Inverlat S.A., Institución de Banca Múltiple, Grupo Financiero Scotiabank Inverlat, Scotia Inverlat Casa de Bolsa, S.A. de C.V., Grupo Financiero Scotiabank Inverlat, Scotia Inverlat Derivados S.A. de C.V. – all members of the Scotiabank group and authorized users of the Scotiabank mark. The Bank of Nova Scotia is incorporated in Canada with limited liability and is authorised and regulated by the Office of the Superintendent of Financial Institutions Canada. The Bank of Nova Scotia is authorized by the UK Prudential Regulation Authority and is subject to regulation by the UK Financial Conduct Authority and limited regulation by the UK Prudential Regulation Authority. Details about the extent of The Bank of Nova Scotia's regulation by the UK Prudential Regulation Authority are available from us on request. Scotiabank Europe plc is authorized by the UK Prudential Regulation Authority and regulated by the UK Financial Conduct Authority and the UK Prudential Regulation Authority.
Scotiabank Inverlat, S.A., Scotia Inverlat Casa de Bolsa, S.A. de C.V, Grupo Financiero Scotiabank Inverlat, and Scotia Inverlat Derivados, S.A. de C.V., are each authorized and regulated by the Mexican financial authorities.
Not all products and services are offered in all jurisdictions. Services described are available in jurisdictions where permitted by law.