CANADA HOUSING MARKET: NO NEWS, GOOD NEWS?
SUMMARY
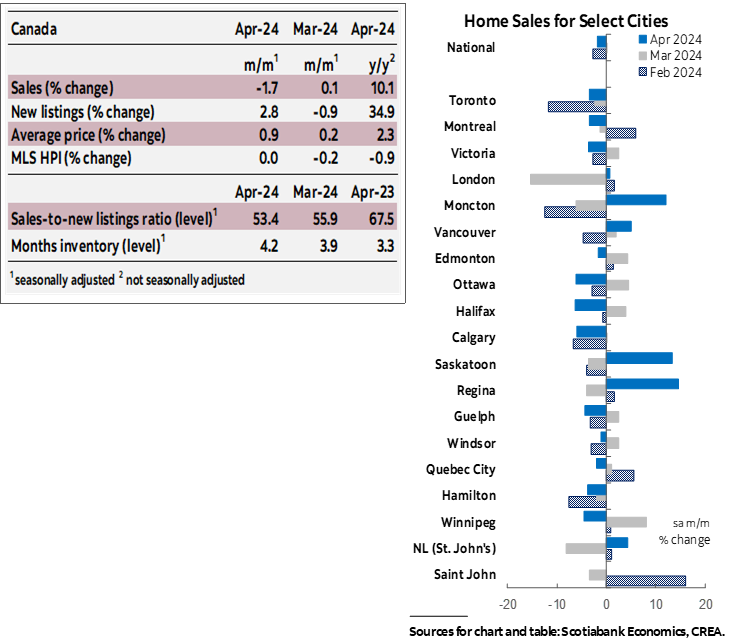
Canadian home sales declined by 1.7% (sa m/m) in April, while new listings increased by 2.8%. This eased the sales-to-new listings ratio, an indicator of how tight the market is, to 53.4% (down from 55.9% the previous month). Still within the bound that is consistent with the national market being in “balanced” territory (which is anything between 45% to 65%), but slightly below its long-term average of 55%. There were 4.2 months of inventory—an improvement from the previous month’s 3.9, and back to where it was in November 2023 (before December’s and January’s activity reheated things). While 4.2 is still around a month below this measure’s pre-pandemic long-term average of about five months, it is the highest recording since the pandemic. Months of inventory in New Brunswick, Nova Scotia, Prince Edward Island and Newfoundland and Labrador are still between 4 to 6 months below their pre-pandemic long-term averages, while in BC and Ontario months of inventory are now around 10 days below.
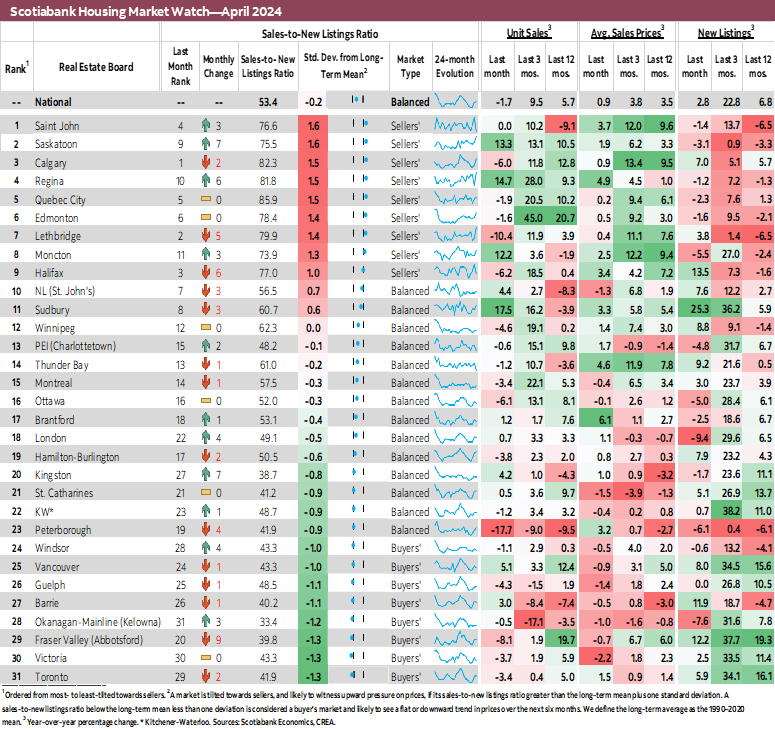
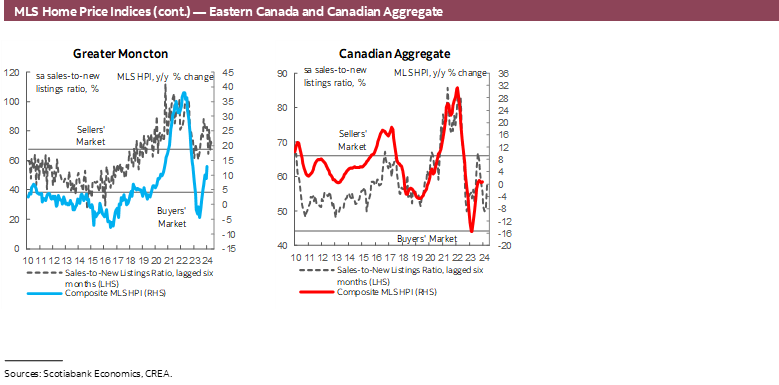
Of the 31 local markets we track, 19 saw sales decline. Peterborough led the decline with an 18% drop in April’s sales relative to March. This comes after a 9% drop in March and a 13% drop the month prior. With these large back-to-back declines, Peterborough’s sales-to-new listings ratio has so far only normalized down to slightly above its long-term average of around 41% (with prices increasing there in March and April). The second largest decline occurred in Lethbridge at -10% (after a 6% increase in March), followed by Fraser Valley (-8%), with declines of 6% or less in the remaining 16 markets. On the other hand, we saw sale increases north of 10% in Sudbury (17%), Regina (15%), Saskatoon (13%), and Moncton (12%), and smaller increases (of 5% or below) in 6 other markets.
New listings increased in just over a half of the markets we track. The number of newly listed properties increased by 25% (sa m/m) in Sudbury and between 12–13% in Barrie, Fraser Valley and Halifax, offsetting smaller declines of 10% and below in 14 markets. Given the movements in sales and listings, 7 markets moved into buyers’ territory (now 8 in total) and 3 moved into sellers’ (9 in total), leaving 14 markets in balanced territory in April relative to 24 in February.
Prices, as measured by the MLS Home Price Index (HPI), were unchanged from March. April’s flat reading is the result of a 0.1% (sa m/m) increase in single-family homes HPI being entirely offset by 0.1% decline in townhomes’ HPI and 0.4% decline in that of apartments.
IMPLICATIONS
Home sales declined at the national level in April. March’s previously reported small increase relative to February was revised down to an almost flat reading, while February also recorded a monthly decline from January.
Putting recent months’ market movements together—one can say the market has simply been walking back the unexpected heat it brought on in December and January, when sales recorded surprisingly large monthly increases. We had been expecting a return of demand but were admittedly surprised at its timing. We hesitated to consider that the beginning of the release of pent-up demand we’d been expecting, given the highly volatile and oscillating nature of the housing market. Since then, activity has been muted with small monthly declines. In the last three months leading up to April, January’s increase of over 4% was reversed, bringing the level of monthly sales back to where it was in December. We were also unsure whether prices, which had continued to decline in December and January, would follow these two months’ sales increases with a lag (as prices typically do after a turn in sales activity). Partly helped by increases in listings, prices instead have just held steady at their January level, neither increasing nor decreasing. Worth noting here that the level at which they’ve been hovering is around 14% below the February 2022 peak, but 33% above pre-pandemic levels.
This seems to be a sign of a market weighed down by high uncertainty and high stakes, not to mention still-high borrowing rates. Lots is uncertain when it comes to the outlook and lots is hinging on the next Bank of Canada move and how the market responds to it. This is either the best time to enter the market according to some or the worst according to others. These polarized bets are creating a national market that is anxiously hovering sideways just below its long-term averages, but not that much below, one might add. The average of sales so far this year is just 4% below their 2010–19 average. To that extent, one can view this as good news, or at least no news, or maybe a no news are good news situation. In fact, many positive things to highlight in today’s CREA release if we’re in the mood for that kind of thing. Listings are up such that we are at a “healthier” level of optionality for buyers (the average of listings so far this year is also 4% below their 2010–19 average, having been much lower for a long time now). With the pace at which things are being bought up and listed, the overall number of properties on the market and months of inventory are now at their “highest levels since the onset of the pandemic.” Measures of supply and demand such as these recording high readings that are comparable to pre-pandemic means the market is normalizing back to where it was just before the pandemic threw the market entirely off its (relatively more) sustainable course. The outcome of this is that prices have been “mostly stable” for the past three months.
So things are normalizing it seems, but whether this will last and for how long is another story. There is no question there is demand for homes that is likely being held back by uncertainty right now. But a return of demand likely won’t look like a return to pandemic times given the many period-specific drivers of that rally.
DISCLAIMER
This report has been prepared by Scotiabank Economics as a resource for the clients of Scotiabank. Opinions, estimates and projections contained herein are our own as of the date hereof and are subject to change without notice. The information and opinions contained herein have been compiled or arrived at from sources believed reliable but no representation or warranty, express or implied, is made as to their accuracy or completeness. Neither Scotiabank nor any of its officers, directors, partners, employees or affiliates accepts any liability whatsoever for any direct or consequential loss arising from any use of this report or its contents.
These reports are provided to you for informational purposes only. This report is not, and is not constructed as, an offer to sell or solicitation of any offer to buy any financial instrument, nor shall this report be construed as an opinion as to whether you should enter into any swap or trading strategy involving a swap or any other transaction. The information contained in this report is not intended to be, and does not constitute, a recommendation of a swap or trading strategy involving a swap within the meaning of U.S. Commodity Futures Trading Commission Regulation 23.434 and Appendix A thereto. This material is not intended to be individually tailored to your needs or characteristics and should not be viewed as a “call to action” or suggestion that you enter into a swap or trading strategy involving a swap or any other transaction. Scotiabank may engage in transactions in a manner inconsistent with the views discussed this report and may have positions, or be in the process of acquiring or disposing of positions, referred to in this report.
Scotiabank, its affiliates and any of their respective officers, directors and employees may from time to time take positions in currencies, act as managers, co-managers or underwriters of a public offering or act as principals or agents, deal in, own or act as market makers or advisors, brokers or commercial and/or investment bankers in relation to securities or related derivatives. As a result of these actions, Scotiabank may receive remuneration. All Scotiabank products and services are subject to the terms of applicable agreements and local regulations. Officers, directors and employees of Scotiabank and its affiliates may serve as directors of corporations.
Any securities discussed in this report may not be suitable for all investors. Scotiabank recommends that investors independently evaluate any issuer and security discussed in this report, and consult with any advisors they deem necessary prior to making any investment.
This report and all information, opinions and conclusions contained in it are protected by copyright. This information may not be reproduced without the prior express written consent of Scotiabank.
™ Trademark of The Bank of Nova Scotia. Used under license, where applicable.
Scotiabank, together with “Global Banking and Markets”, is a marketing name for the global corporate and investment banking and capital markets businesses of The Bank of Nova Scotia and certain of its affiliates in the countries where they operate, including; Scotiabank Europe plc; Scotiabank (Ireland) Designated Activity Company; Scotiabank Inverlat S.A., Institución de Banca Múltiple, Grupo Financiero Scotiabank Inverlat, Scotia Inverlat Casa de Bolsa, S.A. de C.V., Grupo Financiero Scotiabank Inverlat, Scotia Inverlat Derivados S.A. de C.V. – all members of the Scotiabank group and authorized users of the Scotiabank mark. The Bank of Nova Scotia is incorporated in Canada with limited liability and is authorised and regulated by the Office of the Superintendent of Financial Institutions Canada. The Bank of Nova Scotia is authorized by the UK Prudential Regulation Authority and is subject to regulation by the UK Financial Conduct Authority and limited regulation by the UK Prudential Regulation Authority. Details about the extent of The Bank of Nova Scotia's regulation by the UK Prudential Regulation Authority are available from us on request. Scotiabank Europe plc is authorized by the UK Prudential Regulation Authority and regulated by the UK Financial Conduct Authority and the UK Prudential Regulation Authority.
Scotiabank Inverlat, S.A., Scotia Inverlat Casa de Bolsa, S.A. de C.V, Grupo Financiero Scotiabank Inverlat, and Scotia Inverlat Derivados, S.A. de C.V., are each authorized and regulated by the Mexican financial authorities.
Not all products and services are offered in all jurisdictions. Services described are available in jurisdictions where permitted by law.