- Latam economies continue to bounce back from the pandemic-induced recession. Inflation has significantly increased.
- Supply-side bottlenecks undoubtedly account for much of the observed price pressures. But with output gaps closing and employment slowly returning to pre-COVID levels, central banks are focused on the possibility that short-term, temporary increases could raise longer term expectations.
- Central banks across the region have therefore begun to rebalance monetary conditions, raising key policy rates. However, real policy rates remain negative in most Pacific Alliance countries, despite rate hikes.
- Financial markets have readily absorbed monetary rebalancing, which is entirely consistent with long-term inflation-control commitments.
KEY ECONOMIC CHARTS
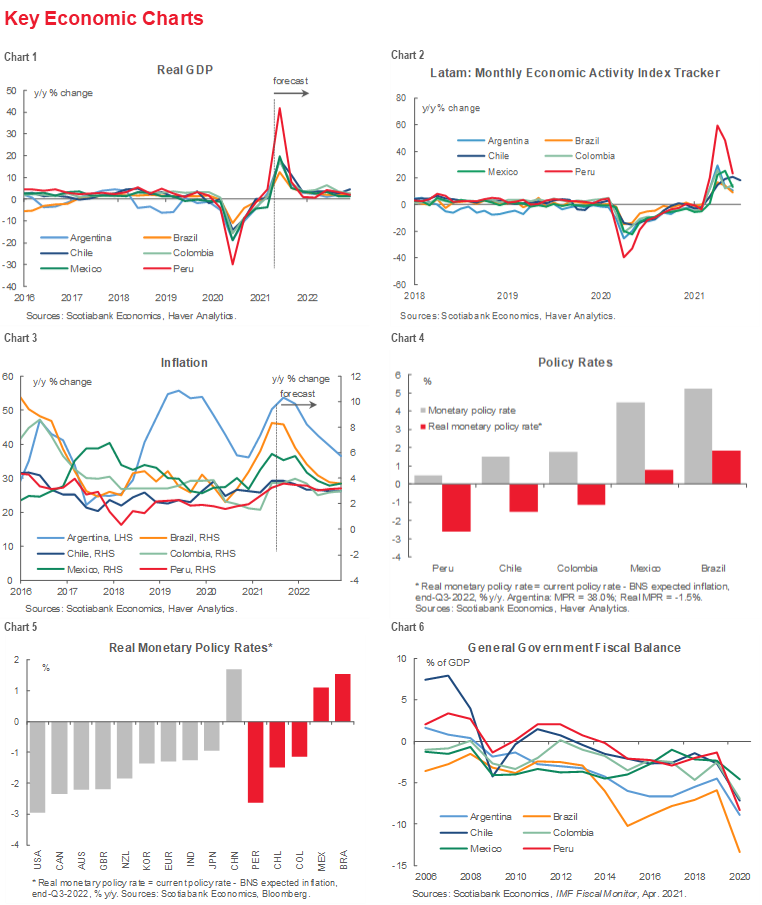
The economic recovery across the Latam region continues to advance, with projected GDP returning to pre-COVID growth paths over the medium-term (chart 1). Monthly indicators of economic activity remain at elevated levels, measured on a year-over-year basis, reflecting the sharp contraction in activity as public health lockdowns took effect in the first half of 2020 (chart 2). As noted in previous editions of the Latam Charts Weekly, however, these base effects will diminish over time. Evidence of this diminution is found in Mexican data for June retail sales, which increased 17.7% y/y, down from 29.7% y/y in May (see Latam Daily, August 25).
The rebound in economic activity, together with widespread supply bottlenecks, has led to a sharp increase in inflation in Latam countries (chart 3). While inflation is expected to decline over time as transitory effects fade, the possibility that even temporary increases in inflation could become embedded in inflationary expectations, generating ongoing price pressures, has led to increased attention on central banks across the region.
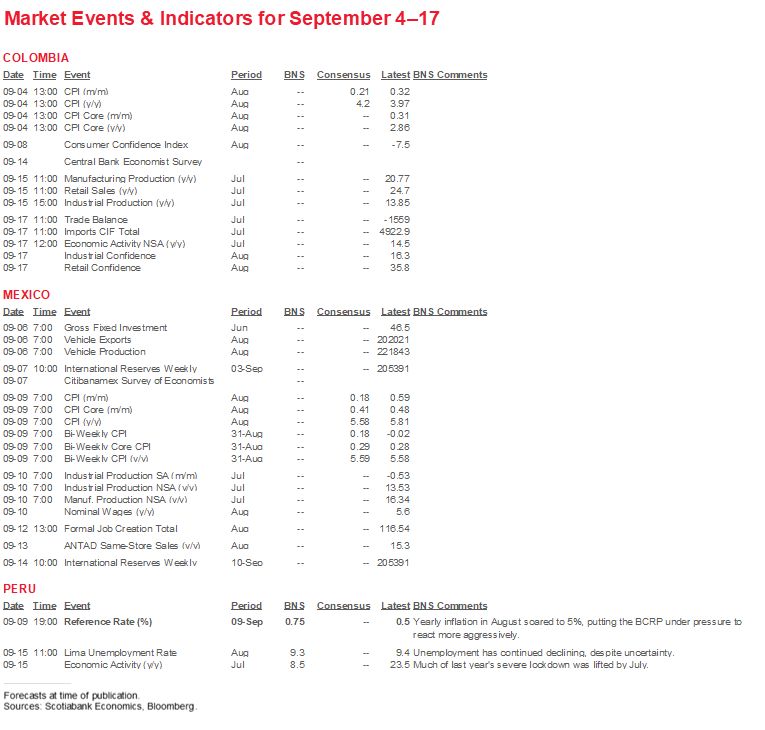
Latam central banks are closely monitoring the speed at which output gaps are closing, looking for shifts in inflation expectations, and carefully weighing the likely path of global interest rates. Most have already embarked on a tightening cycle; Chile’s central bank surprised markets by raising its key reference rate 75 bps in response to continuing strength in the economy (see Latam Flash, September 1). In Peru, inflation spiked in August at 0.98% m/m, well above the Bloomberg consensus of 0.21% and somewhat higher than Scotiabank’s estimate of 0.65%. In the face of strong price pressures, our team in Lima is raising its inflation forecast for 2021 from 3.5% to 6.5%. Meanwhile, the BCRP, which hiked rates 25 bps on August 12th, will likely follow up with another increase next week.
Given the surge in inflation, real policy rates (nominal rate adjusted for inflation) in most countries remain negative (chart 4) notwithstanding the increase in key reference rates. Brazil and Mexico have been the most aggressive in terms of having positive policy rates, and are clear outliers both within the Latam region and around the globe in this regard (chart 5).
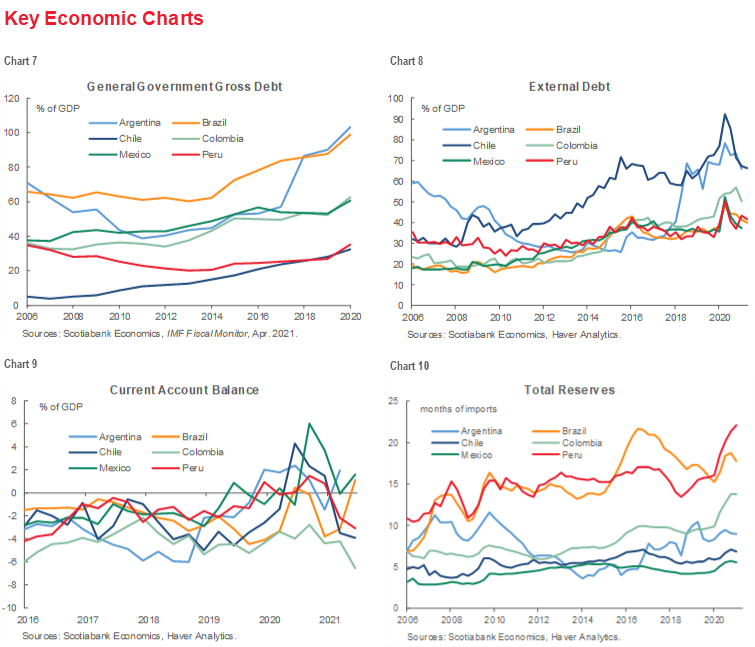
Recent increases in policy rates reflect a rebalancing of monetary conditions from the extraordinary monetary policy responses to the pandemic. Those policy responses were instrumental in softening the economic and financial effects of the pandemic. Fiscal policy responses to the COVID crisis across the region were equally robust; they played a critical role in supporting individuals and mitigating the effects of widespread economic lockdowns. Those responses explain the sharp deterioration in fiscal balances (chart 6) and rising gross debt as a share of GDP (chart 7). Higher debt burdens do not necessarily signal potential sustainability problems, but as we previously noted (see Latam Weekly, July 16) they do underscore the need for governments in the region to lay out credible plans for public debt management over the medium term.
Notwithstanding pandemic-induced increases in external debt as a percent of GDP (chart 8), external debt burdens remain at moderate levels. Similarly, current account balances (chart 9)—which strengthened in 2020 as a drop in economic activity and demand reduced imports—have deteriorated with the economic rebound. In Colombia, current account deficits have widened, financed through portfolio flows as foreign direct investment has slowed amidst the uncertainty generated by nationwide strikes earlier in the year (see Latam Daily, September 2). Total reserves in months of imports have generally risen across the Latam region (chart 10).
KEY MARKET CHARTS
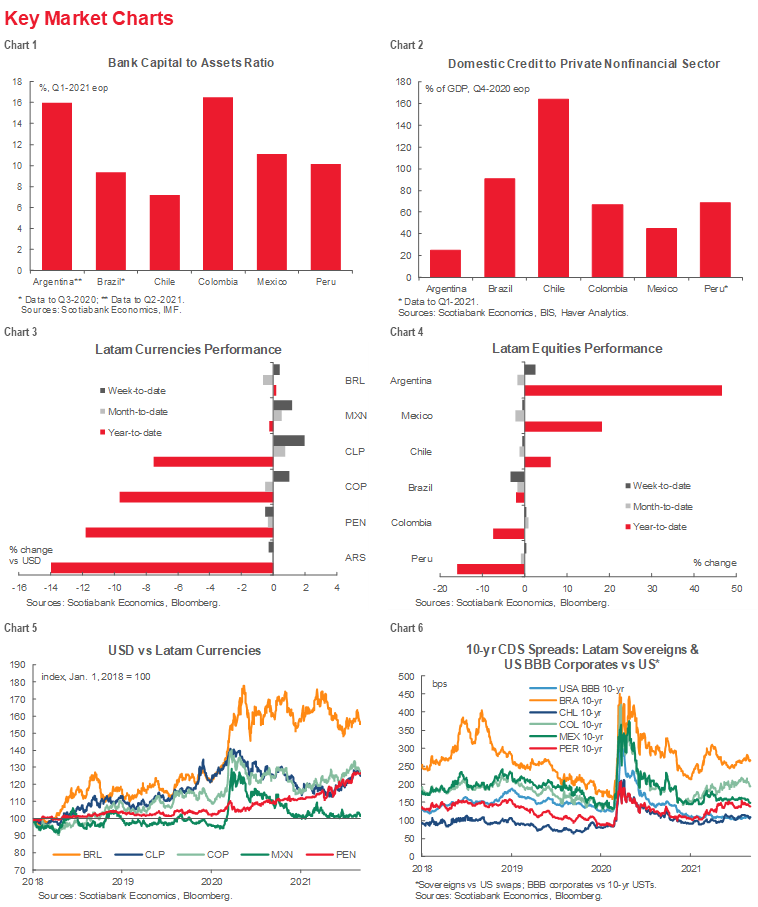
Regional currencies have depreciated against the US dollar, with the Argentine, Chilean, Colombian and Peruvian currencies recording the biggest declines (chart 3). Over a longer time horizon, the Brazilian Real has experienced a steady decline. The Mexican peso, in contrast, has been broadly stable (chart 5). Other Pacific Alliance currencies lie between these two paths.
Equity markets have, on the whole, performed better (chart 4). Market sell-offs in Colombia and Peru likely reflect nationwide protests (Colombia) and political uncertainties surrounding the presidential elections (Peru). In Peru, the new government proposed a budget that our Scotiabank experts in Lima describe as a “steady-as-she-goes” approach, likely with an eye on reassuring nervous investors.
After spiking early in the pandemic, 10-years CDS spreads on Latam sovereigns have fallen to near pre-pandemic levels (chart 6). Spreads on Colombia and Peru have widened slightly relative to earlier in the year, reflecting the idiosyncratic uncertainties noted above. Likewise, spreads on Brazilian sovereign bonds increased early in the year, also reflecting political uncertainties, but fell back somewhat through the spring; Brazilian spreads have not narrowed by as much as other regional sovereigns.
YIELD CURVE CHARTS
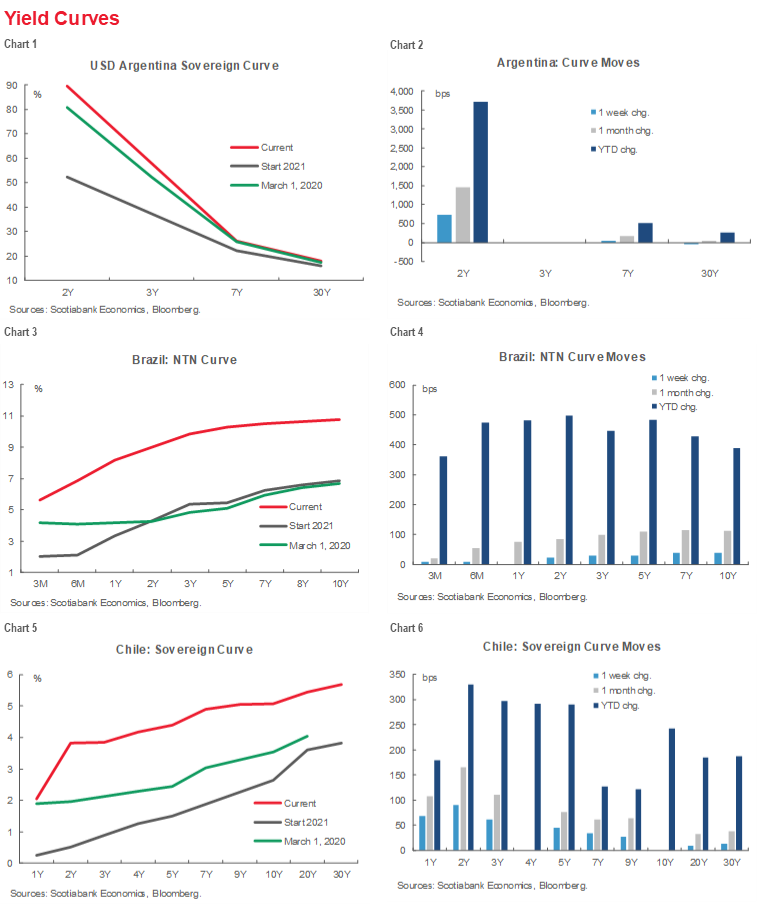
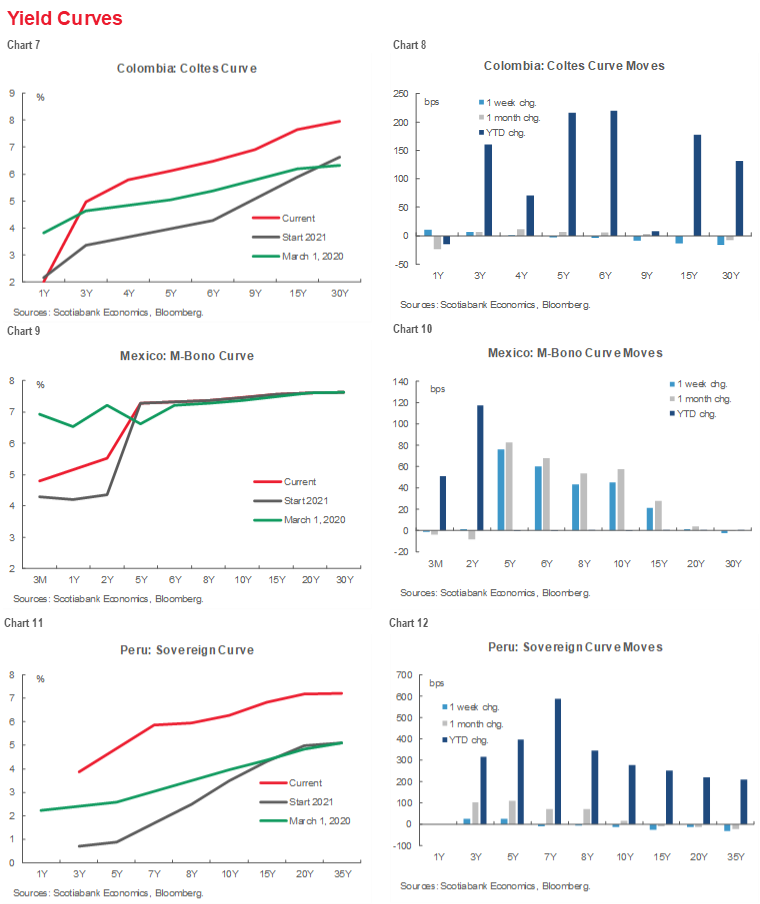
Yield curves on most Latam sovereigns have shifted up since the spring as inflation has picked up and in anticipation of a higher interest rate environment (charts 1–12). Mexico stands out in this regard (chart 9), with the M-Bono curve firmly anchored on its position at the start of 2021.
KEY COVID-19 CHARTS
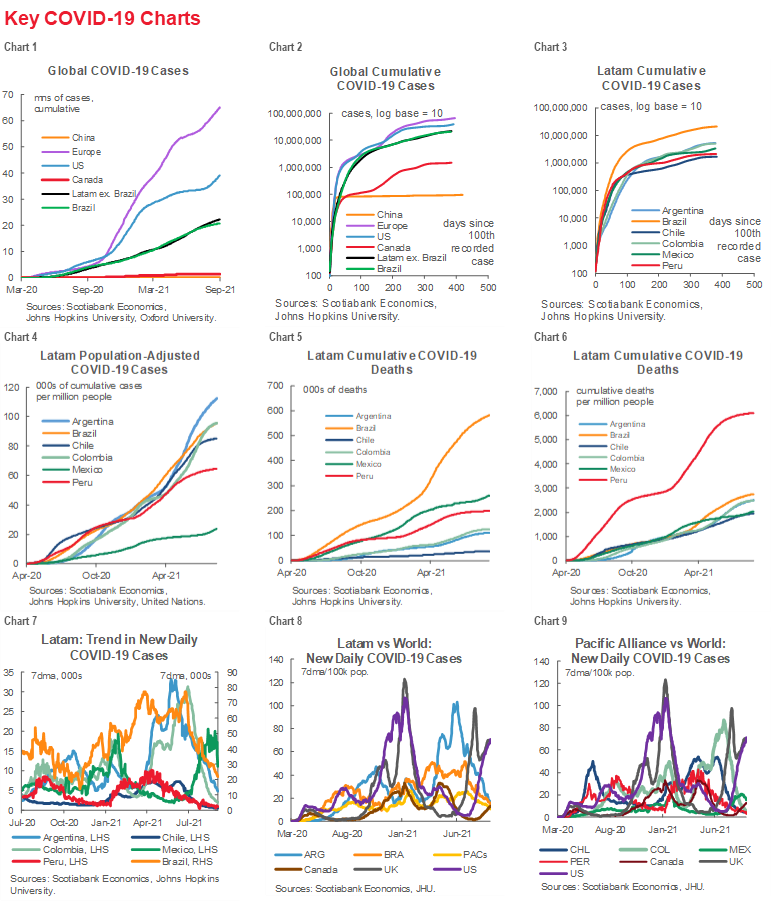
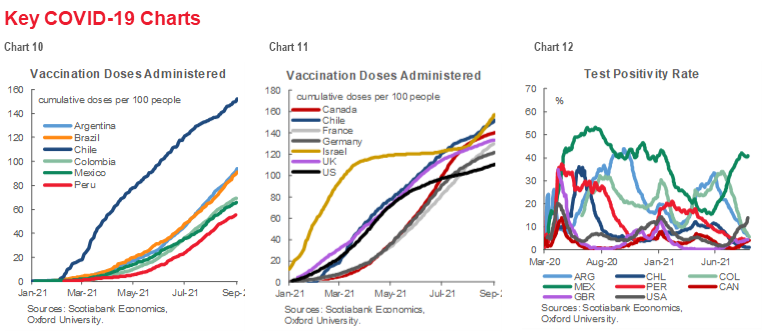
As stressed in previous issues of Latam Charts Weekly, uncertainty concerning the pandemic, particularly the risk of additional “waves” linked to new variants of the COVID-19 virus, is a critical factor in evaluating the economic outlook. Charts 1–12 provide key monitoring insights. Of especial importance is the pace of vaccination. Chile’s record in this regard is particularly impressive as it not only leads the Latam region (chart 10), but advanced countries (chart 11). The test positivity rate (chart 12) is also critical to gauging likely economic effects. While the decline of this metric in most Latam countries is encouraging, the steep rise in Mexico is worrisome and warrants close monitoring.
.
| LOCAL MARKET COVERAGE | |
| CHILE | |
| Website: | Click here to be redirected |
| Subscribe: | anibal.alarcon@scotiabank.cl |
| Coverage: | Spanish and English |
| COLOMBIA | |
| Website: | Forthcoming |
| Subscribe: | jackeline.pirajan@scotiabankcolptria.com |
| Coverage: | Spanish and English |
| MEXICO | |
| Website: | Click here to be redirected |
| Subscribe: | estudeco@scotiacb.com.mx |
| Coverage: | Spanish |
| PERU | |
| Website: | Click here to be redirected |
| Subscribe: | siee@scotiabank.com.pe |
| Coverage: | Spanish |
| COSTA RICA | |
| Website: | Click here to be redirected |
| Subscribe: | estudios.economicos@scotiabank.com |
| Coverage: | Spanish |
DISCLAIMER
This report has been prepared by Scotiabank Economics as a resource for the clients of Scotiabank. Opinions, estimates and projections contained herein are our own as of the date hereof and are subject to change without notice. The information and opinions contained herein have been compiled or arrived at from sources believed reliable but no representation or warranty, express or implied, is made as to their accuracy or completeness. Neither Scotiabank nor any of its officers, directors, partners, employees or affiliates accepts any liability whatsoever for any direct or consequential loss arising from any use of this report or its contents.
These reports are provided to you for informational purposes only. This report is not, and is not constructed as, an offer to sell or solicitation of any offer to buy any financial instrument, nor shall this report be construed as an opinion as to whether you should enter into any swap or trading strategy involving a swap or any other transaction. The information contained in this report is not intended to be, and does not constitute, a recommendation of a swap or trading strategy involving a swap within the meaning of U.S. Commodity Futures Trading Commission Regulation 23.434 and Appendix A thereto. This material is not intended to be individually tailored to your needs or characteristics and should not be viewed as a “call to action” or suggestion that you enter into a swap or trading strategy involving a swap or any other transaction. Scotiabank may engage in transactions in a manner inconsistent with the views discussed this report and may have positions, or be in the process of acquiring or disposing of positions, referred to in this report.
Scotiabank, its affiliates and any of their respective officers, directors and employees may from time to time take positions in currencies, act as managers, co-managers or underwriters of a public offering or act as principals or agents, deal in, own or act as market makers or advisors, brokers or commercial and/or investment bankers in relation to securities or related derivatives. As a result of these actions, Scotiabank may receive remuneration. All Scotiabank products and services are subject to the terms of applicable agreements and local regulations. Officers, directors and employees of Scotiabank and its affiliates may serve as directors of corporations.
Any securities discussed in this report may not be suitable for all investors. Scotiabank recommends that investors independently evaluate any issuer and security discussed in this report, and consult with any advisors they deem necessary prior to making any investment.
This report and all information, opinions and conclusions contained in it are protected by copyright. This information may not be reproduced without the prior express written consent of Scotiabank.
™ Trademark of The Bank of Nova Scotia. Used under license, where applicable.
Scotiabank, together with “Global Banking and Markets”, is a marketing name for the global corporate and investment banking and capital markets businesses of The Bank of Nova Scotia and certain of its affiliates in the countries where they operate, including; Scotiabank Europe plc; Scotiabank (Ireland) Designated Activity Company; Scotiabank Inverlat S.A., Institución de Banca Múltiple, Grupo Financiero Scotiabank Inverlat, Scotia Inverlat Casa de Bolsa, S.A. de C.V., Grupo Financiero Scotiabank Inverlat, Scotia Inverlat Derivados S.A. de C.V. – all members of the Scotiabank group and authorized users of the Scotiabank mark. The Bank of Nova Scotia is incorporated in Canada with limited liability and is authorised and regulated by the Office of the Superintendent of Financial Institutions Canada. The Bank of Nova Scotia is authorized by the UK Prudential Regulation Authority and is subject to regulation by the UK Financial Conduct Authority and limited regulation by the UK Prudential Regulation Authority. Details about the extent of The Bank of Nova Scotia's regulation by the UK Prudential Regulation Authority are available from us on request. Scotiabank Europe plc is authorized by the UK Prudential Regulation Authority and regulated by the UK Financial Conduct Authority and the UK Prudential Regulation Authority.
Scotiabank Inverlat, S.A., Scotia Inverlat Casa de Bolsa, S.A. de C.V, Grupo Financiero Scotiabank Inverlat, and Scotia Inverlat Derivados, S.A. de C.V., are each authorized and regulated by the Mexican financial authorities.
Not all products and services are offered in all jurisdictions. Services described are available in jurisdictions where permitted by law.