Argentina: A decent hand-off to 2021
Brazil: The BRL could be the barometer of progress in 2021
Mexico: Industrial production growth slowed down in November
ARGENTINA: A DECENT HAND-OFF TO 2021
Argentina ended 2020 on some decent notes for the move into 2021. Growth in October came in a bit better than expected, while November trade, industrial production, and construction data reflected an ongoing recovery in domestic demand. Forward-looking indicators and December vehicle production pointed to continued gains in 2021. Still, the country’s external and fiscal positions remain precarious while negotiations with the IMF on a new loan stretch to the end of Q1 or later. We recap below some of the key data releases from the holidays.
October’s real GDP proxy, published by INDEC on December 23, mildly surprised on the upside compared with our forecasts for a 1.9% m/m sa gain, repeating the same rate of growth from September. That still translated, however, into a slight erosion in annual terms, from -6.9% y/y in September to -7.4% y/y October (chart 1), with nearly every sector (i.e., 13 of 14) registering annual losses except for financial services. The print keeps Argentine GDP on track to record a loss deeper than -10% y/y in 2020—the worst performance since 2002—before base effects imply growth of over 4% y/y in 2021.

November’s trade balance came in substantially below expectations. In data released December 22 by INDEC, the surplus fell from USD 612 mn in October to USD 271 mn in November, short of consensus expectations for a USD 1.1 bn surplus and even further below the USD 2.5 bn surplus notched up in November 2019. Exports were down -25.6% y/y at USD 4.4 bn, while imports were up 20.7% y/y at USD 4.1 bn, with solid gains in capital goods (up 31% y/y) and intermediate goods (up 32% y/y) marking a recovery in domestic demand—but at the cost of further erosion in FX reserves and continued pressure on the ARS.
November industrial production (IP) and construction reflected this recovery in domestic demand in their January 7 release. IP rose 3.5% m/m sa, which took annual growth up from -2.9% y/y in October to 4.5% y/y in November—the first year-on-year positive reading since pandemic control measures began in March. Construction also moved into positive territory in annual terms, rising from -0.9% y/y in October to 6.2% y/y in November on the back of a sequential acceleration from 3.5% m/m sa in October to 7.2% m/m sa gain in November.
More recent data point to continued improvements in December that could provide a solid hand-off into 2021 and realize our 4.3% y/y real GDP growth forecast despite the recent surge in new COVID-19 cases. November’s UTDT leading indicator, out on December 23, was up 3.95% m/m with good breadth after a couple months of sequential gains below 2% m/m. December vehicle production, for instance, was up a whopping 108% y/y and domestic vehicle sales were up 25% y/y, both in data published on January 6.
—Brett House
BRAZIL: THE BRL COULD BE THE BAROMETER OF PROGRESS IN 2021
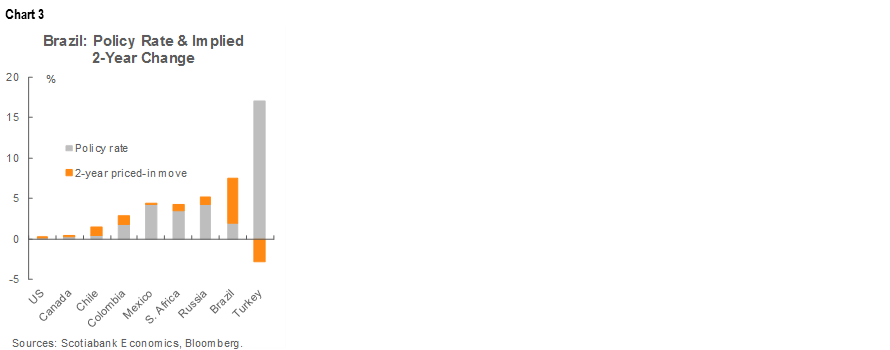
Brazilian markets, exemplified by the BRL, had a rough year in 2020. Among the world’s 31 most liquid currencies, the BRL was the second-worst performer last year (-22.5%), underperformed by only the ARS (-28.9%, chart 2). The real’s losses compare with declines in 2020 of only -5.0% for MXN, -4.5% for COP, and -8.4% for PEN. This means that the BRL already started the year having fared materially worse than its regional peers and could be set to close this gap. In addition, looking at what domestic yield curves are pricing in terms of central bank interest rate hikes, the arguments for a BRL catch-up start to gain further strength, with close to 550 bps of hikes priced into the next two years (chart 3). But this isn’t quite enough to validate a strong rebound in the real.

The combination of aggressive rate hikes priced into the DI rate curve alongside the cumulative underperformance of the BRL needs a few more pieces to fall into place for 2021 to be a strong year for the real. In particular, we think two things are needed for a strong BRL rally to materialize: (1) rising IPCA inflation needs to come back under control so that real rates can increase and provide support to the BRL; and (2) credible progress on the fiscal consolidation front.
On inflation, we think there are a few key items to consider: (a) the timing by which the BCB pulls the trigger on kicking off its tightening cycle to deal with higher IPCA prints in an effort to get ahead of inflation as opposed to chasing it; and (b) how the end of the COVID-19 fiscal stimulus response affects demand dynamics. Looking at IPCA’s behaviour, most of the components pushing up inflation are consumer non-durables, which are likely seeing demand boosted by the government’s generous household support at a time when the pandemic has disrupted supply chains. However, with the stimulus ending this month, we could see price pressures recede as long as the BCB gets ahead of inflation and avoids the development of pro-cyclical forces fanning a spiral of wage and price increases. This could be a significant challenge as the BIS has shown that indexation is still a material problem in Brazil.
On fiscal consolidation, progress will hinge on the choice of the legislative heads of Congress (i.e., the Speakers). At this point in time, consensus seems to be that Congress will see Arthur Lira take the helm, which would imply support for approving the proposed spending-cap bill, as well as some progress on possible tax reform proposals. This could boost confidence that some gains on fiscal consolidation will actually be delivered.
Still, as we have argued in the past, we don’t think the tax proposals being discussed by the government are enough to fix Brazil’s fiscal position, but together they represent a reasonable first step. Long-term fiscal sustainability is determined by both growth and spending dynamics, and our sense is that Brazil’s government is too large and spends ineffectively, which in turn affects the economy’s potential growth. A full fiscal solution likely involves a combination of spending cuts, a reduction in the size of government unless spending efficiency improves materially, and tax reform. The Brazilian government eats up over 30% of the country’s GDP, yet its results in education, infrastructure development, and healthcare remain poor:
- on education, PISA test scores from the OECD rank Brazil at the bottom of the pile;
- on infrastructure, the World Economic Forum ranks Brazil close to lower income countries; and
- on healthcare, the country’s poor results in the management of the COVID-19 pandemic look unimpressive.
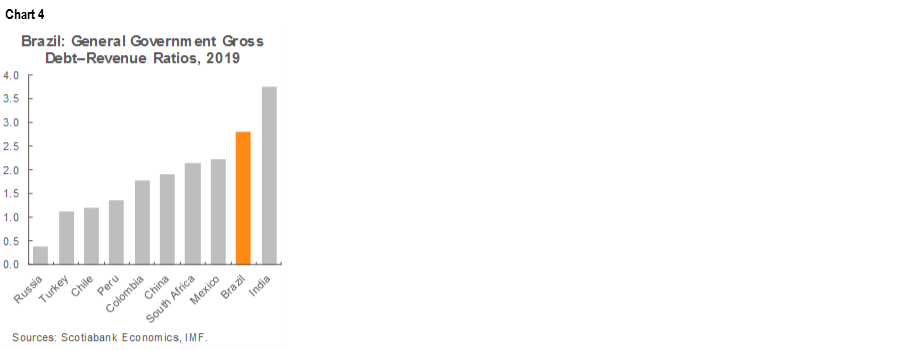
However, it’s worth considering that a weak fiscal position is already largely discounted by markets, given that Brazil lost its investment-grade credit rating years ago. In addition, by some metrics, the country’s fiscal position looks reasonably comparable to some higher-rated regional peers. Looking at the ratio of gross general government debt to GDP, Brazil has topped 100% and is among the weaker large economies in the world, with a debt burden around twice that of some of its regional peers. However, governments service debt with their revenues and not GDP. If we look at ratios of gross general government debt to public revenue, Brazil still looks highly indebted, but its capacity to service its debt is closer to that of some regional peers: for instance, its debt-to-revenue ratio is only about 1.25-times higher than Mexico’s (chart 4).
Taking all of this into account, the right signals of political support for fiscal consolidation, combined with weak starting valuations and a stronger carry, could lead the BRL to have a more solid year than we currently forecast. However, before we materially improve our outlook for the BRL, we would want to see movement from Congress on the fiscal front and additional signs over the coming weeks that the BCB is shifting toward the initiation of a tightening cycle.
—Eduardo Suárez
MEXICO: INDUSTRIAL PRODUCTION GROWTH SLOWED DOWN IN NOVEMBER
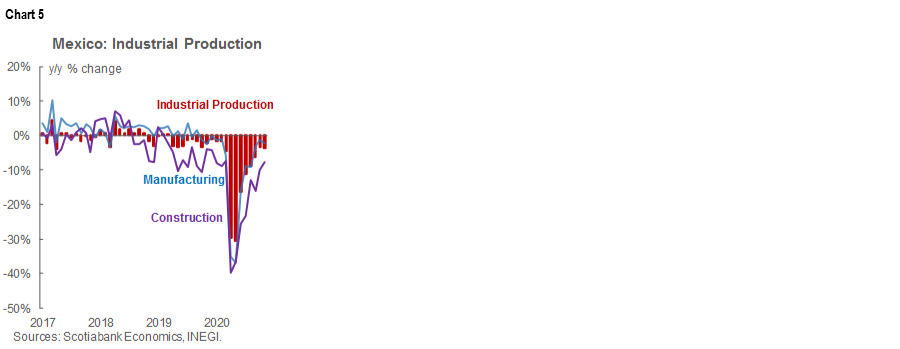
On Monday, January 11, INEGI released data for November’s industrial production (IP) that showed a moderation in its growth, going from a gain of 1.8% m/m sa in October to 1.1% m/m sa (versus 0.8% m/m sa expected in the Bloomberg consensus). The print raises some concern that the recovery might be losing momentum. The deceleration spanned IP’s major components: growth in the construction sector decelerated from 6.2% m/m sa to 2.2% m/m sa; mining went from 1.0% m/m sa to 0.1% m/m sa; manufacturing went from 1.8% m/m to 0.0% m/m, its slowest monthly rate since May; and utilities fell -2.3% m/m, also its worst monthly performance since May.
In annual terms, the November IP growth came in at -3.7%y/y, worse than the -3.4% y/y recorded in October (chart 5) but slightly better than the -4.2% y/y anticipated by analysts. By sectors of economic activity, construction led the decline by contracting -7.8% y/y, followed by utilities which dropped -7.0% y/y, mining, which was down -2.4% y/y and finally, manufacturing industries, which saw production off by -2.1% y/y. Lingering policy uncertainty, new lockdowns, and the growing spread of COVID-19 are likely to weigh on the broad industrial sector for a while.
—Paulina Villanueva
DISCLAIMER
This report has been prepared by Scotiabank Economics as a resource for the clients of Scotiabank. Opinions, estimates and projections contained herein are our own as of the date hereof and are subject to change without notice. The information and opinions contained herein have been compiled or arrived at from sources believed reliable but no representation or warranty, express or implied, is made as to their accuracy or completeness. Neither Scotiabank nor any of its officers, directors, partners, employees or affiliates accepts any liability whatsoever for any direct or consequential loss arising from any use of this report or its contents.
These reports are provided to you for informational purposes only. This report is not, and is not constructed as, an offer to sell or solicitation of any offer to buy any financial instrument, nor shall this report be construed as an opinion as to whether you should enter into any swap or trading strategy involving a swap or any other transaction. The information contained in this report is not intended to be, and does not constitute, a recommendation of a swap or trading strategy involving a swap within the meaning of U.S. Commodity Futures Trading Commission Regulation 23.434 and Appendix A thereto. This material is not intended to be individually tailored to your needs or characteristics and should not be viewed as a “call to action” or suggestion that you enter into a swap or trading strategy involving a swap or any other transaction. Scotiabank may engage in transactions in a manner inconsistent with the views discussed this report and may have positions, or be in the process of acquiring or disposing of positions, referred to in this report.
Scotiabank, its affiliates and any of their respective officers, directors and employees may from time to time take positions in currencies, act as managers, co-managers or underwriters of a public offering or act as principals or agents, deal in, own or act as market makers or advisors, brokers or commercial and/or investment bankers in relation to securities or related derivatives. As a result of these actions, Scotiabank may receive remuneration. All Scotiabank products and services are subject to the terms of applicable agreements and local regulations. Officers, directors and employees of Scotiabank and its affiliates may serve as directors of corporations.
Any securities discussed in this report may not be suitable for all investors. Scotiabank recommends that investors independently evaluate any issuer and security discussed in this report, and consult with any advisors they deem necessary prior to making any investment.
This report and all information, opinions and conclusions contained in it are protected by copyright. This information may not be reproduced without the prior express written consent of Scotiabank.
™ Trademark of The Bank of Nova Scotia. Used under license, where applicable.
Scotiabank, together with “Global Banking and Markets”, is a marketing name for the global corporate and investment banking and capital markets businesses of The Bank of Nova Scotia and certain of its affiliates in the countries where they operate, including; Scotiabank Europe plc; Scotiabank (Ireland) Designated Activity Company; Scotiabank Inverlat S.A., Institución de Banca Múltiple, Grupo Financiero Scotiabank Inverlat, Scotia Inverlat Casa de Bolsa, S.A. de C.V., Grupo Financiero Scotiabank Inverlat, Scotia Inverlat Derivados S.A. de C.V. – all members of the Scotiabank group and authorized users of the Scotiabank mark. The Bank of Nova Scotia is incorporated in Canada with limited liability and is authorised and regulated by the Office of the Superintendent of Financial Institutions Canada. The Bank of Nova Scotia is authorized by the UK Prudential Regulation Authority and is subject to regulation by the UK Financial Conduct Authority and limited regulation by the UK Prudential Regulation Authority. Details about the extent of The Bank of Nova Scotia's regulation by the UK Prudential Regulation Authority are available from us on request. Scotiabank Europe plc is authorized by the UK Prudential Regulation Authority and regulated by the UK Financial Conduct Authority and the UK Prudential Regulation Authority.
Scotiabank Inverlat, S.A., Scotia Inverlat Casa de Bolsa, S.A. de C.V, Grupo Financiero Scotiabank Inverlat, and Scotia Inverlat Derivados, S.A. de C.V., are each authorized and regulated by the Mexican financial authorities.
Not all products and services are offered in all jurisdictions. Services described are available in jurisdictions where permitted by law.