- Over the course of the pandemic, global auto sales have exemplified—if not amplified—all things unusual about this downturn. The speed of the descent in auto purchases at the onset of the crisis was eclipsed only by airline travel in most countries, while stimulus-fueled rebounds have been equally striking.
- The first economic data out, global auto sales have foretold the consumption-driven rebound that has unfolded in many advanced economies, particularly for durable goods. And even if consumers are driving less, pandemic-factors have spurred demand for vehicle ownership with higher reticence around public transit.
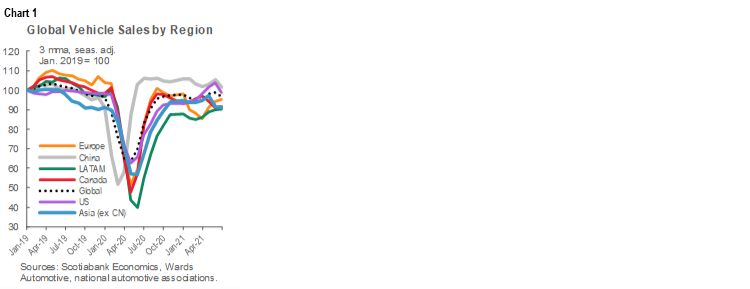
- By mid-year 2021, global auto sales sat near pre-pandemic levels, driven largely by the US and China where second-quarter annualised sales performed above end-2019 sales levels (chart 1).
- Auto production bottlenecks—owing to semiconductor chip shortages—now illustrate broader imbalances across many manufacturing sectors as supply scrambles to catch up to demand.
- The imbalance is driving up prices for new and used vehicles, which, in turn, is materially impacting inflation prints in many countries, leaving markets increasingly jittery as to how transitory this will be.
- We are cautiously optimistic that supply constraints in the auto sector are bottoming out this summer. Production should continue to pick up as the year advances, albeit with a lag before retail inventories build back in the context of pent-up demand.
- But starting points matter. Given the magnitude of the production hit and consequent impact on inventory levels, it will take several more quarters before we expect more balanced market conditions for new vehicles, taking us well into 2022.
- Used vehicle supply is expected to take longer to recover—more likely towards 2023—as it depends, in part, on rebuilding commercial fleet orders that were decimated last year, while factoring in another 12 to 24 months before these vehicles enter the used market. Meanwhile, resilient demand should underpin price pressures as the economic recovery matures and demand shifts countercyclically to used vehicles.
- There are wide bandwidths around these outlooks, not only owing to material up- and down-side risks, but also data constraints, a lack of precedent, and often conflicting reporting on the nature and evolution of shortages.
GLOBAL AUTO SALES IN BRIEF
Global auto sales in June were largely flat (-1% m/m, sa) as they have been trending over the first half of 2021. In fact, annualised sales activity has buffeted between 70–72 mn units for the past year after dipping to the low 50 mns during the worst six months of the pandemic. Recall, annualised sales were about 72 mn at the end of 2019 before the pandemic struck. The solid recovery has been driven by China’s earlier rebound in purchases, along with the stimulus-fueled recovery in US demand. These two markets alone account for about 55% of global auto demand, and largely offset the slower recovery (and from a deeper abyss) in European markets.
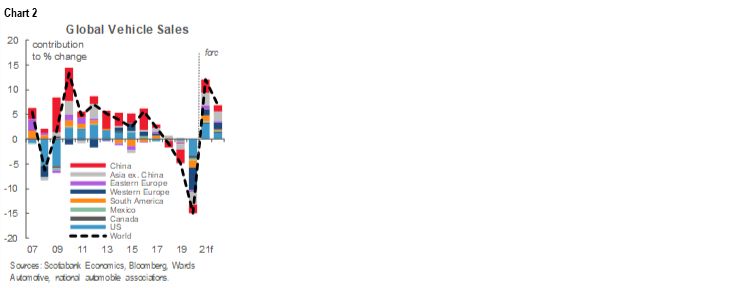
Inventory challenges arising from the global semiconductor chip shortage are expected to dampen the on-going recovery over the remainder of 2021. Third- quarter sales will likely retrench modestly after a relatively flat second quarter as inventories are expected to remain lean for most of the summer in many major markets, and acutely so in the US and Canada. Nevertheless, we expect global auto sales should post a healthy 12% y/y improvement (to 71.5 mn) in 2021 after the dismal 15% y/y contraction last year (chart 2).
Some pent-up purchases will likely be pushed out to 2022 sales. We have pencilled in growth of 6% y/y (75 mn) next year driven by US sales where demand should remain strong on the back of continued supportive policies. Chinese sales will continue to pick up, but at a more modest pace owing to its shallower dip last year, less pent-up demand from chip shortages this year, and fewer household stimulatory measures behind its recovery. European sales offer a more nuanced picture. We expect auto sales growth slightly above the global average, but base effects overstate growth as the market continues to face prospects of more headwinds from regulatory changes that will impact traditional vehicle sales.
See Box 1 in the Annex for a more detailed view of global auto sales in June.
TOO MUCH OF A GOOD THING?
Global auto demand has been riding high on the wave of policy-supported recoveries around the world. This is particularly the case for the US and Canadian markets where fiscal stimulus has overwhelmed the crisis, with both countries running massive deficits of around 15% of GDP last year. Relative to the US and Canada, China has been more conservative with its fiscal support, while Europe has been more constrained in its ability to overshoot on its fiscal provisions. However, all regions have provided ample liquidity, bringing down the cost of vehicle financing.
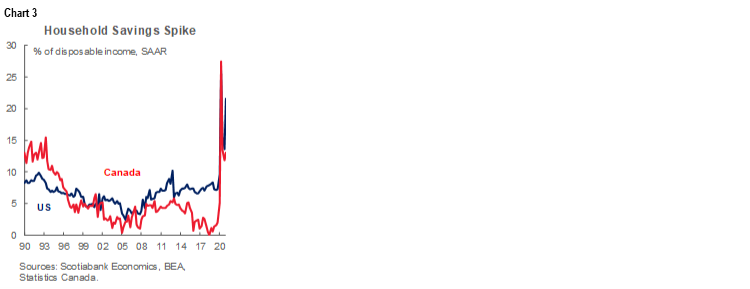
Households have been pocketing some of the windfalls from the pandemic so far. Both Canada and the US saw household savings rates spike to almost 30% of disposable income last year (chart 3). An abatement of precautionary fears and loosening of restrictions brought levels down from these peaks, but savings still remain elevated (in fact they have surged again in the US following the latest round of stimulus cheques). These savings should continue fueling the on-going recovery. For example, the Bank of Canada conservatively assumes that Canadians will spend 20% of these accumulated savings over 2022 and 2023.
So far, durables have benefited most in this consumer-led recovery with high-contact service sectors only starting to make a comeback. In the US, retail sales for June stood 18% above pre-pandemic levels, with goods-specific components driving these gains. Though slightly more subdued, the retail rebound in Canada shows similar trends. With motor vehicles and parts comprising about a quarter of retail trade, its sales are tracking the broader retail recovery: used vehicle sales are over-performing (with some help from pricing effects) and new vehicle sales are slightly weaker (chart 4). While it remains to be seen how consumers shift consumption patterns as economies fully open, the most recent Canadian Survey of Consumer Expectations suggests there are still further gains for durables relative to purchase intentions earlier this year (chart 5). Even if the relative share is eclipsed by comebacks in other sectors, it is trending in the right direction and a 3 ppt gain is not immaterial.

Solid demand will further exacerbate the supply-demand imbalance that has been dogging the sector throughout the pandemic. Even before the semiconductor chip shortage hit earlier this year, auto production was still struggling to catch up to a stronger-than-anticipated rebound in auto demand. First waves of COVID-19 saw full-stops in auto production in the Spring of 2020 and supply chain disruptions continued to impact output even after plants started reopening. By our estimates, 4 mn fewer vehicles were produced last year in North America relative to our pre-pandemic forecasts, whereas sales fell ‘only’ 3 mn short. While not one-for-one, this early mismatch in supply and demand underscores that supply was already trailing the recovery heading into 2021 (chart 6).

WHEN THE CHIPS ARE DOWN
The global semiconductor chip shortage is only making an already challenging situation worse. Pinpointing the root cause of the chip shortage is complex. Former President Trump’s trade wars with China had reportedly already put pressure on imports for American auto production prior to the pandemic with about 75% of global chip manufacturing capacity in China and South Asia. More recently, idiosyncratic weather events, fires, and/or pandemic closures have temporarily disrupted production in the US, Japan, and Taiwan. Just-in-time supply chain management, as well as purchase agreements that reportedly put more demand-risk on chip producers, have also made the auto industry more vulnerable to supply disruptions.
An overly pessimistic outlook for auto sales in early stages of the pandemic also played into today’s shortage. According to World Semiconductor Trade Statistics, automakers had cut chip orders by over 30% y/y in the worst months of the pandemic when the sales outlook appeared dire (chart 7). Automakers right-sized their order books relatively quickly as the strength of the auto sales recovery became apparent, but meanwhile delivery times stretched out from ~3 months pre-pandemic to more than 9 months amidst the shortage. Factoring in these delivery lags, it is not surprising that the acute shortage became biting by early 2021. Global sales had already attained pre-crisis levels, as chip orders—trimmed by nearly a third—were arriving.

Competing demand from other non-automotive chip uses is also a factor, but a less compelling one. Electronics such as tablets, laptops, and game consoles similarly benefited from the surge in demand for durables, along with work-from-home and remote schooling pressures. However, semiconductor chips used in these electronic devices are substantively different with distinct production facilities. It is not apparent that chip producers diverted substantial production capacity in this regard, though this other non-automotive demand may have attracted more corporate attention given the low-margin, high demand-risk entrenched in the auto chip market.
Semiconductor chip production is continuing to strengthen. Year-to-date growth in US semiconductor sales was up by 26% y/y in May, according to the Semiconductor Industry Association, with American production continuing to accelerate through June (chart 8). The sector has yet to digest a US$52 bn investment by President Biden, along with strategic talks around supply with Japan and South Korea. Meanwhile, one of the largest chipmakers—Taiwan’s TSMC—has reassured markets that auto chip shortages should abate in the third quarter this year. The producer expects output of its microcontroller units (a key component for vehicles) to be 60% higher in 2021, while it has already delivered a 30% uptick in the first half of the year.

COUNTING CARS
It will take time to reverse the substantial dent in auto production. Chip production may be up by 30% by mid-year, but global auto sales are up by closer to 50%. Estimates around lost auto output range widely: IHS Markit suggests 1.4 mn fewer vehicles will be produced worldwide, while AutoForecast Solutions puts the number above 5 mn fewer units in a bottom-up approach that tracks manufacturers’ announcements. There is broad agreement that the bulk of the shortage is impacting North American production—in the order of one million vehicles—owing to the stronger rebound in demand as well as supply chain factors applicable to North American headquartered producers.
The headline numbers mask substantial differentiation across vehicle manufacturers. For example, almost 80% of the curtailment in North American production stems from Ford, Stellantis, and GM alone. Meanwhile, Japanese automakers Toyota, Nissan, and Honda account for only about 10% of production delays in North America, while Hyundai and Volvo are significantly smaller. American companies have a stronger reliance on chips from China and South Asia whereas their Japanese counterparts source more chips from Japan. Surging demand for popular models has also been a factor in the concentration of vehicle shortages; for example, Ford’s top-selling F-series alone accounts for about 10% of production delays.
A turn-around is expected this quarter. Wards Automotive is forecasting an acceleration in the third quarter of about 13% q/q (sa) as chip deliveries accelerate and auto producers ramp up capacity. The rebound should continue through the final quarter of the year. However, year-end production would hit 15.9 mn units in North America, which is still 5% below 2019 vehicle production levels—and almost 10% below pre-pandemic output forecasts (chart 9). With automakers revising outlooks on a high-frequency basis (and the latest major downward revision only weeks ago) there is substantial risk to this outlook and increasingly limited runway to make up for lost capacity as the year advances.

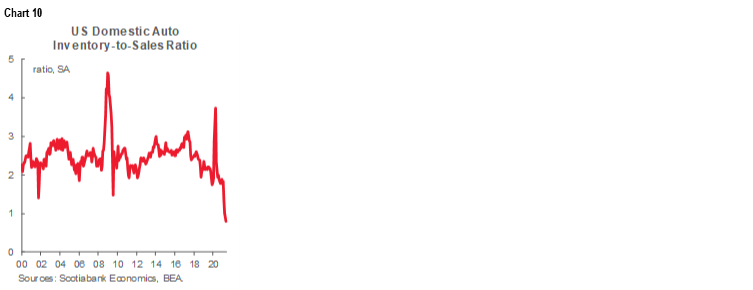
The impact of the shortage is most visible on dealer lots. Inventory levels as a share of sales in the US fell below one for the first time ever in May (chart 10). According to Wards Automotive, days supply (e.g., how quickly inventory would run out) sat at just 27 days in June—half of what it was a year ago and well-below the pre-pandemic average of 67 days for June. Days supply in Canada similarly continues to trend downward as of June with no sign of pivoting just yet. Not surprisingly, a survey by the Canadian Automobile Dealers Association reported 91% of dealers are concerned by inventory shortages.
Dealers and automakers alike have been improvising to operate under these constraints. Automakers, for example, are reportedly redirecting scarce chips to high demand (and high margin) vehicles. And some are assembling vehicles—minus the micro chips—to further fine-tune this triaging process in the final stages of production. Such strategies have likely been behind hot US auto sales that averaged close to 18 mn in annualised sales between March and May despite low inventory. (Recall, Americans bought 16.9 mn vehicles in 2019.) The 10% m/m (sa) pullback in June sales (to 15.4 mn annualised units), however, suggests there are limits to these strategies as the shortage is clearly impacting sales. Meanwhile this is pushing some dealerships to reportedly extend leases to bridge the shortage or push delivery times out by up to several months.
BETTER THAN NEW
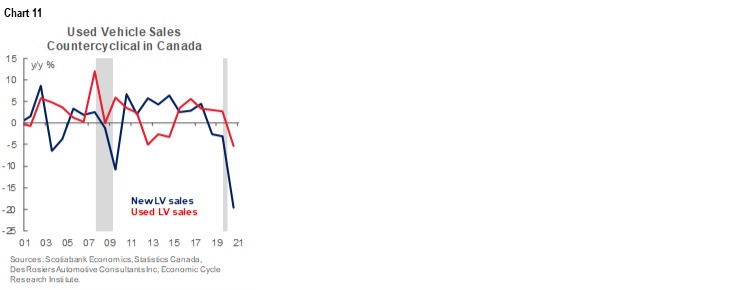
The supply shortage in the used market is even more acute as demand builds. New and used vehicle sales tend to be counter-cyclical in the US and Canada with demand shifting to more affordable used vehicle markets in the aftermath of downturns (chart 11). In this pandemic-era, public transit fears may have stimulated new demand for used vehicles for lower-wage households, while new vehicle shortages likely redirected some demand to this market which typically represents 70% of total vehicle sales in the US (and 60% in Canada). Exceptional policy supports have likely distorted any material countercyclicality this year with both markets benefiting from strong demand.
Pandemic factors have also gutted used vehicle supply. Commercial fleet—most notably rental vehicles at 50% of fleet demand—are a major source of used vehicles. As travel was halted at the onset of the pandemic, rental demand plummeted given its reliance on airport business. Whereas fleet sales generally represents 1-in-5 new vehicle transactions prior to the pandemic in Canada and the US, it is estimated to have dropped to around 1-in-6 during the pandemic, which would have removed around 1.2 mn vehicles from the pipeline. This decline in fleet purchases 12 to 18 months ago is just now hitting used vehicle supply. With rental businesses unable to fill orders presently, they are likely extending the life of current fleets, further exacerbating the shortage in used vehicle markets. Aforementioned lease extensions to bridge new inventory shortages, along with fewer repossessions are also curbing supply of used vehicles.
The slower-moving pipeline of supply in used vehicle markets suggests shortages could persist well-into 2022. In particular, new vehicle constraints will need to unwind first before used supply comes back online in a meaningful way. Notably, rental demand is expected to continue to increase over 2022 as travel accelerates which will put even more pressure on fleet demand. For Canada, the shortage is compounded by last year’s weaker Canadian dollar that would have seen more used inventory shipped south. US demand has siphoned off around 10–15% of supply in the past when the loonie was low. Even though the Canadian dollar has appreciated in past months, its outlook still remains within a range favourable to arbitrage opportunities, particularly in light of broad-based inventory shortages in the US.
STICKER SHOCK
Supply factors have driven extraordinary price gains in new and used vehicles. According to JD Power, in Canada, new vehicle transaction prices were up 14% y/y in the first quarter of 2021, while incentive spending was down by 25%. In the US, they estimate that the average price of new vehicles in the first half of the year was pacing about 10% above last year (and 14% above 2019). Recent reports by rating agencies Fitch and S&P have acknowledged that the favourable pricing and demand environment has offset hits to the production outlook and consequently do not see OEMs coming under rating pressures.
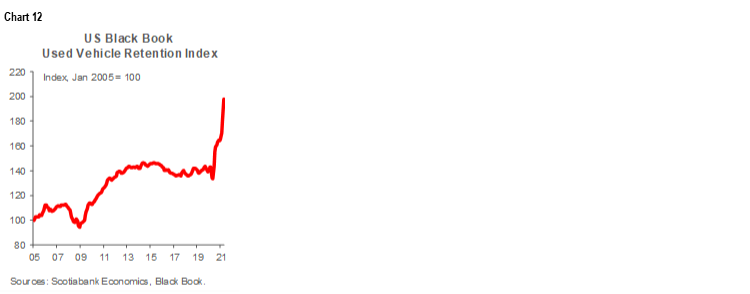
Used vehicle prices have been best described as ‘bizarre’. In theory, one could sell a 1- to 2-year old, high-demand vehicle today for more than its original sticker price. Black Book reports that retail prices at the beginning of July were about 25% higher since January alone (and inventory 10% lower) in the US. Commensurately, wholesale prices—as measured by retention indices—continue record-setting appreciation on both sides of the border (chart 12). All this to say, as long as the replacement cost for lightly used vehicles continues to surge, the potential for arbitrage is largely theoretical. Rather, it underscores the limits to profit maximization if there is simply no inventory to sell.
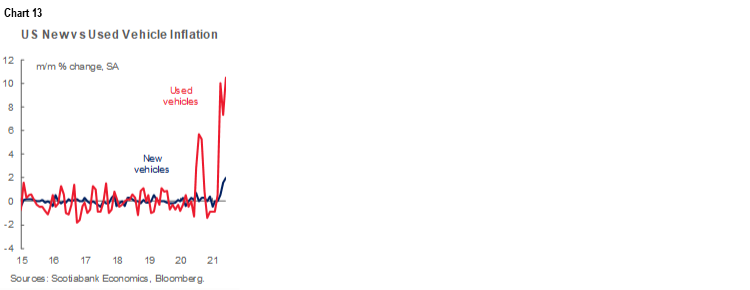
These price pressures are wreaking havoc in inflation figures. New and used vehicle prices are currently driving gains in US inflation (chart 13). At almost 7% of the basket, they are having a material impact in the near term on the inflation print with heightened scrutiny around the persistence (and ceiling) of these price gains given the knock-on effects for policy, and consequently market, rates. New vehicle price pressures have also been among the leading drivers in Canada’s inflation figures, though Statistics Canada recently revised down new vehicle weighting in its basket of goods by 1.5 ppts (to 6.11%) to account for lower vehicle sales in 2020. This should offset the otherwise upward pressure on price—on paper, at least, as vehicle sales should pick back up close to pre-pandemic levels as inventory shortages abate.
‘Transitory’ is a relative term. These price pressures are likely to linger for several quarters at least. For new vehicles, it is not likely simply low incentive spending in a sellers’ market, but also a sign of higher production costs. The US Producer Price Index for final demand services rose by 0.8% m/m (sa) for a sixth consecutive month of advances. Twenty percent of June’s increase is attributed to margins on autos and auto parts, which rose by 10.5%. The persistence of production cost pressures remains to be seen, as does the extent to which manufacturers pass along price increases.
Meanwhile, for Canadian consumers, foreign exchange effects on pricing remain to be seen. Historically, the repricing lag is about a year. It is unclear whether producers will look through last year’s weakness in the loonie as they price next year’s models.
U-TURN AHEAD?
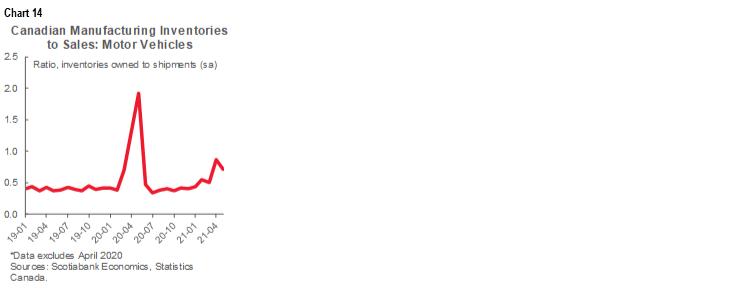
There are tentative signs that production bottlenecks are bottoming out. North American vehicle production picked up modestly in June by 2.5% m/m (sa) at an annualized production rate of 14.1 mn units after declining each month since March, according to Wards Automotive. Otherwise, an examination of inventory levels along the value chain should give a sense of where supply is heading but, in reality, the lagged nature of this data limits its usefulness in this context. Canada’s retail motor vehicle inventory as a share of sales deteriorated modestly in the first quarter of the year, a much-appreciated fact today, though the production-to-retail lag can be informative. More timely (but still lagged) wholesale inventories in motor vehicles and parts in Canada saw a 3.6% m/m increase already in May, a tentative sign that vehicles were starting to move through the supply chain. Looking earlier up the supply chain, manufacturing inventory of motor vehicles as a share of shipments also pivoted in May (chart 14), another positive sign. However, one month of data hardly makes a trend just yet and levels stand far from balanced territory.
Nevertheless, we are cautiously optimistic that production should continue strengthening as the summer advances. But defining ‘recovery’ requires more nuancing. The starting points for production and inventory levels are low. In Wards Automotive’s baseline, the accelerated North American production outlook for the remainder of 2021 will still leave levels over 7% shy of 2019 production. Another few months, if not a quarter, should be factored in before the replenishment of inventories starts to pick up speed, particularly as it takes place in the context of pent-up demand.
PROCEEDING WITH CAUTION
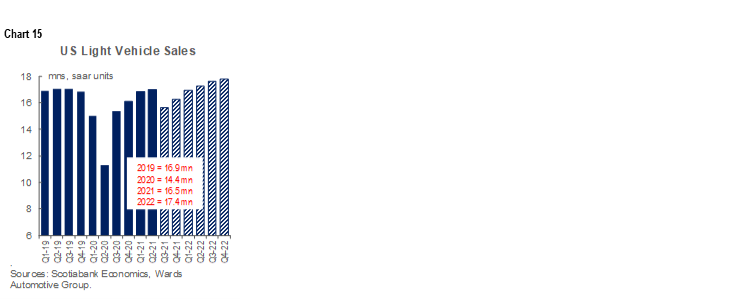
Our expectation is that low inventory will continue to constrain auto sales in the US and Canada over the summer months. A bottoming out of sales in July would be an optimistic scenario, but with a very good chance that depressed sales persist through August before consumers have more choice on dealer lots. For the US, we have cautiously pencilled in sales at an annualised level of 15.6 mn units in the third quarter, which is a sharp pullback of 8% q/q, relative to the torrid pace of sales in the second quarter at 17 mn annualised units despite June’s weak performance. Sales should pick up modestly in quarters thereafter to finish the year at 16.4 mn units and 17.4 mn units in 2021 and 2022, respectively (chart 15).
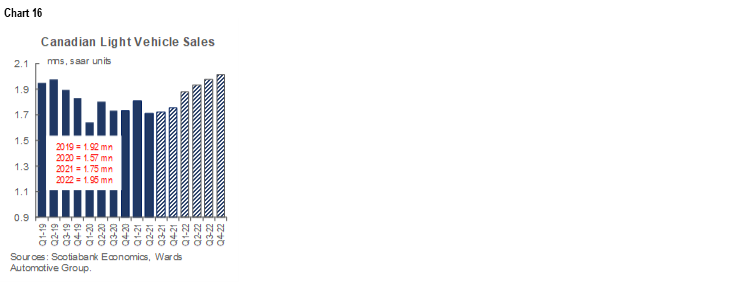
The quarterly profile north of the border is slightly different. Whereas the US saw blockbuster sales months in April and May, Canadian sales were weak in early Spring owing to more stringent lockdowns under third waves that likely curbed shopping enthusiasm. (The notably weaker sales performance in Ontario, in these months, supports this as lockdowns were relatively longer and more stringent.) Consequently, second-quarter sales in Canada decelerated substantially (by 5% q/q sa) with an annualised sales rate of 1.7 mn units. We expect third-quarter sales will be largely flat, with only modest recovery unfolding in the fourth quarter. We expect sales to land at 1.75 mn units in 2021 and 1.95 mn units in 2022 (chart 16).
Supply constraints in used vehicle markets will likely persist into 2022. Used vehicle supply should be slower to come back on line as it is dependant on new vehicle demand first being met—and fleet demand in particular—that would see the commercial sector begin to return more supply to used vehicle markets. For the US market, in particular, a strong rebound in travel services could further delay this rebalancing as the rental industry will be looking to first expand its fleet before retiring its stock to fully capitalize on the rebound. Meanwhile, demand for used vehicles is likely less sensitive to pandemic whims, that for example pushed up then rapidly deflated lumber prices, which translates into more persistently elevated prices over the next few quarters if not year.
This combination of high prices and limited supply in used vehicles would likely constrain sales activity. In Canada and the US, we expect used vehicle sales to be modestly positive this year before an acceleration in sales next year as the economic cycle matures.
Meanwhile, expect auto prices to continue to distort inflation figures for some time. The Bank of Canada’s latest forecasts show supply constraints accounting for almost half of price pressures through 2021 in an outlook that sees CPI flirting with 4% by year-end. ‘Other’ factors outside traditional drivers like output gaps and energy costs continue to weigh on its inflation outlook through 2023. The auto component no doubt is part of this story to watch.
BOX 1: TRENDS IN REGIONAL AUTO SALES
Global auto sales edged down modestly in June by -1% m/m (sa), but have been trending broadly stable at around 72 mn annualised sales units over the first half of 2021. This is roughly on par with pre-pandemic sales levels at the end of 2019, though less than stellar as global auto sales had been sliding since 2018 as a cyclical retrenchment took hold.
Third waves in some regions (e.g., Europe, North America) along with the global semiconductor chip shortage have taken some of the steam out of the global auto sales recovery in recent months. This is expected to get worse over the next couple of months before bottlenecks begin unwinding into the third and fourth quarter. It has been particularly biting for North American markets where an exceptionally strong rebound in US demand has outstripped supply. After surging sales in recent months, US auto sales pulled back in June by 10% m/m as historically low inventory levels curbed purchases. (See more details for US and Canadian June sales here.)
Chinese auto sales—representing about 30% of the global light vehicle market—are also driving headline trends. Its auto purchases were broadly stable in the second quarter of 2021 at a selling rate of 21.8 mn units—about 3% above end-2019 levels. The more aggressive approach to virus containment muted the economic impact, and has supported a stronger recovery in auto sales. Otherwise, Japanese sales have weighed on regional purchases, with a -8% m/m pullback in June.
European auto sales continue to face serious headwinds despite a modest 5% m/m (sa) improvement in June sales. This has fueled the near-term momentum as the region saw a 15% q/q (sa) improvement in Q2 driven mostly by strengthening sales in Germany. While its June annualised sales rate posted a 9% m/m lift, it still sits at 2.8 mn saar which is still more than 20% below 2019 sales. France and Italy also experienced modest improvements in June, while the UK and Spain (both pummeled by third waves) saw retrenchments of 5% m/m. Overall, more rampant COVID-19 outbreaks, stringent lockdowns, and more modest fiscal supports have dampened the region’s auto sales recovery, already struggling to adapt to more stringent emissions regulations.
Latin American auto sales were broadly flat in June (-0.6% m/m, sa) but have been trending positive with second quarter sales up 5% q/q. A modest pullback in the recovery of Mexican auto sales (-1.5% m/m,) was largely offset by a 1% m/m improvement in Brazil in June. But both major regional markets are at selling rates still -15 to -20% below pre-pandemic levels. The region continues to climb back from its very steep retrenchment in sales as it has been harder-hit by COVID-19 with more limited policy responses. Lower vaccination rates will continue to present headwinds to the recovery. Though much smaller players, Chile, Colombia and Peru, experienced strong sales in June with 11%, 38%, and 13% m/m improvements, respectively. Year-to-date sales in all three countries sit within 5% of pre-pandemic auto sales activity in 2019.
Canadian auto sales posted a rebound in June with the reopening of provincial economies. Sales picked up by 13% m/m in June, according to Wards Automotive, though second quarter sales saw a -5% q/q drop as most provinces remained under lockdown for most of April and May. The year-to-date sales rate sits at 1.76 mn, roughly where we expect it to end the year.

DISCLAIMER
This report has been prepared by Scotiabank Economics as a resource for the clients of Scotiabank. Opinions, estimates and projections contained herein are our own as of the date hereof and are subject to change without notice. The information and opinions contained herein have been compiled or arrived at from sources believed reliable but no representation or warranty, express or implied, is made as to their accuracy or completeness. Neither Scotiabank nor any of its officers, directors, partners, employees or affiliates accepts any liability whatsoever for any direct or consequential loss arising from any use of this report or its contents.
These reports are provided to you for informational purposes only. This report is not, and is not constructed as, an offer to sell or solicitation of any offer to buy any financial instrument, nor shall this report be construed as an opinion as to whether you should enter into any swap or trading strategy involving a swap or any other transaction. The information contained in this report is not intended to be, and does not constitute, a recommendation of a swap or trading strategy involving a swap within the meaning of U.S. Commodity Futures Trading Commission Regulation 23.434 and Appendix A thereto. This material is not intended to be individually tailored to your needs or characteristics and should not be viewed as a “call to action” or suggestion that you enter into a swap or trading strategy involving a swap or any other transaction. Scotiabank may engage in transactions in a manner inconsistent with the views discussed this report and may have positions, or be in the process of acquiring or disposing of positions, referred to in this report.
Scotiabank, its affiliates and any of their respective officers, directors and employees may from time to time take positions in currencies, act as managers, co-managers or underwriters of a public offering or act as principals or agents, deal in, own or act as market makers or advisors, brokers or commercial and/or investment bankers in relation to securities or related derivatives. As a result of these actions, Scotiabank may receive remuneration. All Scotiabank products and services are subject to the terms of applicable agreements and local regulations. Officers, directors and employees of Scotiabank and its affiliates may serve as directors of corporations.
Any securities discussed in this report may not be suitable for all investors. Scotiabank recommends that investors independently evaluate any issuer and security discussed in this report, and consult with any advisors they deem necessary prior to making any investment.
This report and all information, opinions and conclusions contained in it are protected by copyright. This information may not be reproduced without the prior express written consent of Scotiabank.
™ Trademark of The Bank of Nova Scotia. Used under license, where applicable.
Scotiabank, together with “Global Banking and Markets”, is a marketing name for the global corporate and investment banking and capital markets businesses of The Bank of Nova Scotia and certain of its affiliates in the countries where they operate, including; Scotiabank Europe plc; Scotiabank (Ireland) Designated Activity Company; Scotiabank Inverlat S.A., Institución de Banca Múltiple, Grupo Financiero Scotiabank Inverlat, Scotia Inverlat Casa de Bolsa, S.A. de C.V., Grupo Financiero Scotiabank Inverlat, Scotia Inverlat Derivados S.A. de C.V. – all members of the Scotiabank group and authorized users of the Scotiabank mark. The Bank of Nova Scotia is incorporated in Canada with limited liability and is authorised and regulated by the Office of the Superintendent of Financial Institutions Canada. The Bank of Nova Scotia is authorized by the UK Prudential Regulation Authority and is subject to regulation by the UK Financial Conduct Authority and limited regulation by the UK Prudential Regulation Authority. Details about the extent of The Bank of Nova Scotia's regulation by the UK Prudential Regulation Authority are available from us on request. Scotiabank Europe plc is authorized by the UK Prudential Regulation Authority and regulated by the UK Financial Conduct Authority and the UK Prudential Regulation Authority.
Scotiabank Inverlat, S.A., Scotia Inverlat Casa de Bolsa, S.A. de C.V, Grupo Financiero Scotiabank Inverlat, and Scotia Inverlat Derivados, S.A. de C.V., are each authorized and regulated by the Mexican financial authorities.
Not all products and services are offered in all jurisdictions. Services described are available in jurisdictions where permitted by law.