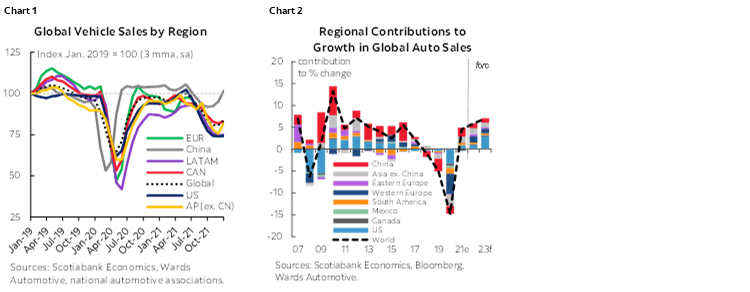
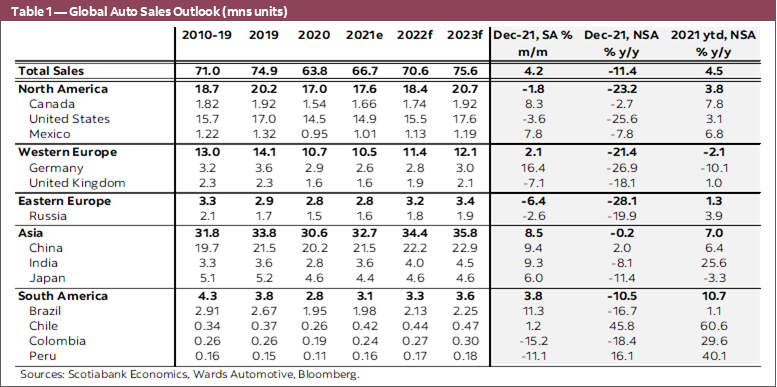
- Global auto sales posted a 4.2% m/m (sa) gain in December—mostly on the back of strong sales in China—marking the end of another year marred by setbacks for the auto sector (chart 1).
- For the year as a whole, global sales pulled off a 4.5% y/y gain in 2021 but purchase activity was still 11% below pre-pandemic levels in 2019 as chronic inventory shortages capped sales in an otherwise strong demand environment.
- Demand conditions remained strong—particularly in countries where massive policy supports were still in place. This has put household balance sheets on a firmer footing, underpinned by solid job recoveries in markets like the US and Canada.
- The persistent supply-demand imbalance fueled vehicle price appreciation in both new and used markets. This has provided some relief to automakers and dealers on a margin basis, but—directionally at least—may have also temporarily dampened consumer sentiment towards major purchases amidst a high-price, limited-selection environment.
- We expect this has led to deferred purchases for the most part. The global economy is still expected to run above trend in 2022 and into 2023 as rebound factors continue play out and the policy environment is still broadly accommodative, particularly in real terms.
- This should support a continued expansion in global auto sales over this horizon. We have penciled in global auto sales growth of about 6% and 7% in 2022 and 2023, respectively (chart 2), with the US driving gains and China and Europe less so.
- We assume global auto production continues to play catch-up for much of 2022 which would mean the pricing environment is likely to remain elevated over this horizon.
- There is a high degree of uncertainty around this outlook but risks have rotated. Whereas 2021 (and 2020) were marked by pandemic-related risks, the potential for policy missteps is high in 2022 with global markets signalling discomfort that central banks may overshoot their withdrawal of support. The slowdown in China as well as geo-political risks also cloud the outlook.
A WRAP FOR 2021 GLOBAL AUTO SALES
After the eye-popping rebound in global auto sales towards the end of 2020, it was mostly downhill for global auto purchases through 2021. By year-end, annual sales totaled about 67 mn for a 4.5% y/y increase. Sales had started the year on a very strong note with annualised sales bouncing around 72 mn units in the first months of the year, but this was followed by monthly declines thereafter as the semiconductor chip shortage hobbled auto production around the world and constrained sales activity. By December 2021, the annualised sales rate was only 64 mn units.
No region was unscathed in 2021 though there were some regional differences. Broadly speaking, at one end of the spectrum were the countries and regions where pandemic-related factors had decimated 2020 auto sales and continued to do so through much of 2021. These include many Western European countries, as well as Japan, where structural factors have also affected the recovery. For example, Western European sales posted the only regional decline in 2021 with a -2% y/y contraction on top of the massive -24% y/y decline in 2020. Annual sales in 2021 stood at 73% of pre-pandemic sales in 2019. With structural headwinds ahead including an aggressive shift to EVs, its auto sales recovery is likely to continue to lag other regions. Japanese auto sales also saw another drop in 2021 (-3% y/y) on the heels of the -12% decline in 2020. Annual sales in 2021 had recovered 86% of pre-pandemic sales but levels had already been sliding in the years before. A mediocre economic growth forecast suggests its auto sales recovery will also lag other markets.
China stands on its own at the other end of the spectrum. Light vehicle sales grew by over 6% y/y in 2021, despite a relatively soft decline of ‘only’ -6% y/y in 2020. Sales activity had fully recovered pre-pandemic levels in 2021, and we expect it still has modest gains ahead. We have pencilled in sales expansion in the order of 3% y/y in the next two years.
North American auto sales offered a mixed story. Regional sales posted a 3.8% y/y improvement in 2021, with Canada and Mexico marginally pulling up the regional average (US: 3.1% y/y; CAN: 7.8% y/y; MEX: 6.8%). The slight over-performance was mostly a factor of the much deeper declines in 2020 relative to the US. Regional auto sales stood at about 89% of pre-pandemic levels with both Canada and the US at this mark while Mexican sales still sit 77% below 2019 levels. There should still be some rebound activity left—particularly in the US and Canada—in the years ahead as inventory recovers.
Smaller South American markets are the unsung stars. While regional sales posted a healthy 11% improvement in 2021 (following the -26% decline in 2020), the Chile-Colombia-Peru troika saw auto sales rebound by 46% y/y in 2021. Chilean sales expanded by over 60% y/y with levels at 110% of pre-pandemic sales. These countries likely have solid sales ahead still.
See Box 1 for an overview of global auto sales for the month of December. Box 2 provides an update on Canadian provincial auto sales trends, including latest available electric vehicle sales. Going forward, the Global Auto Report will also incorporate content from the Auto News Flash into one monthly report.
LOOKING AHEAD AT 2022
The safest prediction for 2022 global auto sales is that the outlook is likely to continue to be uncertain and volatile. The biggest lesson from 2021 may well have been to hedge any predictions—or not make any at all. But with a view to at least understanding if or when the wheels fall off, we have identified some themes and predictions for the year ahead that we will be monitoring.
1. DEMAND DOESN’T DISAPPOINT
Consumer demand still has some steam left. The global economy is set to expand by 4.3% in 2021 according to Scotiabank Economics’ latest forecasts. While this is softer than the estimated 6.2% expansion in 2021, it is still comfortably above the 3.7% average in the decade preceding the pandemic. Household consumption is expected to continue to drive the expansions in Canada and the US, for example, over the course of 2022 and 2023. In the most recent Canadian Survey of Consumer Expectations, households expected their spending to increase by 4.7% over the next 12 months including 4.9% on durable goods such as vehicles and appliances.
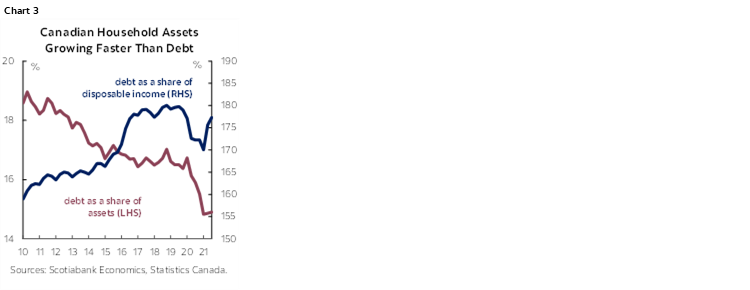
The stimulus-driven spending boosts are mostly behind us. Temporary surges in household disposable income owing in large part to government transfers will no longer feature as prominently. These transfers, along with forced savings, easy financial conditions and shifting pandemic preferences were behind a surge in mortgage debt among Canadians, coupled with a consolidation in other consumer debt earlier in the pandemic. This temporarily distorted metrics like debt-to-income and debt-to-net worth, which showed substantial improvements against higher equity-backed debt and appreciating housing and market assets (chart 3). This created some headroom, but these indicators are starting to normalize. In an environment of rising interest rates, more attention will likely be paid to debt service ratios. This ratio stood at 13.3% in the latest read—below the pre-pandemic level near 15%—suggesting there is still a comfortable margin to adjust over time, particularly as half of this stems from mostly-fixed mortgage debt.
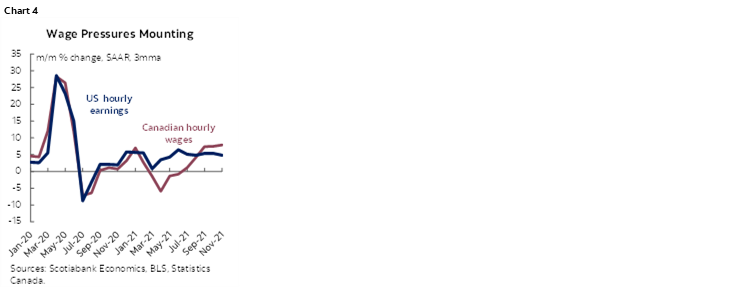
Tight labour market conditions are likely to underpin household incomes. Canadian labour markets are at ‘full employment’; while this is a less-than-precise metric, persistence in wage growth suggests we are there (chart 4). Household disposable income also continued to grow at an average pace of 2% q/q (sa) in the first three quarters of 2021. The signal from business is also clear with over three-quarters of those surveyed in the recent Business Outlook Survey citing serious labour shortages (and wage pressures) ahead. Given our expectation that labour markets will likely tighten further over the horizon, particularly as service sectors re-open, this points to continued gains in disposable income.
This combination of income and balance sheet effects is likely to support a continued appetite for consumption including for automobiles. Scotiabank Economics’ models find Canadian auto demand is driven over the long run by national wealth, household income, and credit conditions. Over the course of the economic cycle, fluctuations in auto sales around trend levels can be driven by changes in disposable income, house prices, stock markets, policy rates and consumer expectations. Model-driven estimates of auto demand put it back to pre-pandemic levels already in Canada and even above in the US.
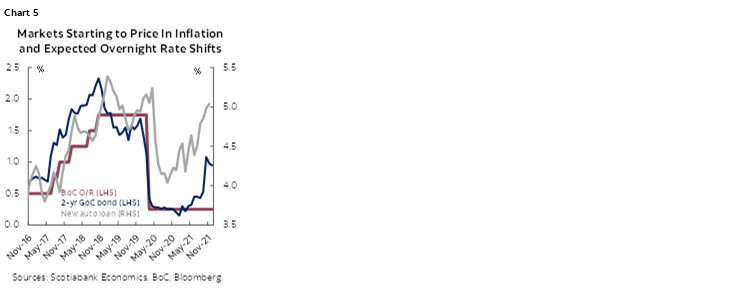
While tightening credit conditions will likely provide some headwinds to demand in Canada, these other factors are likely to drive a longer tail to the expansion of auto sales. In Canada, where consumer loan pricing is more directly influenced by the overnight rate and government bond yields, financing costs had already started to pick up through 2021 at least in nominal terms (chart 5). Consumer loan rates were up by about 60 bps through November 2021. This falls well-short of wage appreciation over this period. On the other hand, new vehicle price inflation eclipses wage growth, but consumers so far don’t appear to be flinching (more later).
2. PRODUCTION CONTINUES TO PLAY CATCH-UP
Auto production shortfalls—and pent-up demand—carried into 2022 are substantial. AutoForecast Solutions estimated 11 mn fewer vehicles were produced last year owing to the global semiconductor chip shortage. For North America, the number is about 3 mn according to the same source. Wards Automotive revisions over the course of the year put the number closer to 2 mn fewer vehicles. Either way, this is a substantial number of vehicles that otherwise likely could have been sold in a high-demand environment last year.
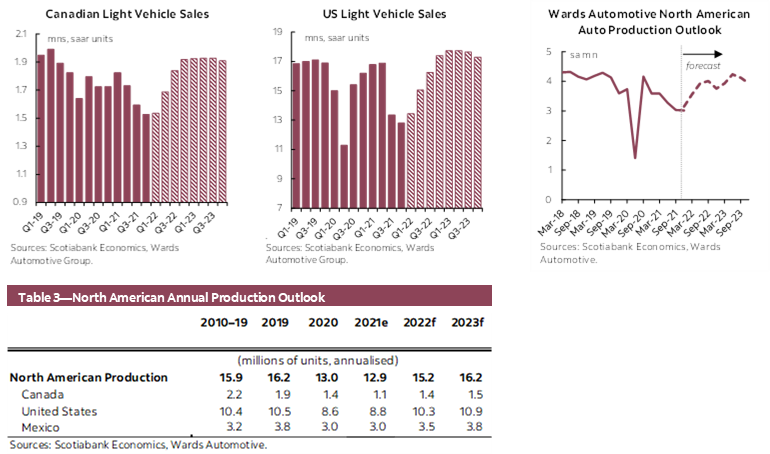
North American auto production was largely flat in 2021 , following the -20% production decline in 2020. Just under 13 mn vehicles were produced in the region last year, well-below the 16.2 mn vehicles produced in 2019 and the all-time high of almost 17.7 mn vehicles produced in 2016. Regional auto sales—in contrast—posted positive gains of almost 4% y/y in 2021, widening the supply-demand imbalance that had begun in 2020 as auto sales similarly outstripped production. (There is little sign of import leakage as global auto production was impacted by shortages in 2021.)
Auto production showed tentative signs of recovery towards the end of 2021, but from still-depressed levels (chart 6). In North America, December auto production increased by 2.5% m/m (sa) for a third consecutive month of gains, but the seasonally adjusted production rate stood just below 13 mn units. December is normally a slower month for production and it is still unclear if omicron-related impacts through further supply chain disruptions will stall the recovery once again in what has otherwise been a stall-start pattern with each pandemic wave.

Production is expected to continue strengthening—albeit with volatility—over the course of 2022. Wards Automotive’s latest production forecasts envision double-digit acceleration in the first two quarters of the year with some slowing-but-still-positive improvements over the second half of 2022. It expects annual production of 15.3 mn vehicles by year-end at a level still over 5% shy of pre-pandemic levels. This production gap is closed only in 2023, according to Wards’ forecasts, with 16.2 mn vehicles produced.
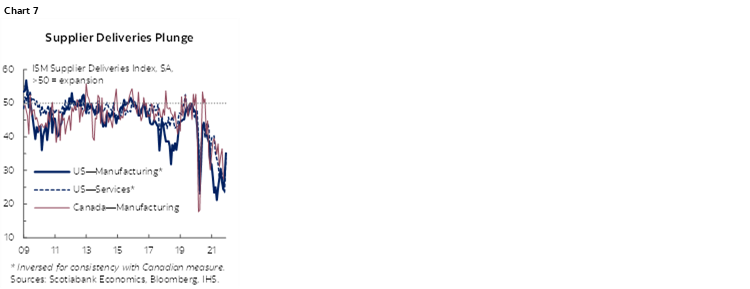
It would not be unreasonable to expect the recovery to stall in the first quarter, pushing the rebound further out in the year. While global chip production has been picking up, constraints are now broad-based—from materials to labour to transportation—resulting in a substantial deterioration in supplier delivery times (chart 7). Scotiabank Economics’ latest forecasts are predicated on an assumption that supply chain conditions will still be normalizing into 2023 (see an interesting analysis on the implications for inflation here). One positive sign is that there have been few auto production revisions so far in January, something that automakers had been doing on a biweekly basis for much of the past year. But it would be premature to write-off this risk just yet.
3. FEW FALLBACKS IN THE USED MARKET
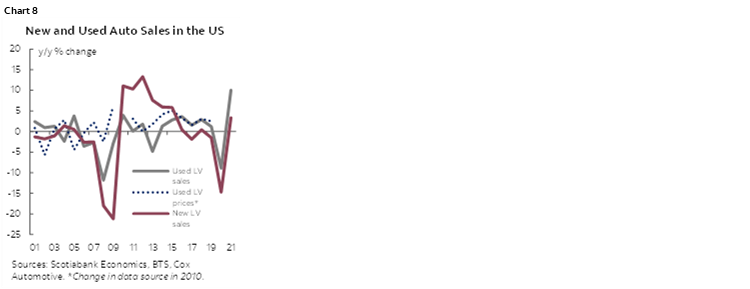
At the risk of stating the obvious, used vehicle markets are defying past patterns...but not necessarily logic. Data is fairly limited so these are more approximations and observations than hard numbers. The decline in US used vehicle sales in the first year of the pandemic (i.e., 2020) was more modest than that of new vehicle sales (-9% y/y versus -15% y/y) in a pattern broadly consistent with past economic cycles (chart 8). Usually in the initial phase of an economic downturn in the US, total vehicle sales take a hit, but used vehicles less so as some demand shifts from new to used amidst uncertainty and income loss. As a recovery takes hold, growth then rotates towards new vehicles at which point used vehicle demand softens, or even turns negative.
In 2021, used vehicle sales strengthened considerably even as new vehicle demand was surging in the US. Cox Automotive has reported annual used vehicle sales of 40.9 mn units in 2021 for a 10% gain relative to 2020—and substantially stronger than the 3% y/y increase in new vehicle sales last year. Used vehicle demand was likely a factor of limited new vehicle inventory, as well as new demand from drivers that otherwise may have relied on public transit. Despite elevated prices—or perhaps because of elevated prices—used vehicle sales on a unit basis hit a 15-year high as older inventory was brought to market opportunistically. (Reports from Black Book suggest higher wear-and-tear on many used vehicles entering the market, providing some offset to otherwise depleted inventory.)
Decimated fleet sales in 2020 would only start impacting used vehicle supply in 2021. Recall, fleet sales traditionally comprised about 20–25% of total new vehicle sales in the US. Prior to the pandemic, rental vehicles would typically be driven for an average of 18 months before hitting used vehicle markets, but rental companies are reportedly holding on to inventory much longer given limited replenishment options. This delayed return-to-market effect in 2021, compounding the lack of fleet purchases in 2020, suggests fleet channels will continue to constrain used vehicle supply through 2022 at least. Lease extensions and depressed delinquencies have similarly depleted used supply.
Used vehicle inventory is likely to remain relatively tight in 2022. Supply should improve slowly over this horizon, roughly in line with our expectations around new vehicle inventory, but it would unfold into an environment of pent-up demand for fleet, particularly as travel activity picks up. Furthermore, as the economic cycle matures, more demand should shift to used vehicles (provided they are affordable). While we do not typically forecast used vehicle sales given data constraints, it would be reasonable to expect used vehicle sales in Canada and the US to show modest-to-flat improvements in 2022 sales with supply (and relatedly, prices) being the limiting factor.
4. PRICES PROVE PERSISTENT
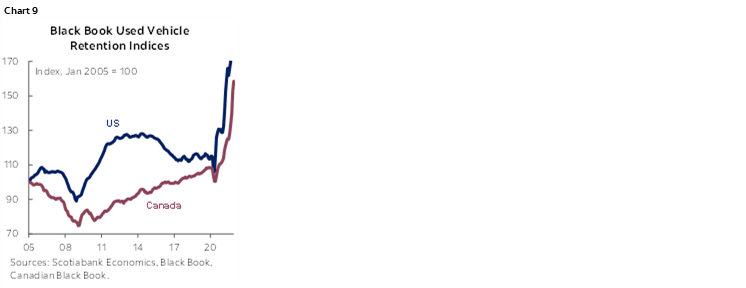
The auto market was at the centre of the inflation debate last year around the world. New vehicle price inflation as measured by CPI was almost 6% y/y (annual) in the US, and just over 5% y/y in Canada. Comprising about 6-7% of baskets, it has had a material impact on inflation prints with little sign of abatement. Cox Automotive has reported that the average transaction price for new vehicles in the US climbed by almost 14% in 2021 (to USD 47,000). JD Power reported December transaction prices were up 20% y/y. Used vehicle price increases have been even more stark: Black Book retention indices have shown valuations escalating through 2021 in Canada and the US (chart 9). As measured in US inflation data, used vehicle prices appreciated by an astronomical 26% y/y in 2021.
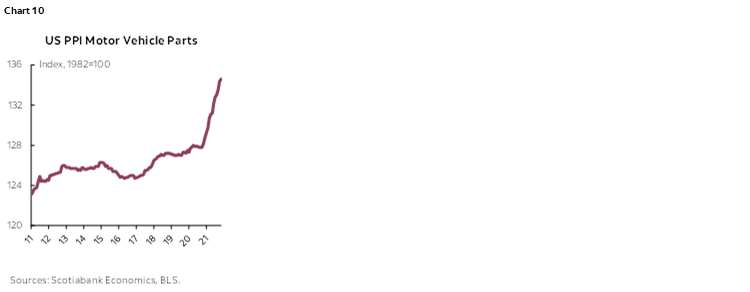
An elevated pricing environment is likely to persist through 2022 for the automotive sector. Producer prices continue to climb with the US PPI motor vehicle parts index surging by 6% over 2021 after only modest increases in the range of 1-2% in the years prior (chart 10). Given our expectation that supply chain delays and labour constraints will continue through 2022, this is likely to put upward pressure on production costs over this horizon. In light of industry pricing practices—and the potential for non-linear price shifts with new model rollouts—there may very well be further upside to new vehicle price pressures. Structural shifts may also impose higher production costs: carrying higher inventories and reshoring and/or diversifying strategic inputs over the medium term could translate into higher consumer price tags. Higher inventory and greater selection (including cheaper models) may offset these forces, but only partially.
It is worth kicking the tires around price assumptions in the used vehicle market since trends are less clear-cut. In the US, price drops associated with economic downturns are evident (with the exception of this downturn as noted earlier), but there has been at least one notable prolonged price correction in a period of slowing economic growth versus an outright downturn. Used vehicle sales (and new) were slowing into the years heading into the GFC. Transaction prices pulled back by an average of -3% in 2006 and 2007, according to US BTS data in a trend also observed in Black Book’s retention values. Used vehicle sales hit a two-decade high (at 44 mn vehicles) in 2005 before starting to slide into the GFC with sales not hitting the 40 mn mark until 2018. They’ve hovered at that level until the pandemic hit. With 2021 sales at about 41 mn, the strong pricing environment likely speaks to strong demand, but there are likely limits to consumers’ willingness (or ability) to pay. Price appreciation should slow in 2022—or even turn mildly negative—and look good on a year-over-year basis—but may still pose affordability challenges as sales increasingly rely on the more traditional buyer.
5. SETTING THE STAGE FOR ELECTRIC VEHICLE SURGE IN CANADA (?)
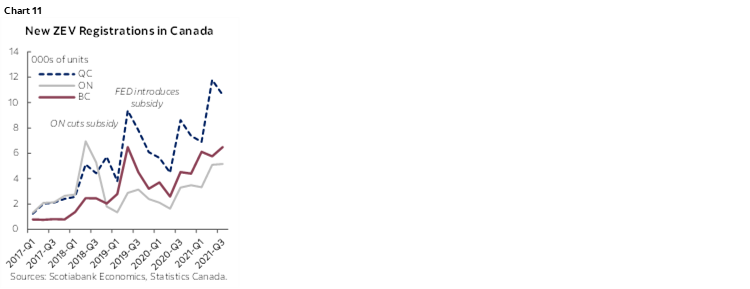
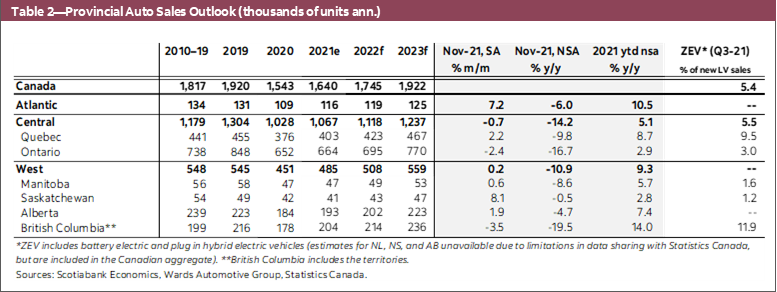
Canadian electric vehicle sales hit a new milestone last year, albeit with some caveats. Just-released data from Statistics Canada shows that electric vehicle sales in the third quarter of 2021 in Canada surpassed the 5% threshold, i.e., 5.4% of all new vehicle sales were electric) for the first time. They had flirted with this milestone in the second quarter at 4.9%. However, on a unit basis, EV sales were flat for the quarter with depressed traditional engine vehicle sales inflating the EV sales ratio. British Columbia and Quebec continue to drive increases in the EV market with the share of total sales ratios at 11.9% and 9.5%, respectively (see table 2, back).
This could (or should) be the year that EV sales start accelerating in Canada. Electric vehicle sales have been driven in large part by provinces with more generous purchase incentives. The Ontario ratio sits stubbornly closer to 3% as EV sales stagnated when consumer rebates were rescinded three years ago (chart 11). With elections looming and the province investing substantially on the supply side, it could be reasonable to see some form of purchase incentive back on the table in Ontario. Ontario—and hence national—EV sales are unlikely to see leaps and bounds in 2022 even with purchase incentives, not least because of still-limited inventory, but it could set the stage for an acceleration in sales in 2023 as model selection (including more affordable options) are set to increase substantially. The numbers still wouldn’t change the global landscape materially but would provide more credibility in the race for market share. With one-in-three, one-in-four, and one-in-five vehicle purchases electric in Germany, the UK, and China, respectively, in November, Canada still has a long way to go.
Box 1: Trends in Global Auto Sales
Global auto sales strengthened again in December by 4.2% m/m (sa) for a third consecutive month of growth. On an annualised basis, sales sat at a weak 64 mn units in December after trending closer to 72 mn vehicles over the first half of 2021, and still 11.4% (y/y, nsa) lower relative to the same month a year ago. The fourth-quarter global recovery in sales was mostly driven by strong momentum in the Asia Pacific markets, assisted by a slight pick-up in Western Europe.
North American markets ended the year on a low note as sales contracted again by -2.3% m/m (sa) in December, 24.2% (y/y, nsa) lower relative to the same month a year ago. US auto sales pulled back in December by -3.6% m/m (sa) for a second consecutive month of decline, sitting at a very weak annualised sales rate of 12.4 mn vehicles, giving up almost all the gains in October. On an unadjusted basis, 12 mn vehicles were sold in December, an improvement from the 10 mn units sold in November, yet well below levels recorded during the end-of-year shopping seasons in recent years. In Canada, Wards Automotive sales growth of .3% m/m (sa) in December.
Asia Pacific continued leading the recovery with a solid 8.5% m/m (sa) rebound in December, almost back to the same level as in the same month a year ago. Japanese auto sales have been at full steam and rose by another 6% m/m (sa) in December after two months of double-digit growth, although still struggling to get back to levels before the production disruptions (-11.4% y/y, nsa). Chinese auto sales—representing over 60% of the Asia Pacific light vehicle market—picked up further by 9.4% m/m sa in December, fully recouping the sales losses from the chip shortage. Indian auto sales continued the recovery from September’s dip with an impressive 9.3% m/m growth (sa) in December.
Western European auto sales recorded a smaller improvement in December but masked differences across countries. After a volatile year with some double-digit m/m declines since the summer, German auto sales jumped by 16.4% m/m (sa) in December, yet still down by -26.9% y/y (nsa). Spain and France both saw sales recovery slow down in December (2.32% m/m sa and 0.9% m/m sa, respectively). Italian auto sales grappled with the impact of production disruptions and pulled back by 3.9 m/m (sa) in December, 27.5% (y/y, nsa) lower relative to the same month a year ago. After two months of strong gains, UK auto sales posted a 7.1% m/m decline (sa) in December.
Latin American sales posted another positive m/m gain for a second consecutive month in December at 4.7% (sa). Brazil led the regional growth (11.3% m/m, sa) and Mexico ended the seven-month streak of decline with a 7.8 m/m gain (sa) in December. Argentina reversed some of the gains in the past three months with a -9.8% m/m decline (sa) and Peru also recorded a contraction (-11.1% m/m sa). Overall, Latin American auto sales stood at -10% lower relative to the same month a year ago.
Box 2: Trends in Provincial Auto Sales
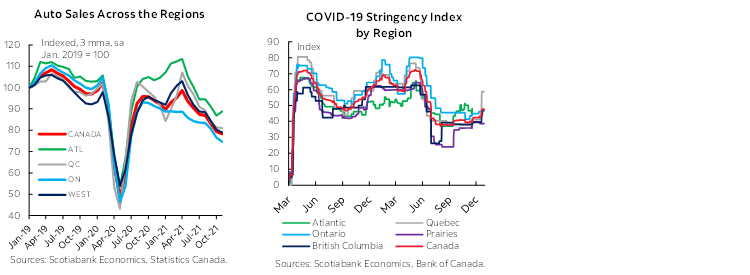
Lagging provincial auto sales data confirm a challenging environment for auto sales recovery across the country. DesRosiers Automotive Consultants Inc. had earlier reported a -7.6% m/m retreat (sa) in November following October’s modest gain (1.3% m/m, sa), while Wards Automotive tabulated a +1.8% m/m (sa) improvement in the same month, both are estimated OEM sales. November auto sales data from Statistics Canada—reporting on vehicle registrations—pointed towards a -0.1% m/m sa continued decline for the fifth consecutive month with Ontario and British Columbia driving the decline as all other provinces posted improvements.
All data sources point to auto sales trending down since early Spring last year across the country as inventory shortages eclipsed the broader economic recovery. Towards the end of 2020 and early 2021, there had been some notable differentiation across markets: Atlantic Canada’s auto sales recovery was less impacted by pandemic restrictions; Quebec’s shorter and less stringent lockdowns, along with robust economic fundamentals drove an earlier surge in auto sales; Ontario’s weaker economic path—in large part owing to broader pandemic effects—weighed more heavily on its auto sales; while Western Canadian sales were fueled by rebounding commodity prices and stronger economic fundamentals in British Columbia.
However, inventory shortages have universally pulled down sales across the regions since then. Despite weak signs of stabilizing in some regional markets, November auto sales data kept up this broad-based trend. On a year-to-date basis, Atlantic Canada, Quebec and British Columbia continue to perform above the national average, with sales in Saskatchewan and Ontario barely improved since the most difficult year in recent history.
With additional restrictions enacted towards the end of December to varying degrees across provinces, pandemic factors are likely to continue to affect auto sales in the months ahead. It will likely only be well into 2022 before we start to see differentiation across markets based on more traditional economic drivers as limited inventory continues to put a cap on auto sales in an environment of pent-up demand.
Quarterly Outlook for North American Auto Sector
DISCLAIMER
This report has been prepared by Scotiabank Economics as a resource for the clients of Scotiabank. Opinions, estimates and projections contained herein are our own as of the date hereof and are subject to change without notice. The information and opinions contained herein have been compiled or arrived at from sources believed reliable but no representation or warranty, express or implied, is made as to their accuracy or completeness. Neither Scotiabank nor any of its officers, directors, partners, employees or affiliates accepts any liability whatsoever for any direct or consequential loss arising from any use of this report or its contents.
These reports are provided to you for informational purposes only. This report is not, and is not constructed as, an offer to sell or solicitation of any offer to buy any financial instrument, nor shall this report be construed as an opinion as to whether you should enter into any swap or trading strategy involving a swap or any other transaction. The information contained in this report is not intended to be, and does not constitute, a recommendation of a swap or trading strategy involving a swap within the meaning of U.S. Commodity Futures Trading Commission Regulation 23.434 and Appendix A thereto. This material is not intended to be individually tailored to your needs or characteristics and should not be viewed as a “call to action” or suggestion that you enter into a swap or trading strategy involving a swap or any other transaction. Scotiabank may engage in transactions in a manner inconsistent with the views discussed this report and may have positions, or be in the process of acquiring or disposing of positions, referred to in this report.
Scotiabank, its affiliates and any of their respective officers, directors and employees may from time to time take positions in currencies, act as managers, co-managers or underwriters of a public offering or act as principals or agents, deal in, own or act as market makers or advisors, brokers or commercial and/or investment bankers in relation to securities or related derivatives. As a result of these actions, Scotiabank may receive remuneration. All Scotiabank products and services are subject to the terms of applicable agreements and local regulations. Officers, directors and employees of Scotiabank and its affiliates may serve as directors of corporations.
Any securities discussed in this report may not be suitable for all investors. Scotiabank recommends that investors independently evaluate any issuer and security discussed in this report, and consult with any advisors they deem necessary prior to making any investment.
This report and all information, opinions and conclusions contained in it are protected by copyright. This information may not be reproduced without the prior express written consent of Scotiabank.
™ Trademark of The Bank of Nova Scotia. Used under license, where applicable.
Scotiabank, together with “Global Banking and Markets”, is a marketing name for the global corporate and investment banking and capital markets businesses of The Bank of Nova Scotia and certain of its affiliates in the countries where they operate, including; Scotiabank Europe plc; Scotiabank (Ireland) Designated Activity Company; Scotiabank Inverlat S.A., Institución de Banca Múltiple, Grupo Financiero Scotiabank Inverlat, Scotia Inverlat Casa de Bolsa, S.A. de C.V., Grupo Financiero Scotiabank Inverlat, Scotia Inverlat Derivados S.A. de C.V. – all members of the Scotiabank group and authorized users of the Scotiabank mark. The Bank of Nova Scotia is incorporated in Canada with limited liability and is authorised and regulated by the Office of the Superintendent of Financial Institutions Canada. The Bank of Nova Scotia is authorized by the UK Prudential Regulation Authority and is subject to regulation by the UK Financial Conduct Authority and limited regulation by the UK Prudential Regulation Authority. Details about the extent of The Bank of Nova Scotia's regulation by the UK Prudential Regulation Authority are available from us on request. Scotiabank Europe plc is authorized by the UK Prudential Regulation Authority and regulated by the UK Financial Conduct Authority and the UK Prudential Regulation Authority.
Scotiabank Inverlat, S.A., Scotia Inverlat Casa de Bolsa, S.A. de C.V, Grupo Financiero Scotiabank Inverlat, and Scotia Inverlat Derivados, S.A. de C.V., are each authorized and regulated by the Mexican financial authorities.
Not all products and services are offered in all jurisdictions. Services described are available in jurisdictions where permitted by law.